

The Gaming KPI Dashboard in Power BI is an advanced and dynamic tool designed for gaming companies, game developers, and data analysts to track and analyze the key performance indicators (KPIs) essential to the gaming industry. Whether you’re managing online gaming platforms, mobile game applications, or eSports, this Power BI dashboard provides a centralized view of your gaming metrics, including player engagement, retention, revenue, and in-game purchases.
This powerful tool integrates data from multiple sources and provides detailed insights into game performance, allowing you to make data-driven decisions to enhance gameplay experiences, boost player retention, and optimize revenue streams. With real-time data analysis, you can track game performance at any stage, improve user experience, and fine-tune your strategies for long-term success.
Key Features of the Gaming KPI Dashboard in Power BI
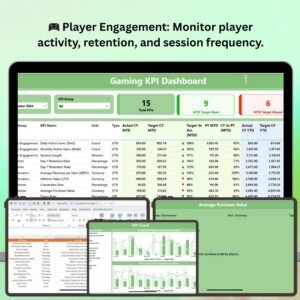
🎮 Player Engagement & Retention Tracking
Monitor player engagement through KPIs such as active users, playtime, session length, and retention rates. Track how often players return to your game and optimize for better user retention.
💰 Revenue & Monetization Metrics
Track in-game purchases, revenue per user, ad revenue, and other monetization KPIs. Understand the financial performance of your game and identify opportunities for additional revenue streams.
⏱ Session Duration & Frequency Monitoring
Measure session durations, frequency of play, and overall activity within the game. These metrics help identify how much time players are spending and whether they are engaged over the long term.
📊 Player Acquisition & Conversion Analysis
Track new player acquisitions, conversion rates from free-to-play to paid, and the success of your marketing campaigns. This helps you assess the effectiveness of your player acquisition strategies.
📈 Real-Time Data Integration
Integrate data from your game platform or analytics tools directly into Power BI, providing you with real-time insights into game performance and player behavior. Monitor KPIs as they change and adapt your strategies accordingly.
⚙️ Customizable & Scalable Dashboard
Tailor the dashboard to your specific gaming needs by adding custom KPIs, adjusting filters, or incorporating other game-specific data points. The dashboard is fully scalable to grow with your gaming business.
Why You’ll Love the Gaming KPI Dashboard in Power BI
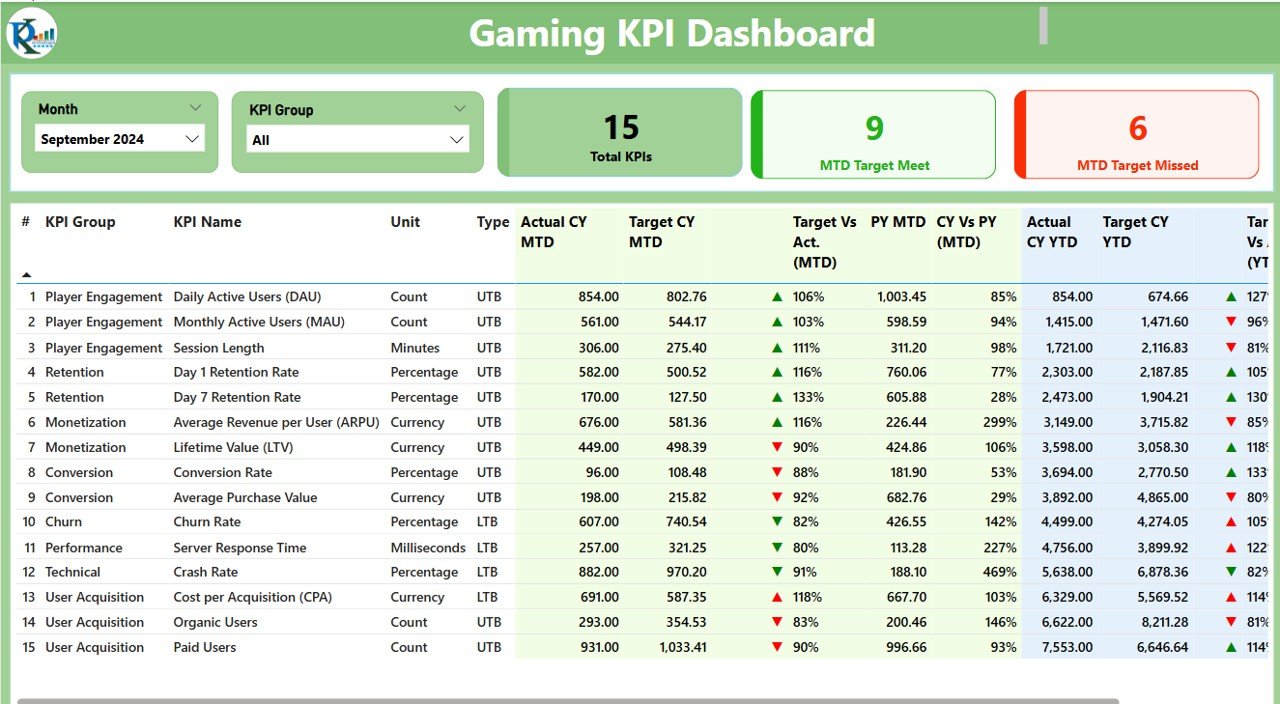
✅ Track All Essential Gaming Metrics in One Place
Access key gaming performance metrics like player engagement, revenue, and session frequency in a single, easy-to-read dashboard.
✅ Maximize Player Retention
Use insights into player retention rates and engagement to optimize game design and keep players coming back.
✅ Optimize Monetization Strategies
Monitor revenue streams like in-game purchases and ad revenue and identify ways to improve profitability.
✅ Make Data-Driven Decisions
Leverage real-time data to make informed decisions on game development, marketing campaigns, and user acquisition strategies.
✅ Customizable & Flexible
The dashboard is fully customizable, allowing you to focus on the KPIs that are most important to your gaming business.
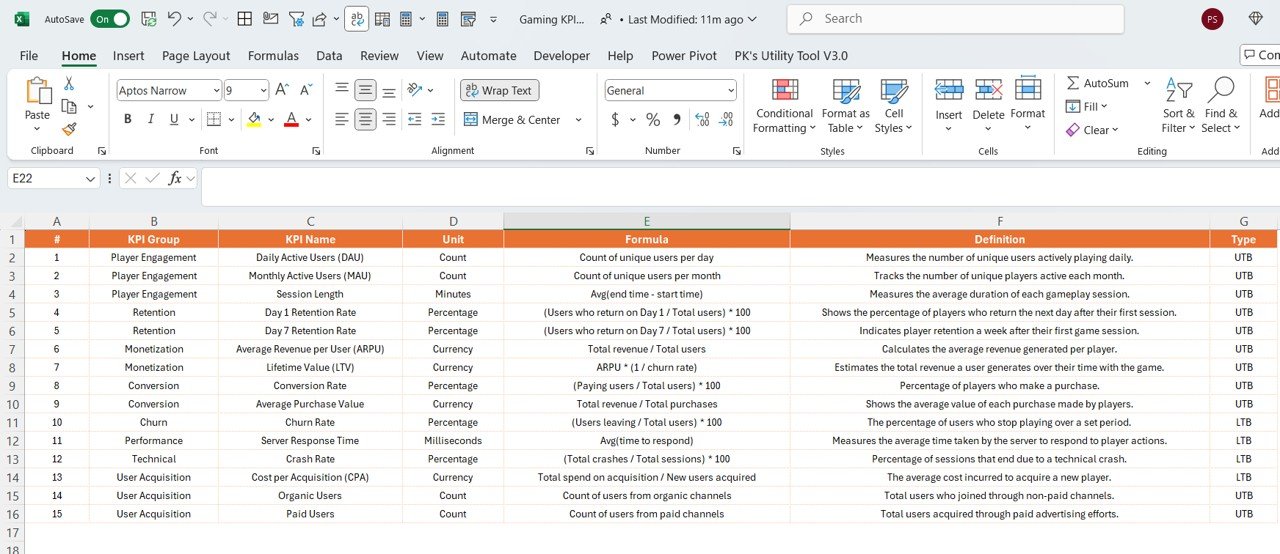
What’s Inside the Gaming KPI Dashboard in Power BI?
-
Player Engagement & Retention Tracking: Monitor player activity and return rates.
-
Revenue & Monetization Metrics: Track in-game purchases, ad revenue, and other financial KPIs.
-
Session Duration & Frequency Monitoring: Measure playtime and session frequency.
-
Player Acquisition & Conversion: Track new players and conversion rates.
-
Real-Time Data Integration: Get up-to-the-minute insights from your game platforms.
-
Customizable KPIs: Adapt the dashboard to your gaming business’s unique needs.
How to Use the Gaming KPI Dashboard in Power BI
1️⃣ Download the Template: Access the Gaming KPI Dashboard in Power BI instantly.
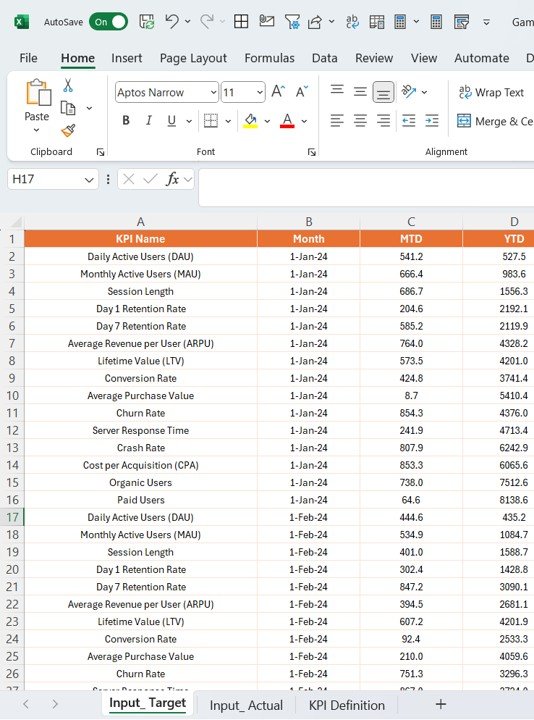
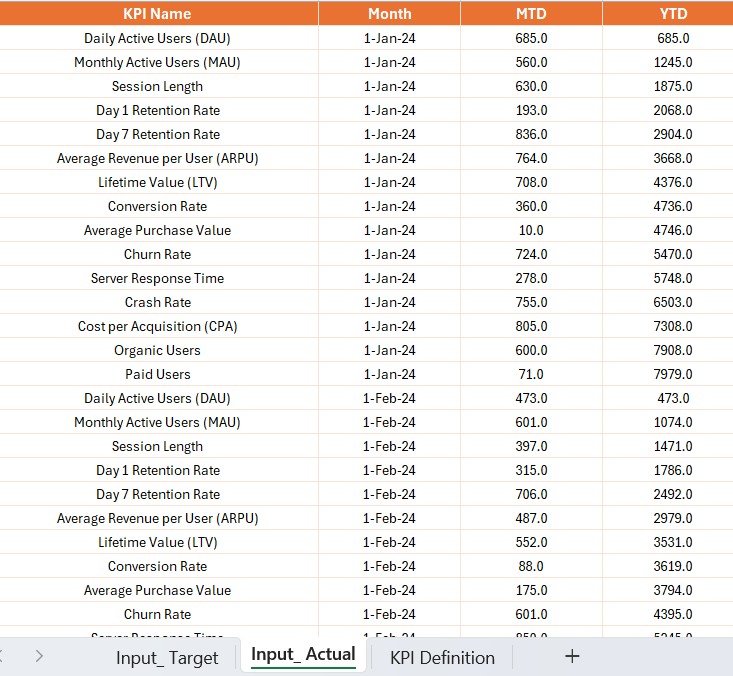
2️⃣ Integrate Your Data Sources: Link your game analytics platform, CRM, and monetization data to Power BI for real-time updates.
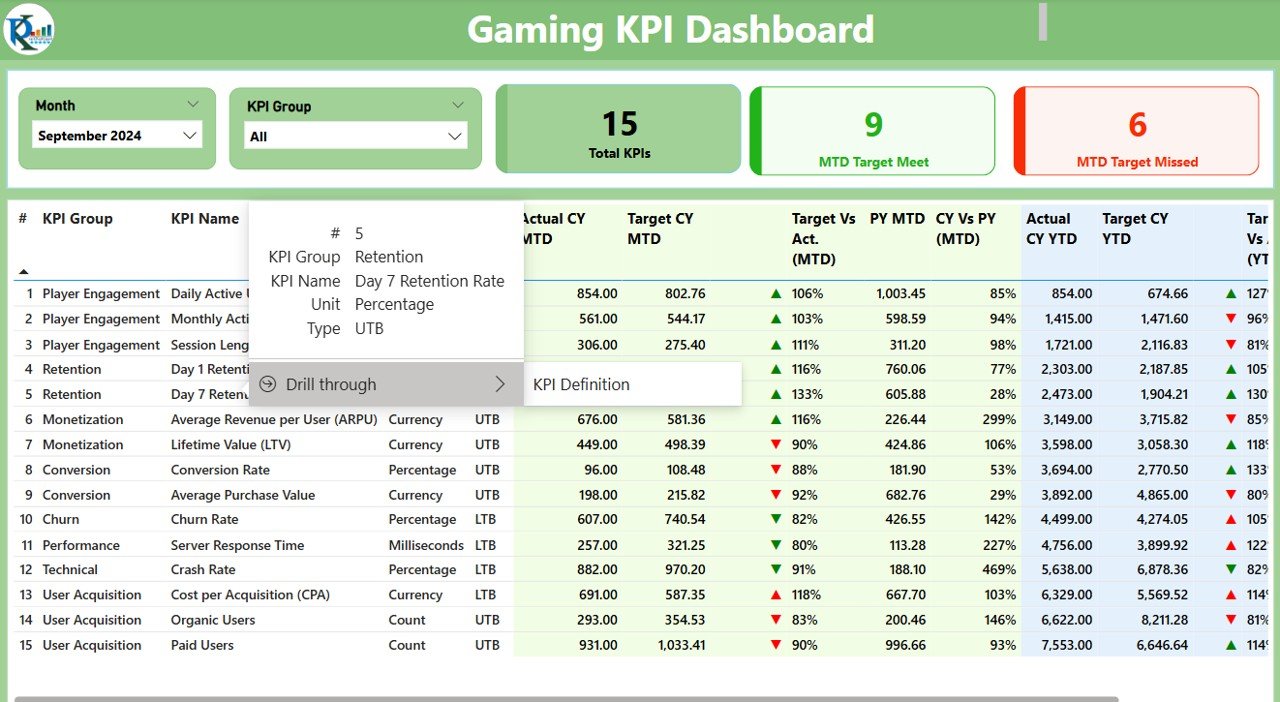
3️⃣ Track Key Metrics: Monitor player engagement, revenue, and other KPIs in real time.
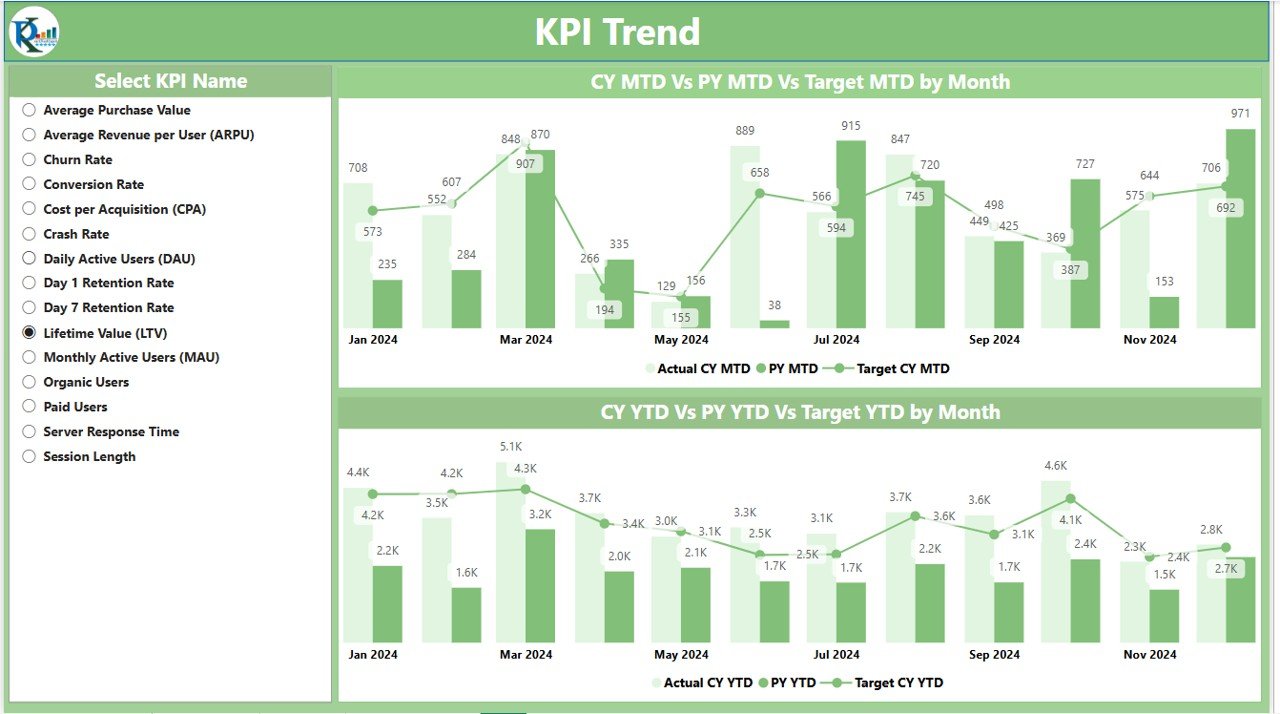
4️⃣ Analyze Performance Trends: Use historical data to analyze performance trends and make adjustments.
5️⃣ Optimize Your Game Strategy: Use the insights to refine your marketing campaigns, improve user experience, and increase revenue.
Who Can Benefit from the Gaming KPI Dashboard in Power BI?
🔹 Game Developers & Publishers
🔹 eSports Teams & Organizations
🔹 Mobile Game Developers
🔹 Gaming Analytics & Data Analysts
🔹 Marketing & Monetization Teams
🔹 Gaming Entrepreneurs & Startups
🔹 Investors in the Gaming Industry
Ensure the success of your gaming platform with the Gaming KPI Dashboard in Power BI. Track key metrics, analyze trends, and optimize your gaming business for maximum growth and profitability.
Click here to read the Detailed blog post
Visit our YouTube channel to learn step-by-step video tutorials
Youtube.com/@PKAnExcelExpert


Reviews
There are no reviews yet.