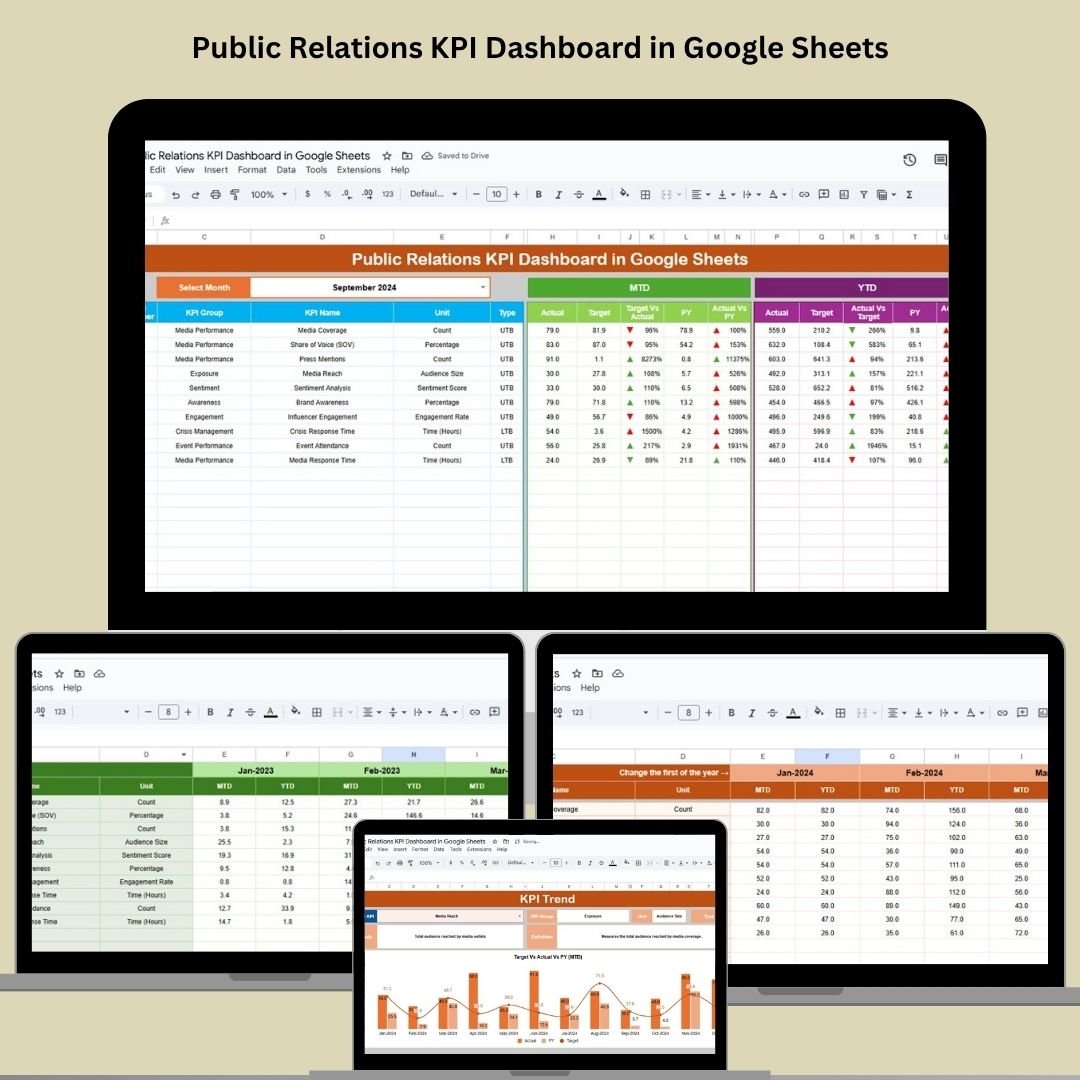
Measure the true impact of your PR campaigns with our Public Relations KPI Dashboard in Google Sheets—a ready-to-use, data-driven tool to help PR teams and agencies monitor media coverage, sentiment, reach, and other essential KPIs in one interactive view. Whether you’re managing a single campaign or your full PR strategy, this dashboard puts insights at your fingertips.

📊 Key Features of the Public Relations KPI Dashboard
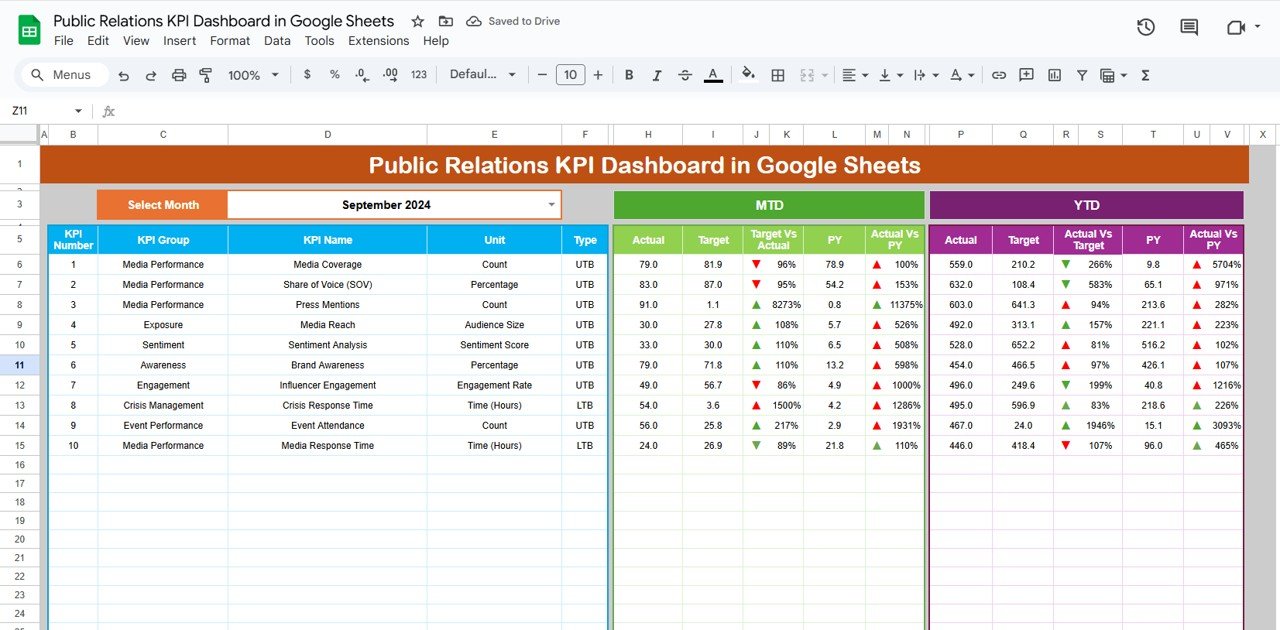
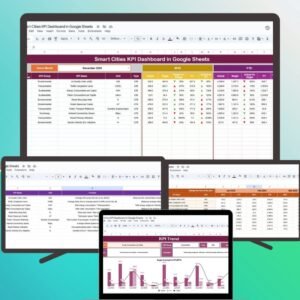
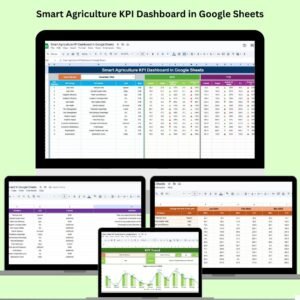
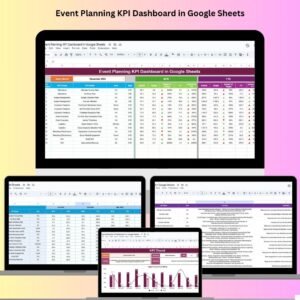
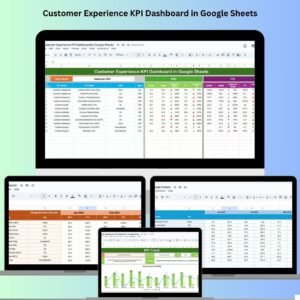
📌 Interactive Dashboard Sheet Tab
-
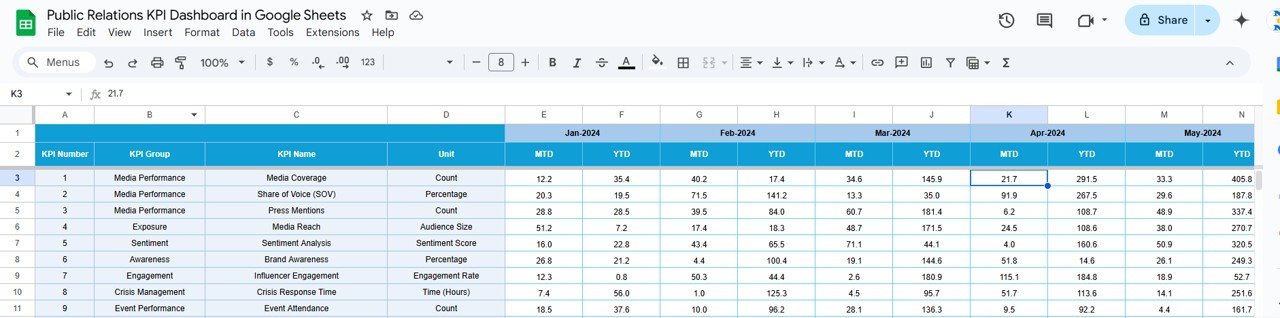
🎯 Track MTD (Month-To-Date), YTD (Year-To-Date), Targets, and Previous Year data
-
⚖️ Visual comparison of Target vs. Actual and PY vs. Actual using conditional formatting
-
🗓️ Select any month from a dropdown (Range D3) to dynamically update all metrics
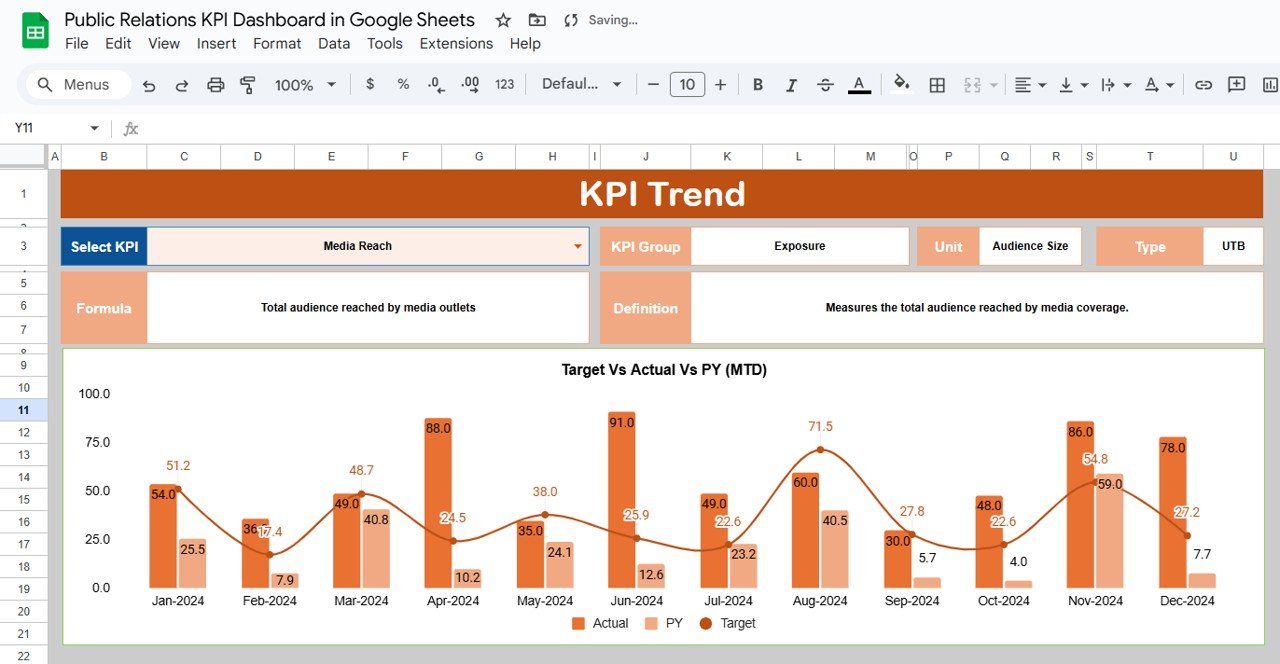
📈 KPI Trend Sheet Tab
-
📌 Choose any KPI and analyze historical trends over time
-
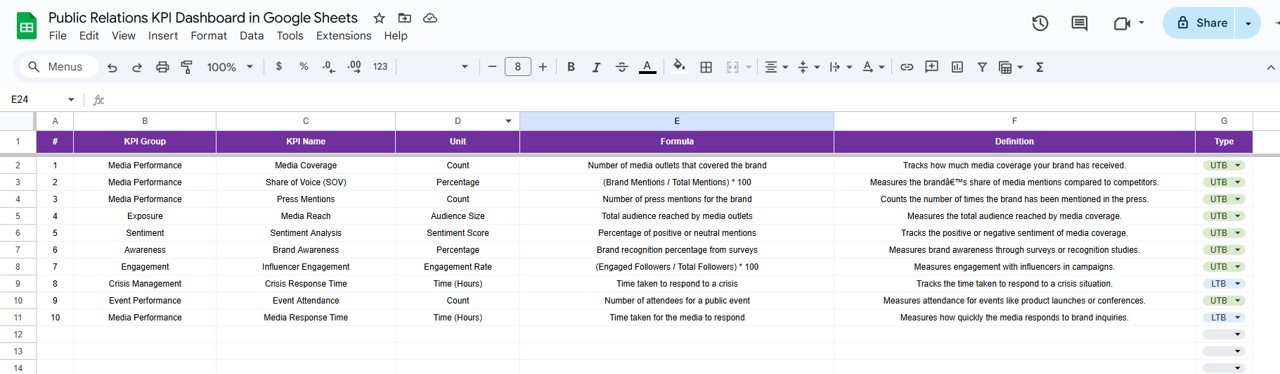
📋 See KPI Group, Unit, Formula, and whether it’s UTB (Upper the Better) or LTB (Lower the Better)
-
🔍 Understand metric definitions for full transparency
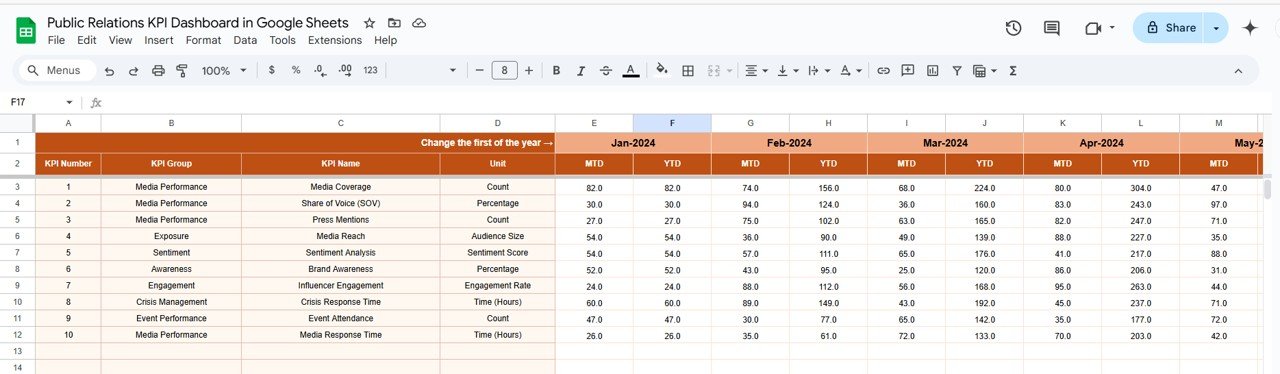
🧮 Data Entry Sheets
-
Actual Numbers Tab – Enter ongoing performance data (MTD & YTD)
-
Target Sheet – Set and update monthly & yearly performance goals
-
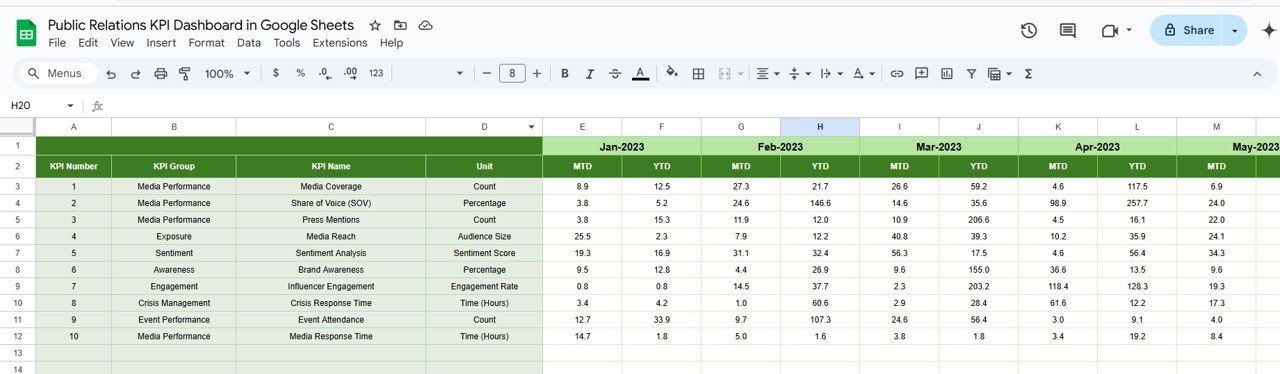
Previous Year Numbers – Store historical data for side-by-side comparisons
📖 KPI Definition Tab
-
Fully documented KPIs with names, formulas, groups, and measurement units for easy team reference
📦 What’s Inside the Public Relations KPI Dashboard in Google Sheets
Your dashboard includes 6 easy-to-use sheets:
1️⃣ Dashboard Sheet – Visual summary of all KPI metrics
2️⃣ KPI Trend Sheet – Analyze individual metric trends over time
3️⃣ Actual Numbers – Input your monthly and YTD PR data
4️⃣ Target Sheet – Define goals for each KPI
5️⃣ Previous Year Sheet – Store past performance data for insights
6️⃣ KPI Definition – Full reference for how each KPI is calculated and categorized
All sheets are interlinked, updating the dashboard in real-time as soon as data is entered.
🚀 How to Use the Public Relations KPI Dashboard
📝 Step 1: Enter MTD, YTD, Target, and PY data into the relevant input tabs
📅 Step 2: Select your desired month from the dropdown (cell D3)
📊 Step 3: Instantly view your performance vs. goals with up/down arrows
📈 Step 4: Dive deeper into trend data in the KPI Trend tab
📤 Step 5: Share the dashboard with stakeholders or export as a PDF
No formulas to write. No tools to install. Just insights, simplified.
👥 Who Can Benefit from This PR Dashboard?
🧑💼 PR Agencies – Track multiple clients, campaigns, or launches
🏢 Corporate Comms Teams – Monitor brand reputation and media effectiveness
📈 Marketing Teams – Align PR efforts with broader campaigns
🎯 Freelance PR Consultants – Present clear performance reports to clients
📰 Media Analysts – Evaluate campaign reach, sentiment, and ROI
Whether you’re focused on press releases, media placements, or brand visibility—this dashboard helps you stay accountable and strategic.
💡 Why This Google Sheets Dashboard is a Game-Changer
✅ 100% Google Sheets – No expensive tools or training required
✅ Real-Time Updates – Enter data and watch the metrics come to life
✅ KPI-Driven Layout – Clear structure for all core PR metrics
✅ Visual Performance Indicators – Know where you stand with arrows & color coding
✅ Customizable – Add your own KPIs, definitions, or formulas
✅ Shareable & Collaborative – Use it with clients, teams, or leadership
Manage your PR campaigns smarter—with data, not guesswork.
🔁 Click here to read the Detailed blog post
Click here to read the Detailed blog post


Reviews
There are no reviews yet.