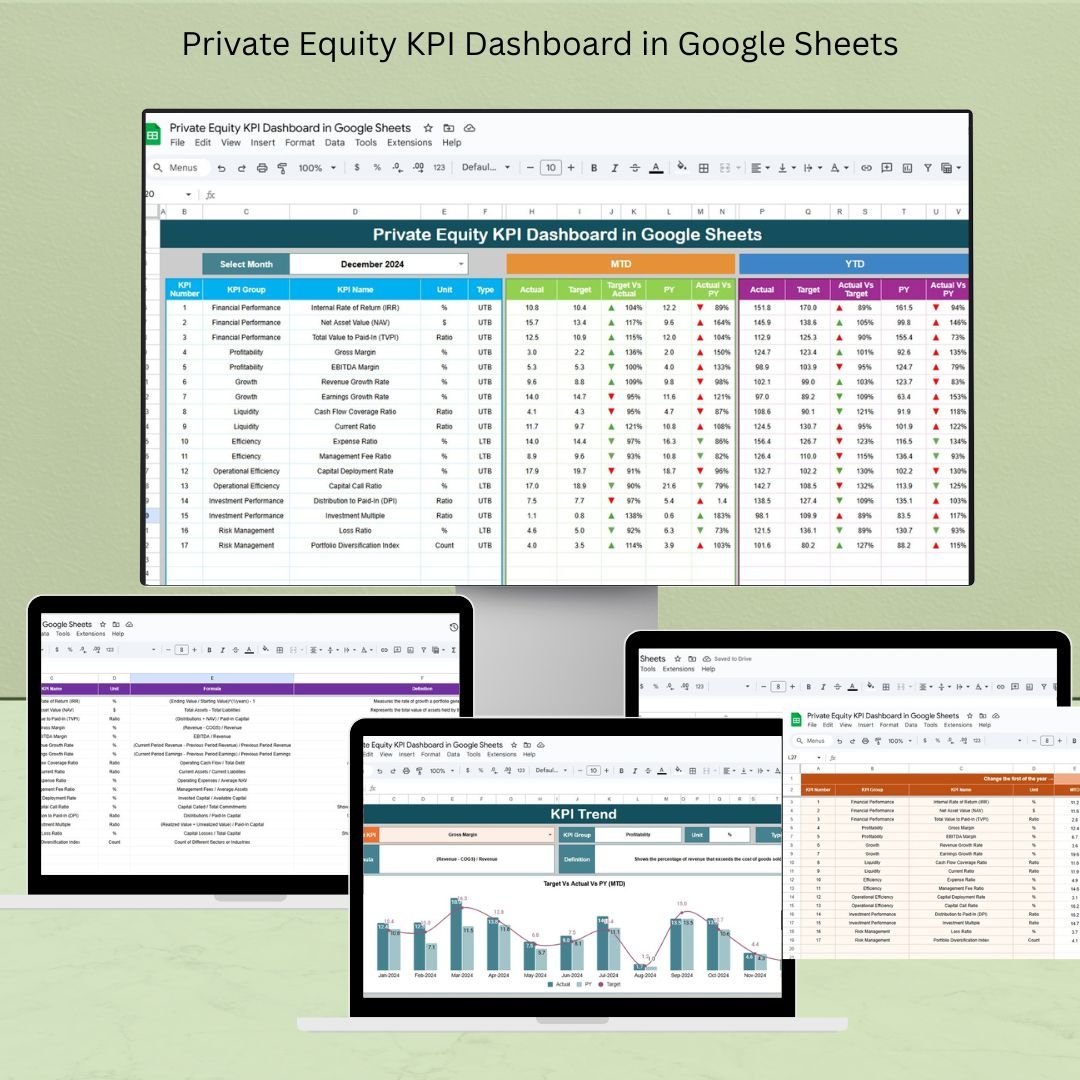
The Private Equity KPI Dashboard in Google Sheets is a powerful and customizable tool designed for private equity professionals to efficiently track, analyze, and visualize key performance indicators (KPIs) relevant to their investments. Whether you’re managing a portfolio of companies or tracking individual investments, this dashboard provides a structured approach to monitor performance and make informed, data-driven decisions.
Key Features of the Private Equity KPI Dashboard in Google Sheets
📊 Investment Tracking
-
Monitor Key Metrics: Track performance metrics such as Internal Rate of Return (IRR), Multiple of Invested Capital (MOIC), and cash-on-cash returns to evaluate the success of each investment.
-
Portfolio Overview: Get a consolidated view of your entire portfolio, including total invested capital, current value, and unrealized gains or losses.
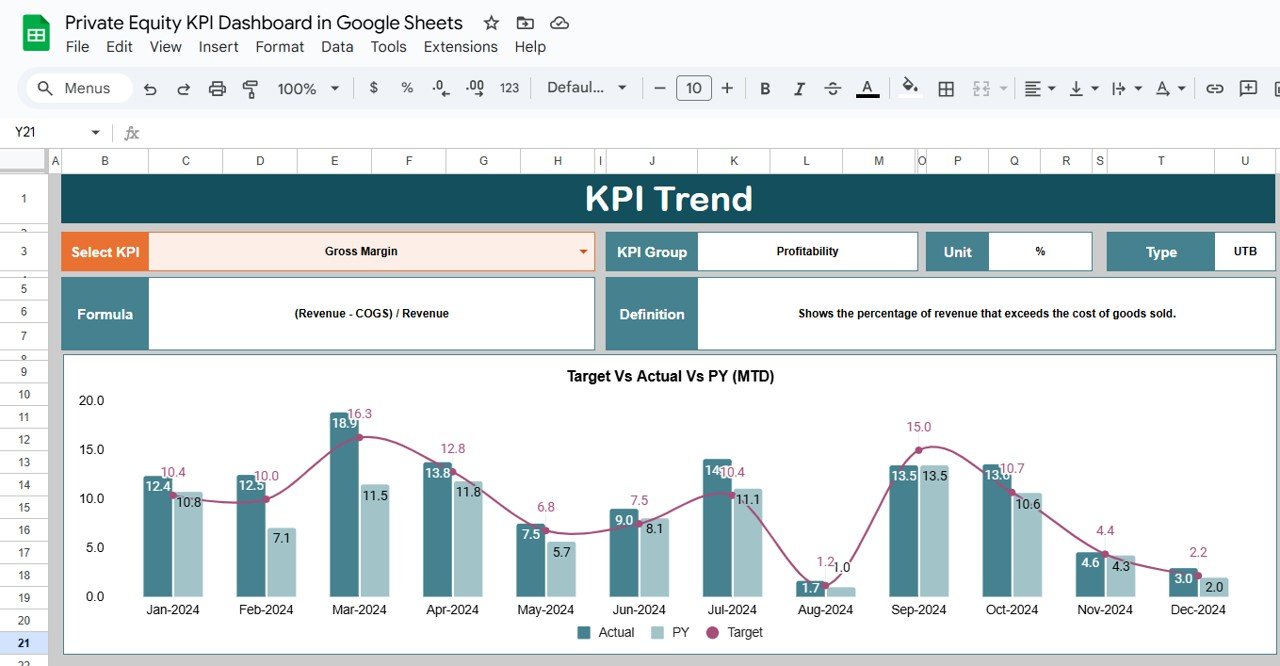
📈 Financial Performance Analysis
-
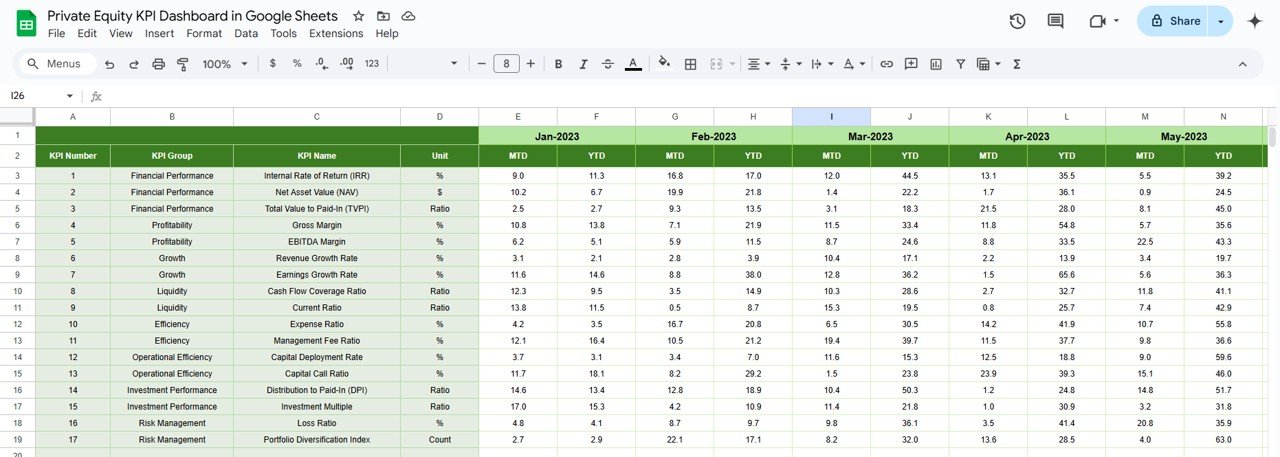
Revenue and Profitability Metrics: Analyze key financial metrics like revenue growth, EBITDA, and net income across your portfolio companies.
-
Financial Trends: Visualize financial trends over time and track the performance of each company in your portfolio.
💼 Exit Strategy Evaluation
-
Track Exits: Evaluate your exit performance by tracking exit multiples, proceeds, and comparing them to initial investment assumptions.
-
Return on Exit: Measure the profitability of exits, ensuring you get the highest return on investments.
🔧 Customizable Templates
-
Flexible and Adaptable: Modify the dashboard to align with your specific investment strategy and reporting needs.
-
Tailored KPIs: Add or remove KPIs based on the unique requirements of your private equity business.
Benefits of Using the Private Equity KPI Dashboard
✅ Better Decision-Making
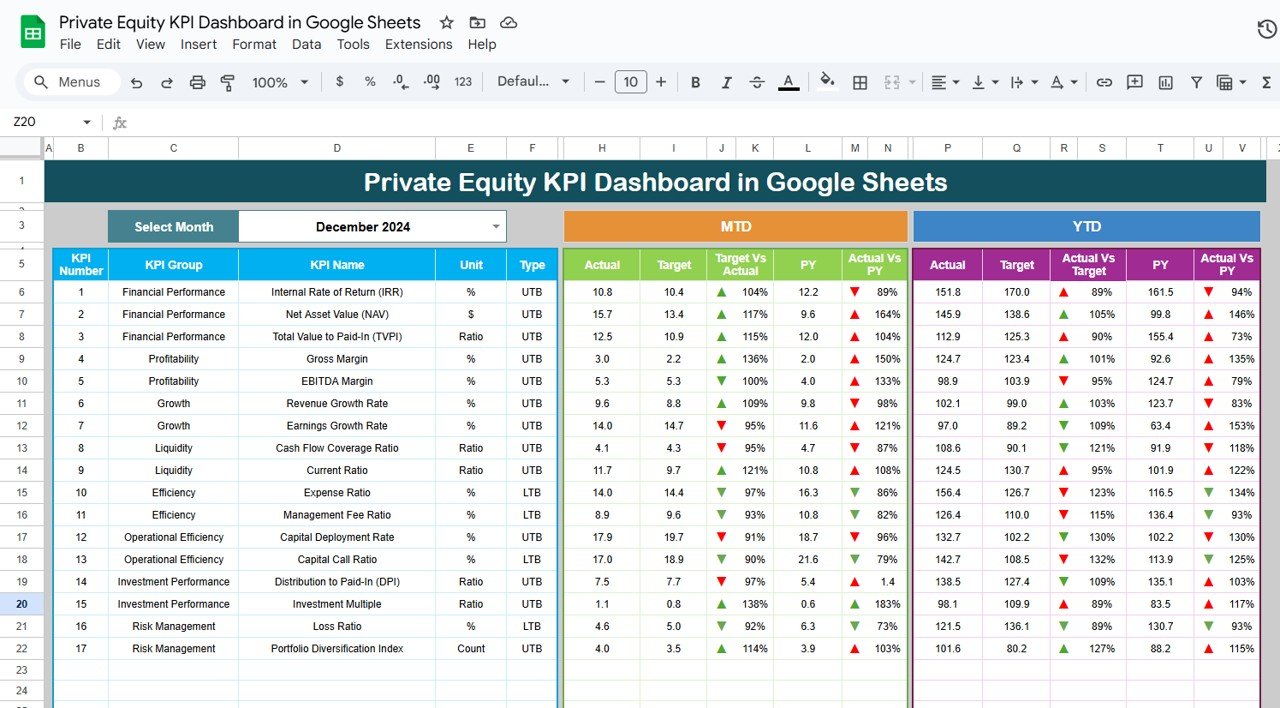
Access real-time data and performance metrics, enabling you to make informed decisions and strategically manage your investments.
✅ Improved Portfolio Management
Monitor your portfolio’s health and identify underperforming investments to optimize returns and enhance overall portfolio performance.
✅ Enhanced Transparency
Generate easy-to-understand reports that can be shared with stakeholders, providing a clear overview of investment performance.
✅ Compliance and Reporting
Ensure that your private equity investments remain compliant with industry regulations while maintaining detailed performance metrics.
How to Use the Private Equity KPI Dashboard in Google Sheets
-
Download the Template: Download the Private Equity KPI Dashboard template and save it to your Google Drive for easy access.
-
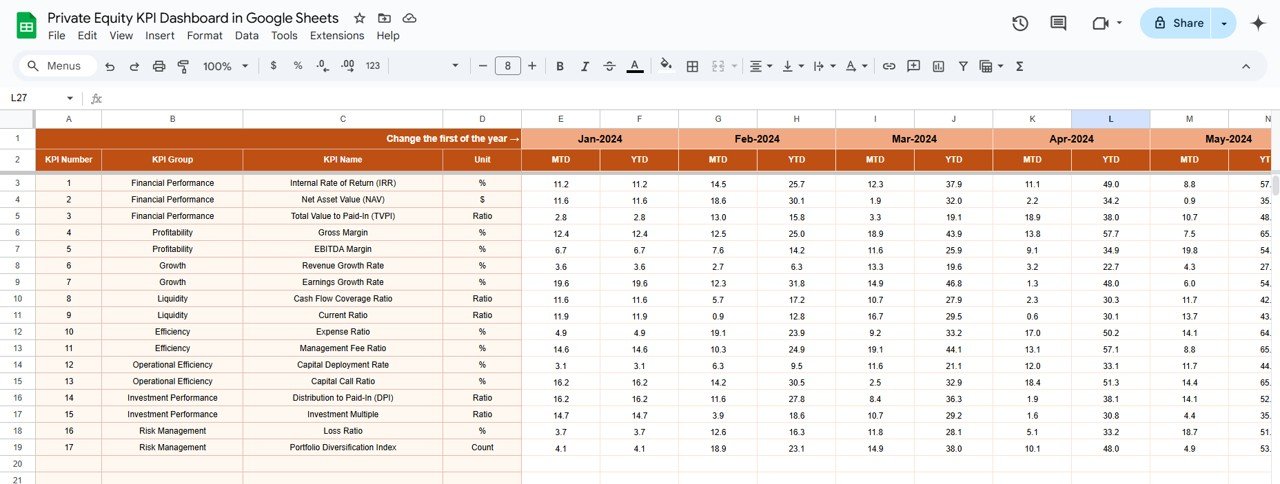
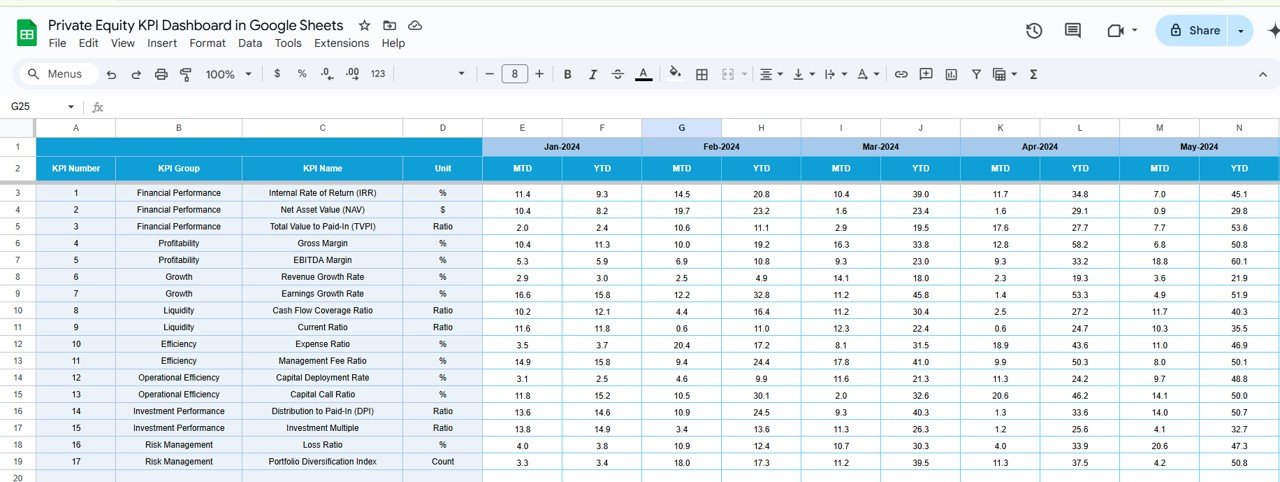
Enter Your Data: Input your investment data, including key financial metrics, investment details, and exit information.
-
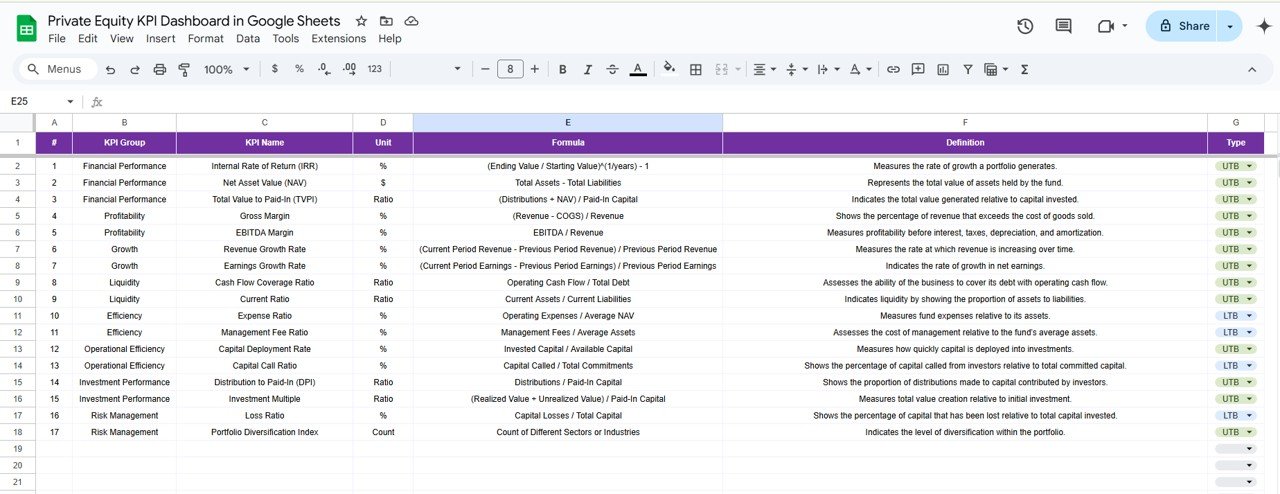
Customize the KPIs: Tailor the dashboard by adding or modifying KPIs to meet the specific goals and objectives of your investment strategy.
-
Analyze Trends: Use built-in charts and graphs to analyze investment performance and track trends over time.
-
Generate Reports: Share customized reports with stakeholders, highlighting key insights and KPIs for decision-making.
By using the Private Equity KPI Dashboard in Google Sheets, you can gain valuable insights into your investments, streamline performance tracking, and make better decisions to maximize returns on your portfolio.
Click here to read the Detailed blog post
Private Equity KPI Dashboard in Google Sheets
Visit our YouTube channel to learn step-by-step video tutorials
YouTube.com/@NeotechNavigators


Reviews
There are no reviews yet.