

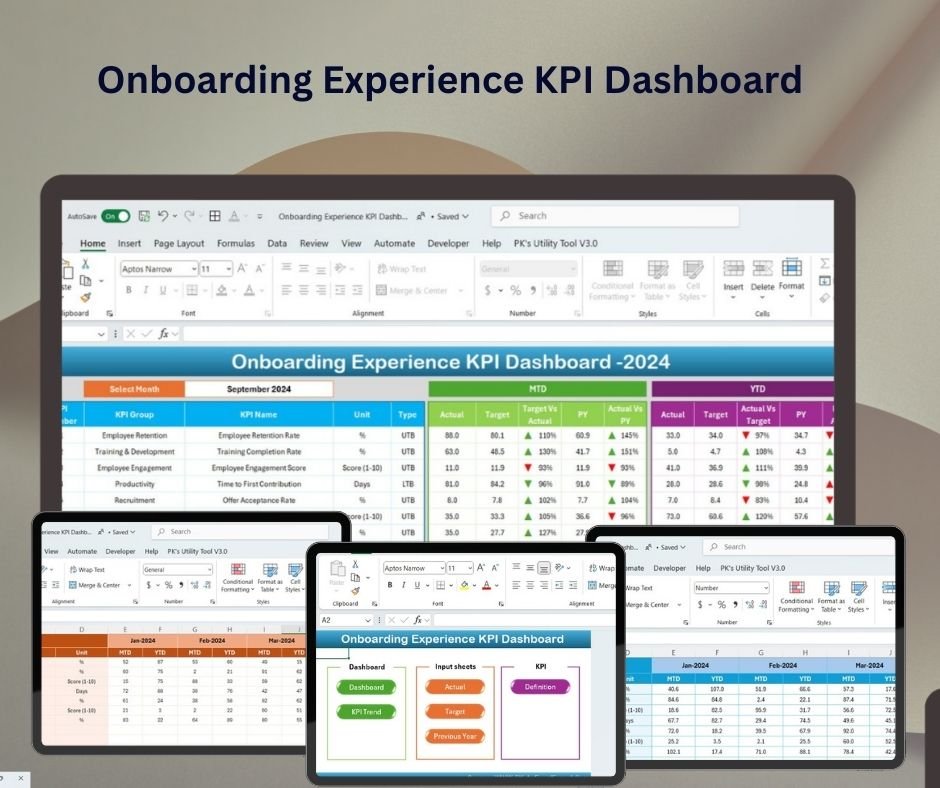
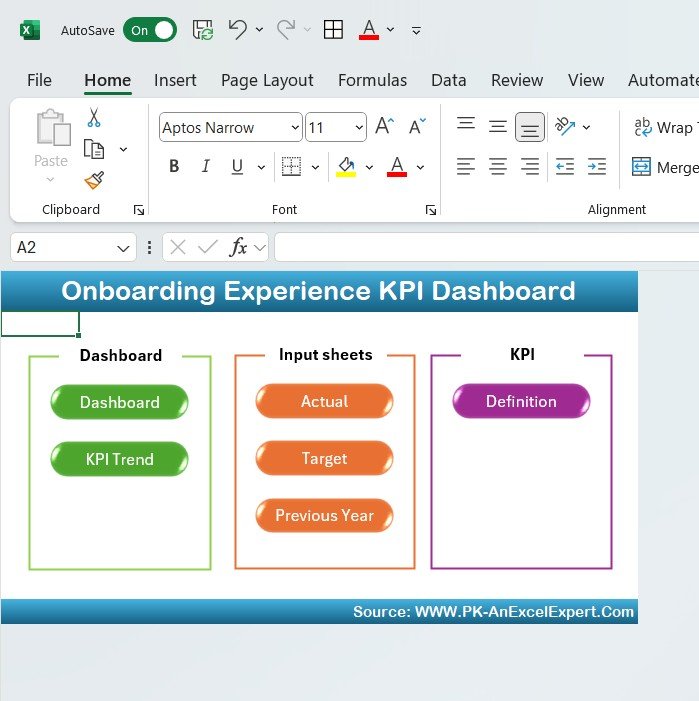
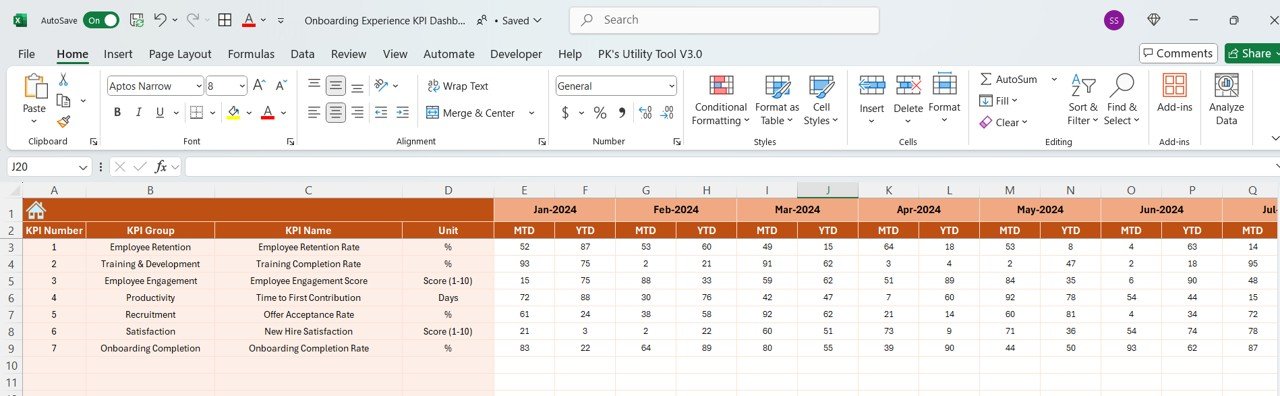
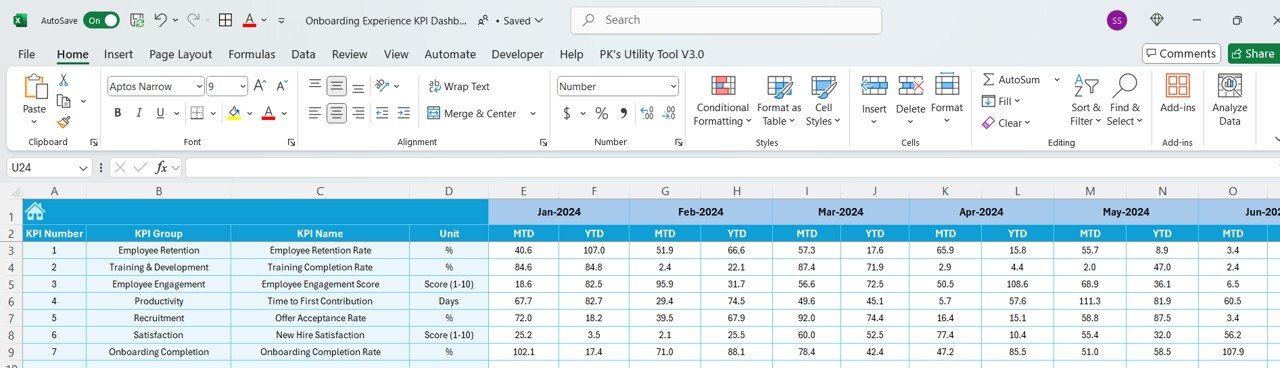
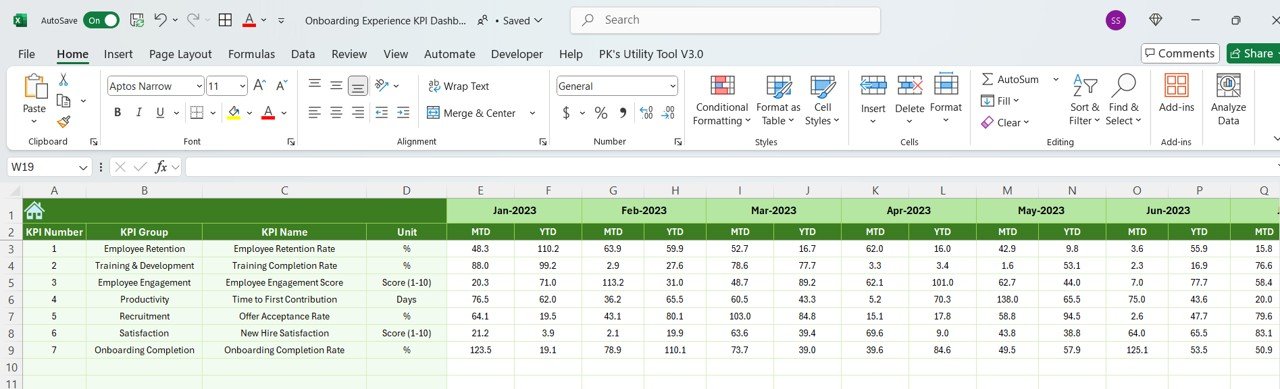
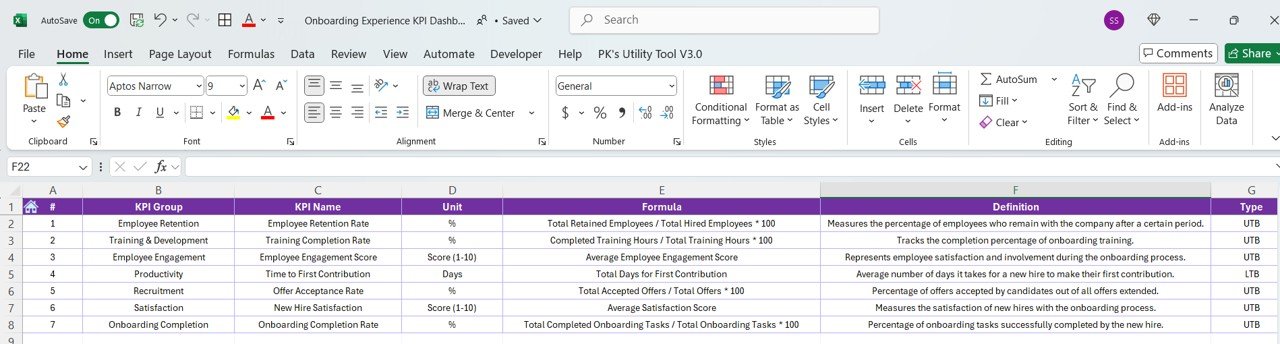
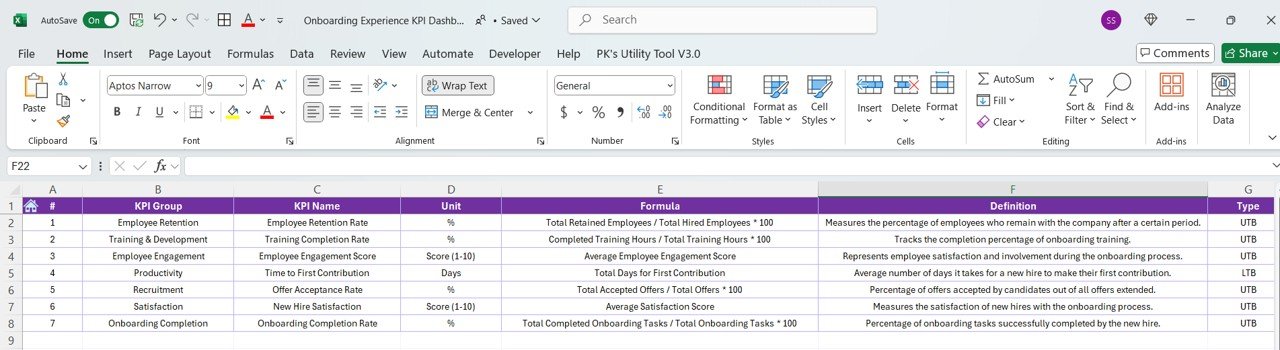

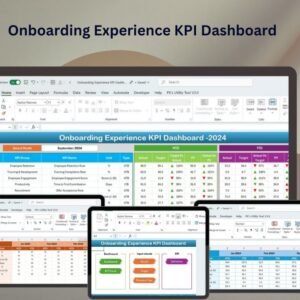
The Onboarding Experience KPI Dashboard in Excel is a ready-made, interactive dashboard that helps HR teams and business leaders track and analyze the key performance indicators (KPIs) behind employee onboarding. It brings training completion, engagement, employee satisfaction, time-to-productivity and task completion into one visual view. The result is a smoother, more effective transition for every new hire.
Instead of chasing onboarding updates across emails and separate files, you see the whole process in one place. The dashboard shows where new hire onboarding is on track, where bottlenecks appear and what to improve next.
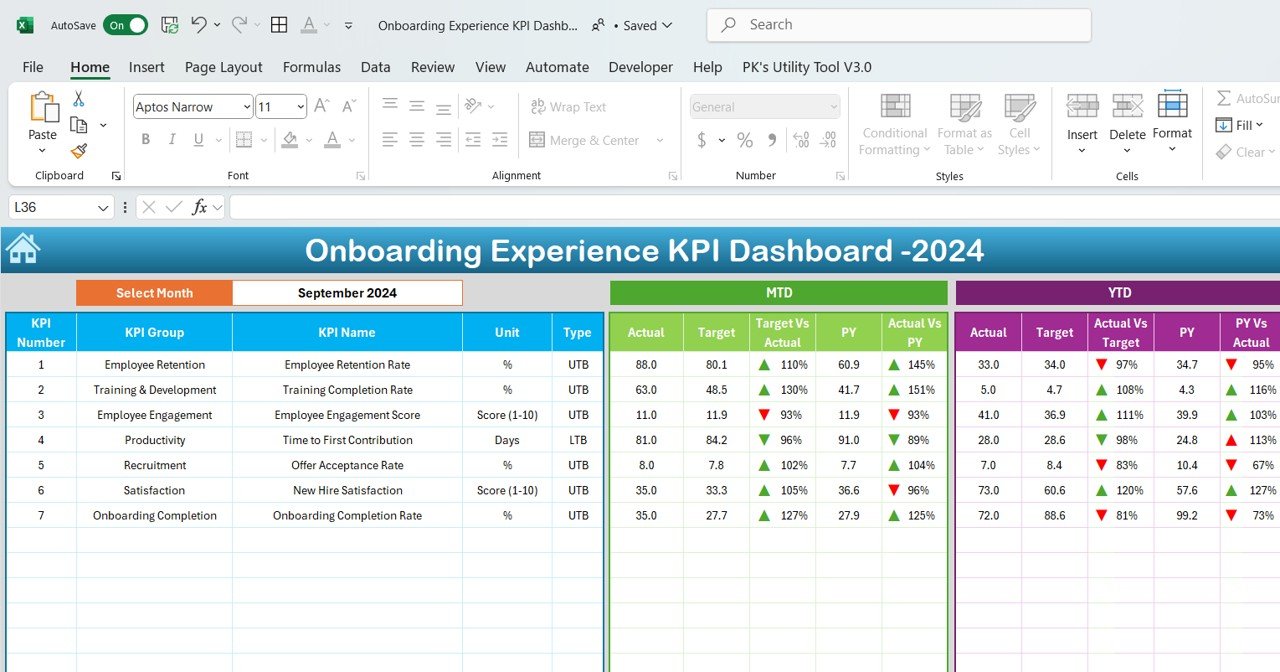
Key Features of the Onboarding Experience KPI Dashboard
- KPI tracking: Monitor important employee onboarding KPIs such as training completion, engagement scores, completion rates and time-to-productivity.
- Customizable metrics: Adjust the dashboard to track the onboarding KPIs that matter to your organization.
- Time-based analysis: Follow onboarding progress over time, from day one to full integration.
- Visual data representation: Dynamic charts and graphs present each KPI in an easy-to-read format.
- Employee satisfaction scores: Track how satisfied new hires feel at each stage of the journey, so you can spot areas for improvement.
- Onboarding task completion tracking: Keep an eye on essential tasks like document submission, training and system access, so onboarding stays on schedule.
Why HR Teams Choose This Dashboard
- Streamlines onboarding: You get a complete overview of the entire onboarding process in one place.
- Actionable insights: You can find bottlenecks, gaps and chances to improve the new hire experience.
- Up-to-date tracking: As you enter data, the dashboard shows whether onboarding activities are moving smoothly.
- Customizable for your needs: Tailor the KPIs to your own organizational goals.
- Improves employee experience: Support new hires from day one and make onboarding as smooth as possible.
What’s Inside the Onboarding Experience KPI Dashboard
| Component | What it does |
|---|---|
| Onboarding KPIs | Tracks and visualizes metrics like training completion, satisfaction and engagement. |
| Customizable inputs | Lets you adjust KPIs to reflect your organization’s unique needs and goals. |
| Trend analysis | Monitors onboarding progress over time so you can assess improvements or challenges. |
| Employee satisfaction tracking | Evaluates new hire satisfaction at different stages of the onboarding process. |
| Task completion monitoring | Shows whether onboarding tasks are done on time, using an easy-to-read progress tracker. |
Who Is It For?
This onboarding dashboard suits anyone who runs, oversees or improves new hire onboarding:
- HR Managers who need a clear view of onboarding performance
- Onboarding Coordinators who manage day-to-day onboarding tasks
- Business Leaders who want insight into how new employees settle in
- Team Managers who welcome and support new team members
- Employee Experience Professionals who measure and improve satisfaction
- Talent Acquisition Teams who want to see how hires progress after joining
How to Use the Onboarding Experience KPI Dashboard
- Download the template: You get immediate access to the pre-built onboarding dashboard in Excel.
- Customize your metrics: Adjust the KPIs to match your organization’s needs.
- Track progress: Enter your data to monitor progress and performance metrics.
- Analyze results: Use the charts and graphs to judge how well your onboarding program works.
- Make improvements: Use the dashboard insights to find and fix weak points in your onboarding process.
By tracking these metrics, you can improve employee engagement, retention and overall onboarding success.
Learn More
Click here to read the detailed blog post.
Visit our YouTube channel for step-by-step video tutorials.
Frequently Asked Questions
What is the Onboarding Experience KPI Dashboard in Excel?
It is a ready-made Excel dashboard for HR teams and business leaders. It tracks and analyzes employee onboarding KPIs such as training completion, engagement scores, employee satisfaction, completion rates and time-to-productivity.
Which onboarding KPIs can I track?
The dashboard covers training completion, engagement scores, completion rates, employee satisfaction and time-to-productivity. It also tracks onboarding tasks such as document submission, training and system access. You can customize the metrics to fit your organization.
Can I customize the dashboard for my organization?
Yes. The dashboard has customizable inputs and metrics, so you can track the onboarding KPIs most relevant to your goals.
Does it show onboarding trends over time?
Yes. Time-based and trend analysis let you follow new hire onboarding progress from day one to full integration and see improvements or challenges.
How does it help improve the new hire experience?
The dashboard tracks employee satisfaction at different stages and monitors task completion. This helps you spot bottlenecks early and make sure new hires are supported from day one.
Where can I learn how to use it?
You can read the detailed blog post linked above. Step-by-step video tutorials are on the PK: An Excel Expert YouTube channel.
Last updated: October 2026
Compatibility and Requirements
- Works in Microsoft Excel desktop (Excel 2016 or later, or Microsoft 365).
- The dashboard shows each onboarding KPI as a chart. Microsoft’s guide to creating a chart from start to finish explains how to change chart types and colors.
Related Onboarding Templates
- Onboarding Experience KPI Dashboard in Google Sheets: the same KPIs for teams that work in Google Sheets
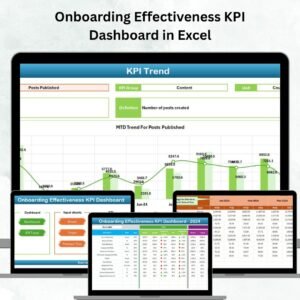
- Onboarding Effectiveness KPI Dashboard in Excel: measures how well your onboarding program works
- Employee Onboarding Tracker in Excel: track each new hire’s onboarding tasks
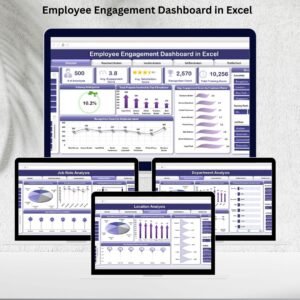
- Employee Engagement Dashboard in Excel: follow engagement after onboarding ends
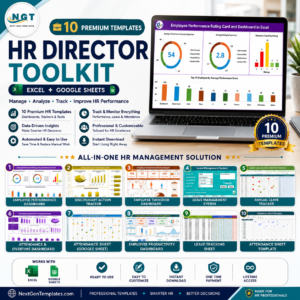
- HR Director Toolkit: 10 Excel and Google Sheets HR templates in one bundle
Browse all Excel KPI dashboards or the Excel HR and payroll templates.



















Reviews
There are no reviews yet.