


Managing office security is more than just logging incidents—it’s about response time, severity tracking, and identifying recurring risks. The Office Security Incident Dashboard in Excel is a ready-to-use professional tool designed to help you track, analyze, and improve how your organization manages security-related events.
Whether you’re a security officer, office administrator, or facilities manager, this dashboard gives you the tools you need to monitor incident performance, identify bottlenecks, and enhance your incident response process—with no coding or software installation required.

✨ Key Features of the Office Security Incident Dashboard
📋 Overview Sheet Tab – Instant Incident Intelligence
-
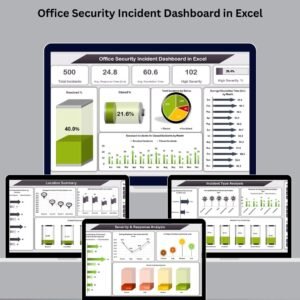
🛑 Total Incidents
-
⏱️ Avg. Response Time (hrs)
-
🔧 Avg. Resolution Time (hrs)
-
⚠️ High Severity Incidents
-
📊 High Severity %
📊 Visual Charts
-
✅ Resolved % and Closed %
-
🆚 Resolved vs Closed Incidents (Monthly)
-
📅 Avg. Resolution Time by Month
-
🧯 Incident Type Analysis (e.g., Theft, Vandalism)
Provides a quick snapshot of your organization’s security handling efficiency.
📍 Location Summary Sheet Tab – Analyze by Area
-
🏢 Closed vs Resolved by Location
-
🕒 Average Resolution Time per Location
-
⚠️ High Severity Incidents by Location
-
🔐 Closed % by Location
Helps uncover vulnerable office zones and optimize site-specific safety protocols.
🚨 Severity & Response Analysis Sheet – Critical Risk Monitoring
-
🆚 Closed vs Resolved by Severity
-
⏱️ Avg. Response Time by Severity Level
-
🔄 In-Progress Incidents by Severity
-
📊 Closed % by Severity
Pinpoint critical gaps in high-severity incident handling with rich analytics.
👤 Reporter & Assignee Analysis Sheet – Accountability & Team Performance
-
📌 High Severity by Reporter
-
🔄 In-Progress vs Resolved by Reporter
-
✅ Resolved % by Reporter
-
⏱️ Avg. Resolution Time by Reporter
Get visibility into individual performance metrics and encourage team accountability.
🧾 Data Sheet Tab – Centralized Incident Log
-
Incident ID
-
Type (Theft, Vandalism, etc.)
-
Date of Incident
-
Reported By / Assigned To
-
Severity (Low, Medium, High)
-
Status (Open, Resolved, Closed)
-
Response Time (hrs)
-
Resolution Time (hrs)
-
Remarks
All inputs flow into real-time KPI cards and charts—no manual calculations needed!
🚀 Benefits of Using This Dashboard
-
✅ Track every incident in a clean, structured format
-
📊 Monitor KPIs like response time, closure rates, and severity distributions
-
📍 Analyze incidents by location to identify vulnerable zones
-
👥 Evaluate staff performance for accountability
-
🧠 Make data-driven decisions to improve your incident response strategy
-
🎯 Customize it as per your needs—add your own incident types, fields, or charts
🛠️ How to Use the Office Security Dashboard
-
Enter data into the Data Sheet tab after every incident
-
Review charts and KPIs on Overview, Location, Severity, and Reporter tabs
-
Take corrective actions by identifying recurring issues or high-severity delays
-
Share with team for enhanced coordination
-
Customize sheets and charts if needed
👨💼 Who Should Use This Dashboard?
-
🏢 Office & Facility Managers
-
👮 Security Supervisors
-
🧑💻 HR & Admin Departments
-
🔍 Risk Assessment Teams
-
🛠️ Health & Safety Officers
-
🧾 Compliance & Internal Audit Teams
🔗 Click here to read the Detailed blog post
🎥 Visit our YouTube channel to learn step-by-step video tutorials


Reviews
There are no reviews yet.