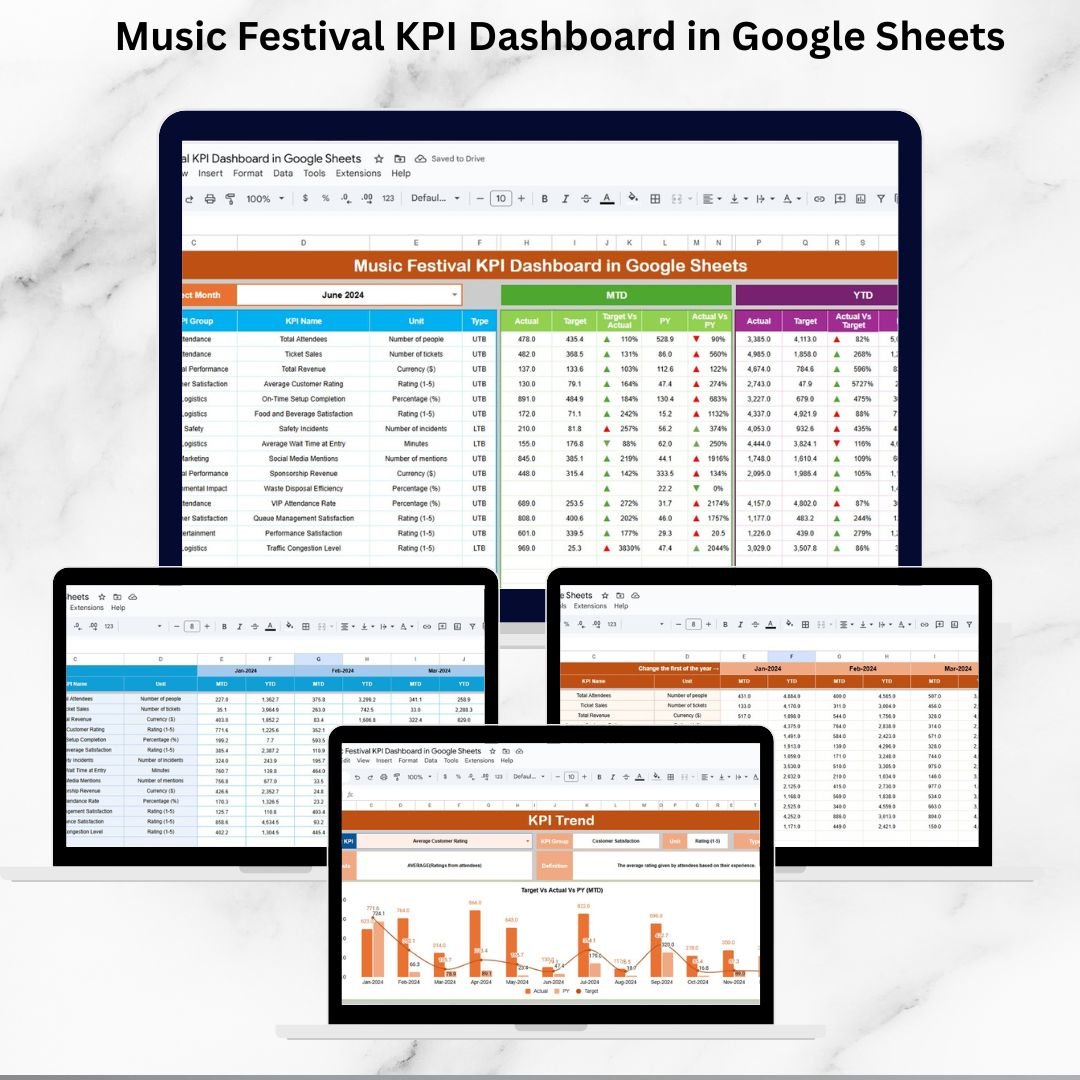
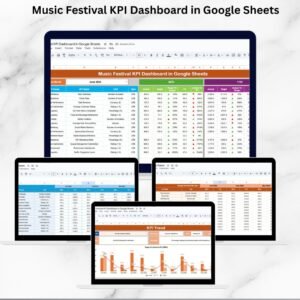
Running a music festival is no easy task — from ticket sales and artist performance to audience engagement and operational logistics, there are countless moving parts to manage. The Music Festival KPI Dashboard in Google Sheets is a ready-to-use solution that brings all these elements together in one interactive and visual platform. 🎶📊Music Festival KPI Dashboard in Google Sheets
With this dashboard, festival organizers can monitor key performance indicators (KPIs) in real-time, track progress against targets, and compare results with previous years. It is designed to simplify decision-making, highlight opportunities, and ensure each event is both profitable and memorable.Music Festival KPI Dashboard in Google Sheets
🔑 Key Features of Music Festival KPI Dashboard in Google Sheets
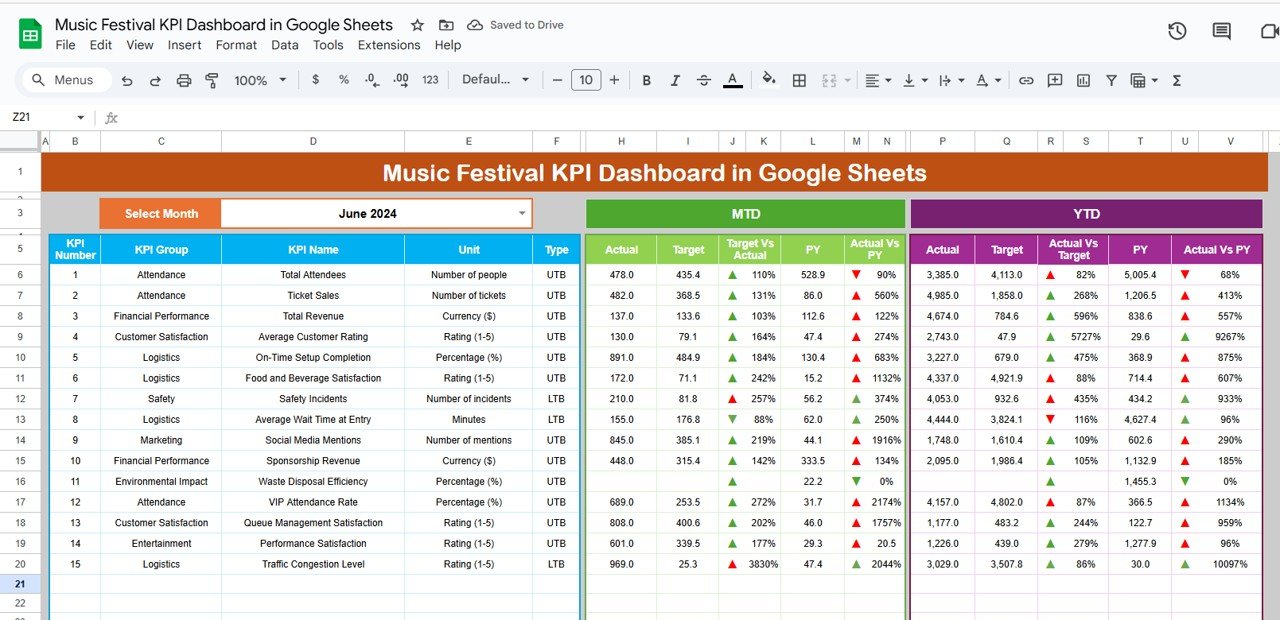
📋 Dashboard Sheet
-
High-level festival overview with Month Selector (D3).
-
MTD (Month-to-Date) and YTD (Year-to-Date) metrics for Actual vs Target vs Previous Year.
-
Conditional formatting arrows for quick performance insights.
-
Instantly see how ticket sales, revenue, and attendance are trending.
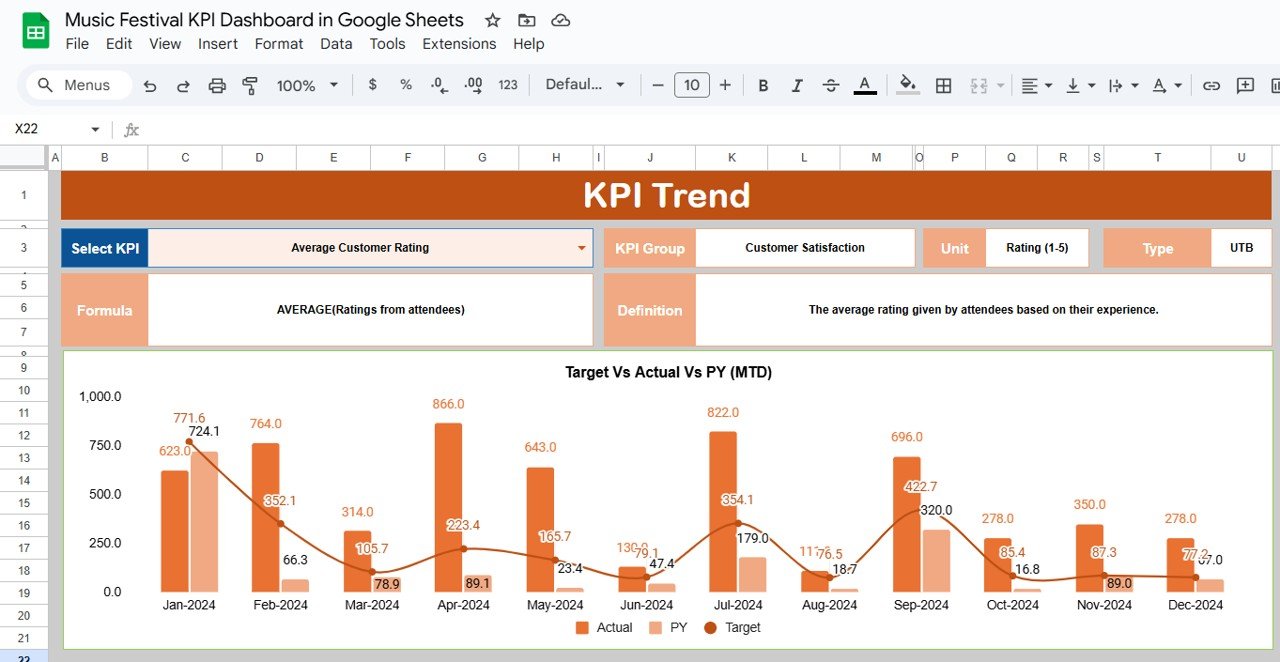
📈 KPI Trend Sheet
-
Choose a KPI from a dropdown (C3) to analyze performance over time.
-
Displays KPI Group, Unit, Type (UTB/LTB), Formula, and Definition.
-
Charts visualize improvements, bottlenecks, or declines across months.
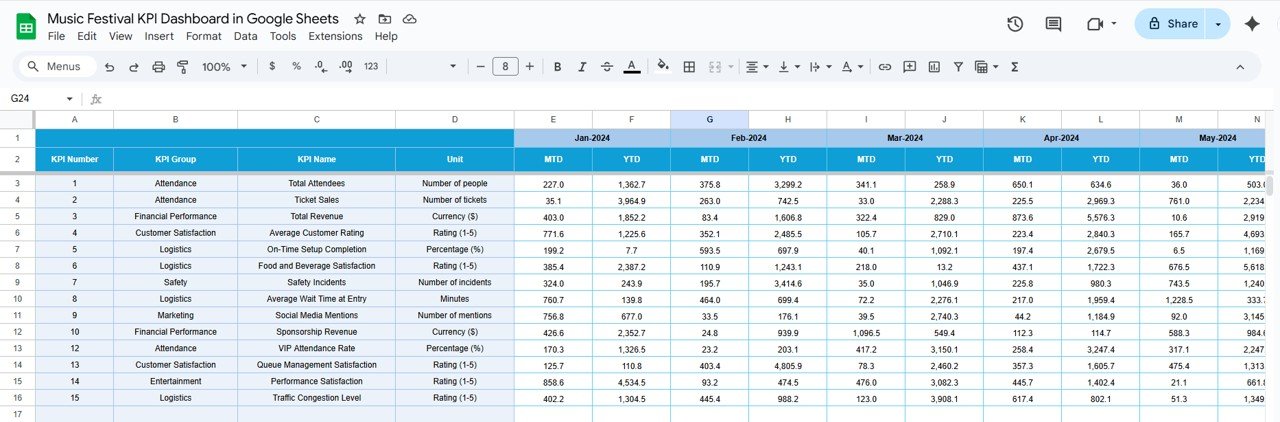
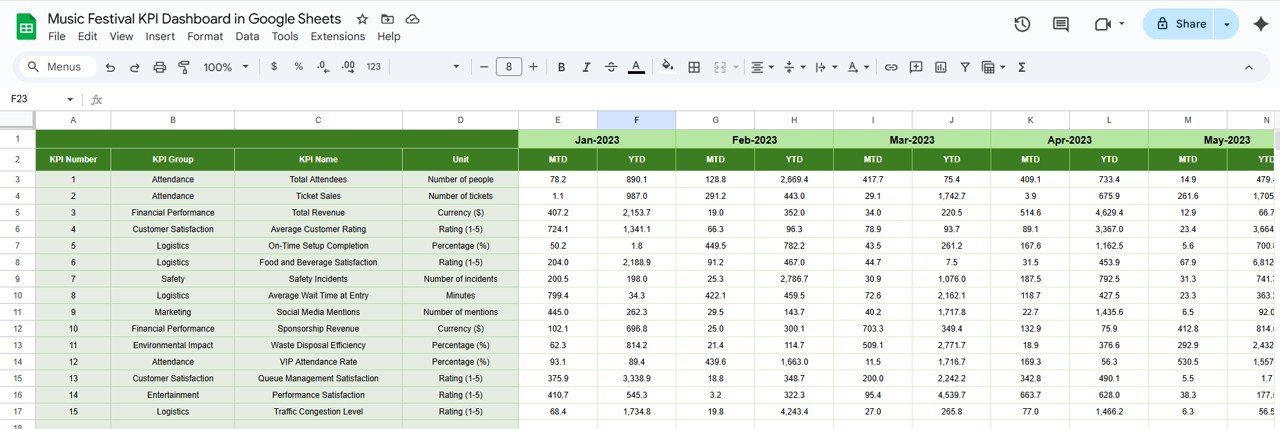
🧾 Actual Numbers Sheet
-
Enter actual KPI values for MTD and YTD.
-
Change the first month of the year (E1) to auto-adjust calculations.
-
Keeps your dashboard always up-to-date.
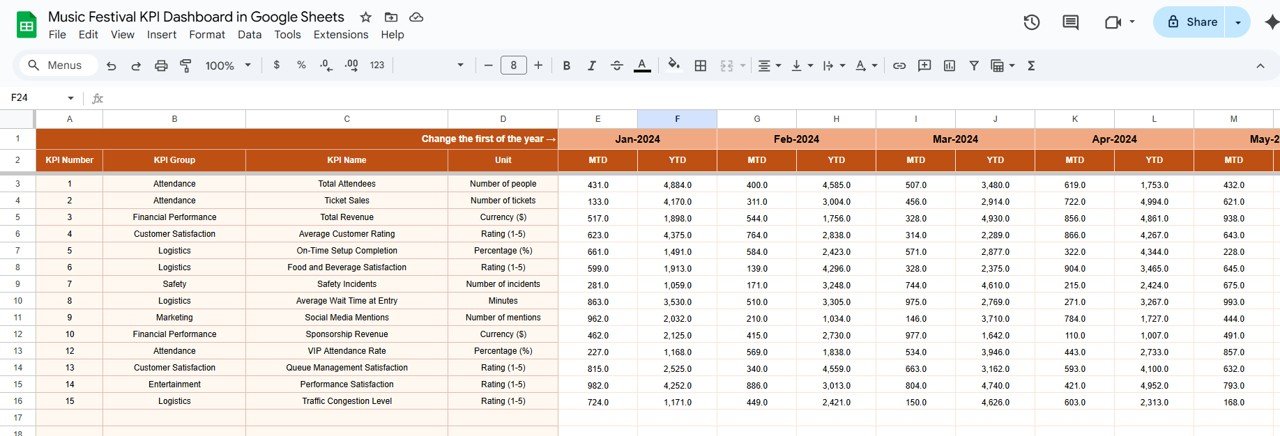
🎯 Target Sheet
-
Define monthly and yearly targets for KPIs.
-
Compare actual numbers against planned goals.
-
Perfect for measuring success and spotting gaps early.
📊 Previous Year Numbers Sheet
-
Input last year’s performance data.
-
Enables YOY (Year-over-Year) analysis to track growth.
-
Provides historical context for seasonality and trends.
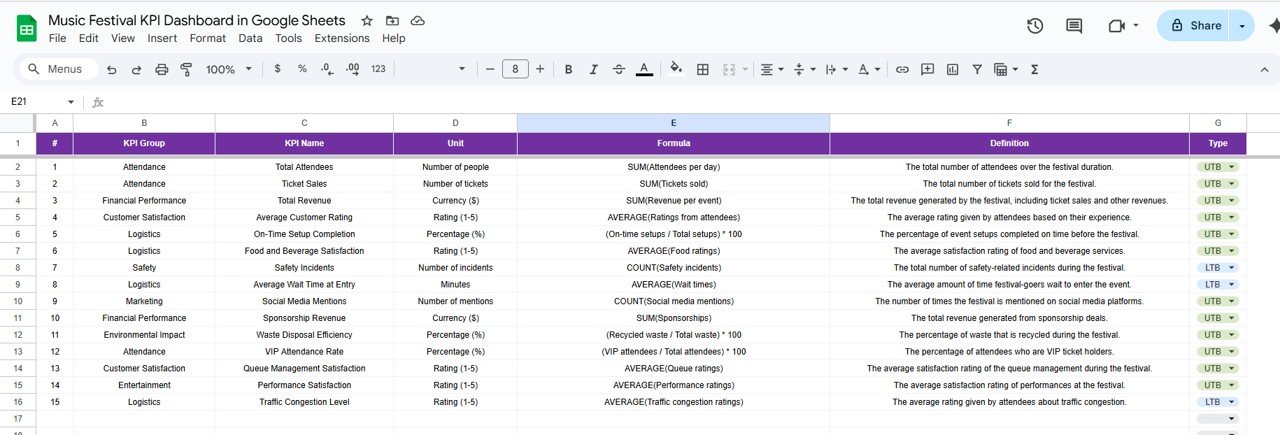
📘 KPI Definition Sheet
-
Includes KPI name, group, unit, formula, definition, and type.
-
Ensures all organizers, partners, and teams work with consistent metrics.
📦 What’s Inside the Dashboard?
✅ 6 Tabs – Dashboard, KPI Trend, Actual Numbers, Targets, Previous Year, KPI Definitions
✅ Pre-Configured KPIs – Ticket Sales, Attendance, Artist Performance, Revenue per Show, Satisfaction, Operational Costs, Marketing Effectiveness
✅ Visual Insights – Charts, arrows, and indicators for fast interpretation
✅ Sample Data – Preloaded for easy setup and understanding
✅ Customizable Layout – Add or remove KPIs to fit your festival needs
🎯 Who Can Benefit from This Dashboard?
🎶 Festival Organizers – Gain full control of performance tracking.
💼 Event Managers – Optimize scheduling, resources, and artist line-ups.
📊 Finance Teams – Monitor revenue, costs, and profitability.
📣 Marketing Teams – Measure campaign conversion and audience reach.
🌍 Large-Scale Festival Chains – Compare performance across multiple locations or stages.
🧠 How to Use the Music Festival KPI Dashboard
-
Input ticket sales, attendance, and engagement metrics into the Actual Numbers Tab.
-
Define goals in the Target Tab for both monthly and annual performance.
-
Enter historical data in the Previous Year Tab to track growth.
-
Review high-level insights on the Dashboard Tab.
-
Use the KPI Trend Tab for deeper analysis of individual KPIs.
-
Refer to the KPI Definition Tab for clarity on formulas and metrics.
🚀 Advantages of Using This Dashboard
-
Centralized Data – All festival metrics in one place.
-
Real-Time Updates – See instant results with every data entry.
-
Trend Analysis – Compare MTD, YTD, and previous year performance.
-
Target Tracking – Stay aligned with revenue and engagement goals.
-
Customizable – Adjust KPIs, charts, and definitions easily.
-
Decision Support – Back up every move with data-driven insights.
🔗 Click here to read the Detailed blog post
Watch the step-by-step video Demo:


Reviews
There are no reviews yet.