Managing a modern shopping mall goes far beyond leasing retail spaces and collecting rent. Today’s mall managers must continuously track footfall, tenant performance, operational efficiency, revenue trends, and customer experience. However, when this information remains scattered across Excel files, emails, and manual reports, decision-making becomes slow, inconsistent, and unreliable.
That is exactly why the Mall Management KPI Dashboard in Power BI becomes a must-have analytical solution.
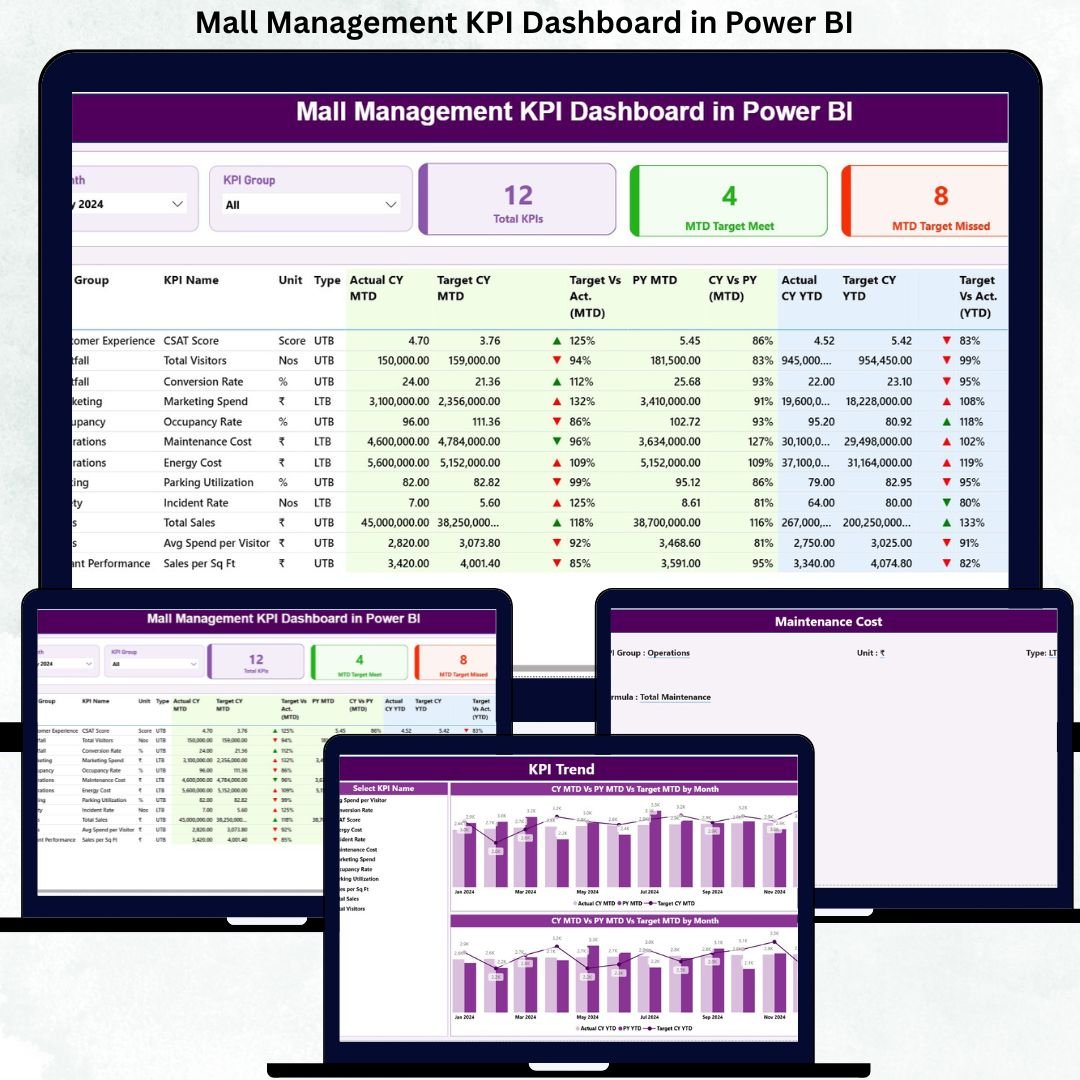
This ready-to-use Power BI dashboard provides a centralized, interactive, and visual platform to track all critical mall KPIs in one place. By combining Excel-based data input with Power BI’s powerful visualization, the dashboard helps mall managers, leasing teams, facility managers, and leadership teams make faster, smarter, and data-driven decisions.
What Is a Mall Management KPI Dashboard in Power BI?
A Mall Management KPI Dashboard in Power BI is a professional analytics dashboard designed to monitor and analyze key performance indicators related to mall operations.
Instead of relying on static reports, this dashboard displays:
✔ Month-to-Date (MTD) performance
✔ Year-to-Date (YTD) performance
✔ Actual vs Target comparison
✔ Current Year vs Previous Year (CY vs PY) analysis
✔ KPI-wise trend analysis
Because the dashboard runs in Power BI and uses Excel as the data source, it remains flexible, scalable, and easy to maintain—even for non-technical users.
Why Do Mall Managers Need This Dashboard?
Shopping malls involve multiple departments working together—leasing, operations, facilities, finance, and customer experience. Without a centralized KPI view, performance gaps often go unnoticed.
The Mall Management KPI Dashboard in Power BI helps because it:
✔ Shows performance status instantly
✔ Highlights underperforming KPIs visually
✔ Tracks targets clearly using icons and comparisons
✔ Supports faster management reviews
✔ Eliminates manual reporting effort
As a result, mall teams spend less time compiling reports and more time improving mall performance.
🧩 Key Features of Mall Management KPI Dashboard in Power BI
📊 Centralized KPI Performance Tracking
Track all mall KPIs in a single dashboard with structured tables and visuals.
📅 MTD & YTD Analysis
Monitor short-term execution and long-term progress simultaneously.
🎯 Target vs Actual Comparison
Instantly identify KPIs that meet or miss targets using visual indicators.
🔁 CY vs PY Performance Comparison
Understand growth, decline, and seasonal patterns clearly.
📈 Trend Analysis
Analyze KPI behavior over time using interactive trend charts.
🧠 Excel + Power BI Combination
Easy Excel data entry with powerful Power BI visuals.
📦 What’s Inside the Mall Management KPI Dashboard?
The dashboard contains three professionally designed Power BI pages.
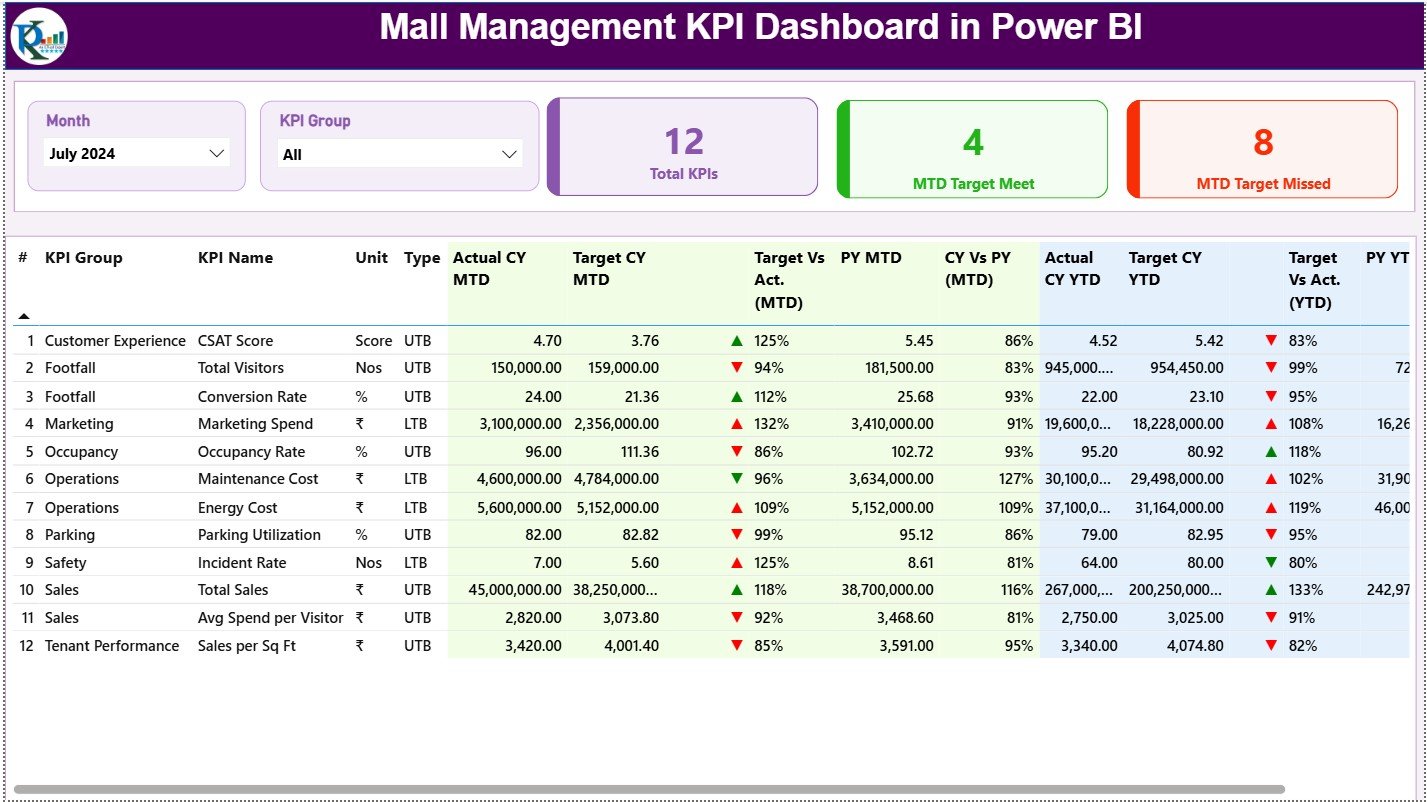
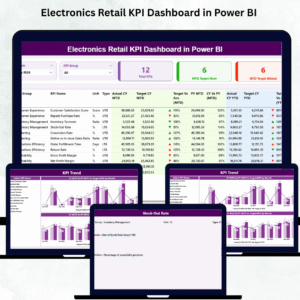
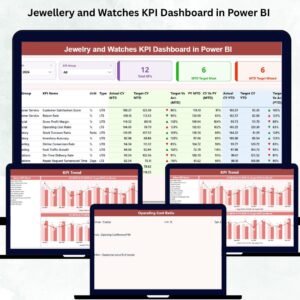
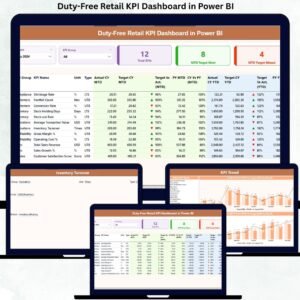
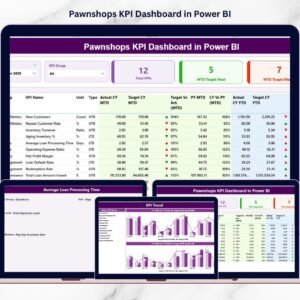
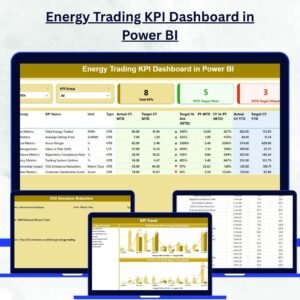
🏠 1. Summary Page – Complete Mall Performance Overview
-
Month slicer
-
KPI Group slicer
-
KPI Cards:
-
Total KPIs Count
-
MTD Target Met Count
-
MTD Target Missed Count
-
-
Detailed KPI Table with:
-
KPI Number, Group, Name, Unit
-
KPI Type (UTB / LTB)
-
MTD Actual, Target, PY, Variance
-
YTD Actual, Target, PY, Variance
-
Visual ▲ / ▼ indicators
-
This page acts as the main control center for mall performance.
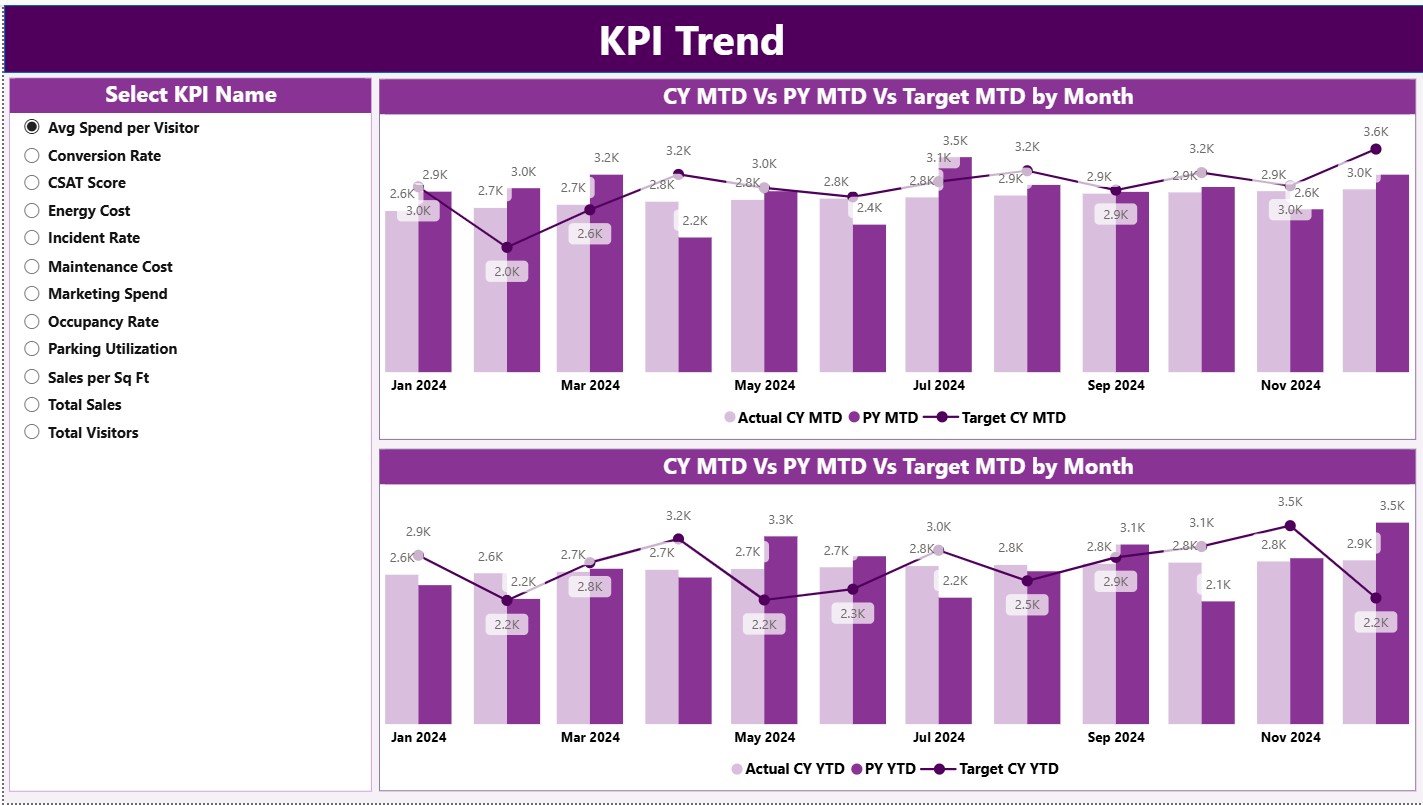
📈 2. KPI Trend Page – Performance Over Time
-
KPI Name slicer
-
MTD trend combo chart (Actual CY, PY, Target)
-
YTD trend combo chart (Actual CY, PY, Target)
This page helps identify seasonality, risks, and improvement patterns early.
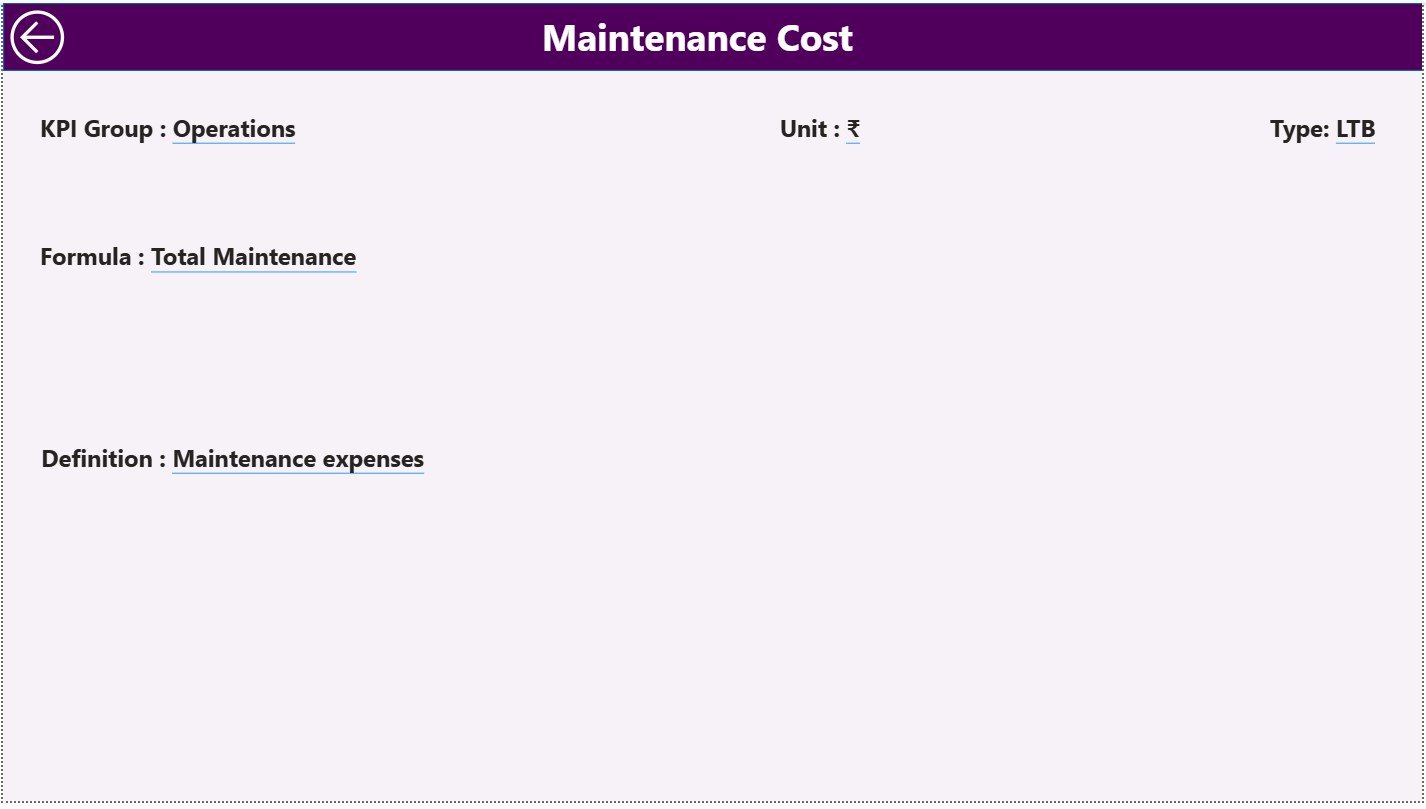
📘 3. KPI Definition Page – KPI Transparency
-
KPI Formula
-
KPI Definition
-
KPI Type (UTB / LTB)
-
Measurement Unit
This hidden drill-through page ensures clarity and standardization across teams.
⚙️ How to Use the Mall Management KPI Dashboard
1️⃣ Update actual KPI values in Excel
2️⃣ Update target KPI values in Excel
3️⃣ Refresh Power BI
4️⃣ Use slicers to filter Month or KPI Group
5️⃣ Analyze MTD, YTD, and trend insights
6️⃣ Drill through to KPI definitions if needed
No advanced Power BI skills required.
👥 Who Can Benefit from This Dashboard?
✔ Mall Managers
✔ Leasing & Tenant Management Teams
✔ Facility & Operations Teams
✔ Finance & Revenue Teams
✔ Business Analysts
✔ Mall Owners & Leadership
This dashboard works equally well for small malls and large commercial complexes.
🌟 Advantages of Mall Management KPI Dashboard in Power BI
✔ Centralized KPI monitoring
✔ Faster and smarter decision-making
✔ Clear target tracking
✔ Historical performance comparison
✔ User-friendly interface
✔ Scalable KPI structure
✔ Reduced reporting time
Conclusion
The Mall Management KPI Dashboard in Power BI transforms scattered operational data into clear, actionable insights. By combining structured Excel inputs with interactive Power BI visuals, it gives mall managers visibility, control, and confidence in every decision.
If you want to improve mall efficiency, tenant performance, and overall profitability, this dashboard becomes an essential management tool.


Reviews
There are no reviews yet.