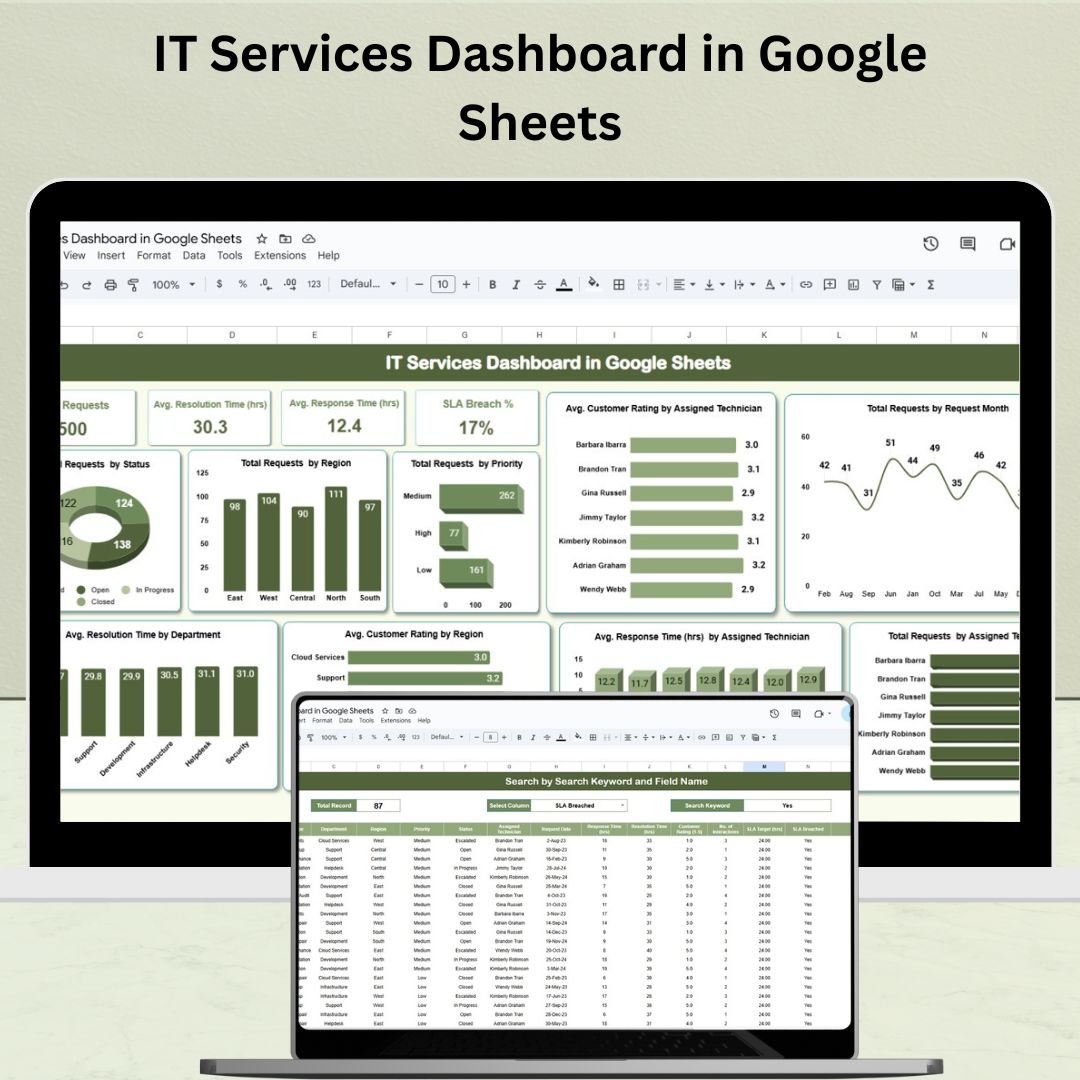
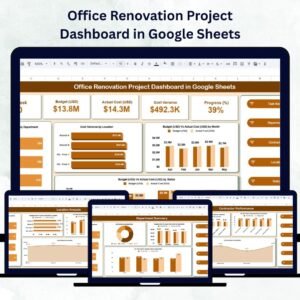
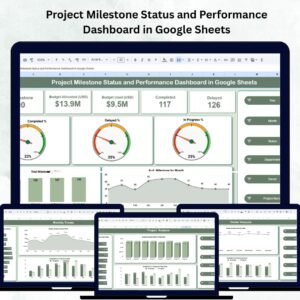
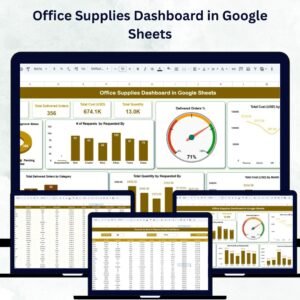
📊 Transform your IT service management with this powerful, ready-to-use Google Sheets Dashboard—track requests, SLAs, technician performance, and more in real time!IT Services Dashboard in Google Sheets
Keeping your IT services efficient, transparent, and high-performing isn’t easy. From tracking tickets and resolution times to managing SLA breaches and customer satisfaction—everything must be monitored constantly. That’s where the IT Services Dashboard in Google Sheets steps in. It’s your all-in-one visual dashboard to help IT departments monitor KPIs, track service metrics, and analyze team performance like a pro! 🚀
Built for both day-to-day support teams and IT service leaders, this dashboard gives you a crystal-clear overview of service quality, SLA performance, and team efficiency—all in a beautiful, interactive format.
✨ Key Features of IT Services Dashboard
📌 Dashboard Sheet: Visual, Insightful, and Actionable
Your command center for all IT performance metrics.
-
Cards include:
-
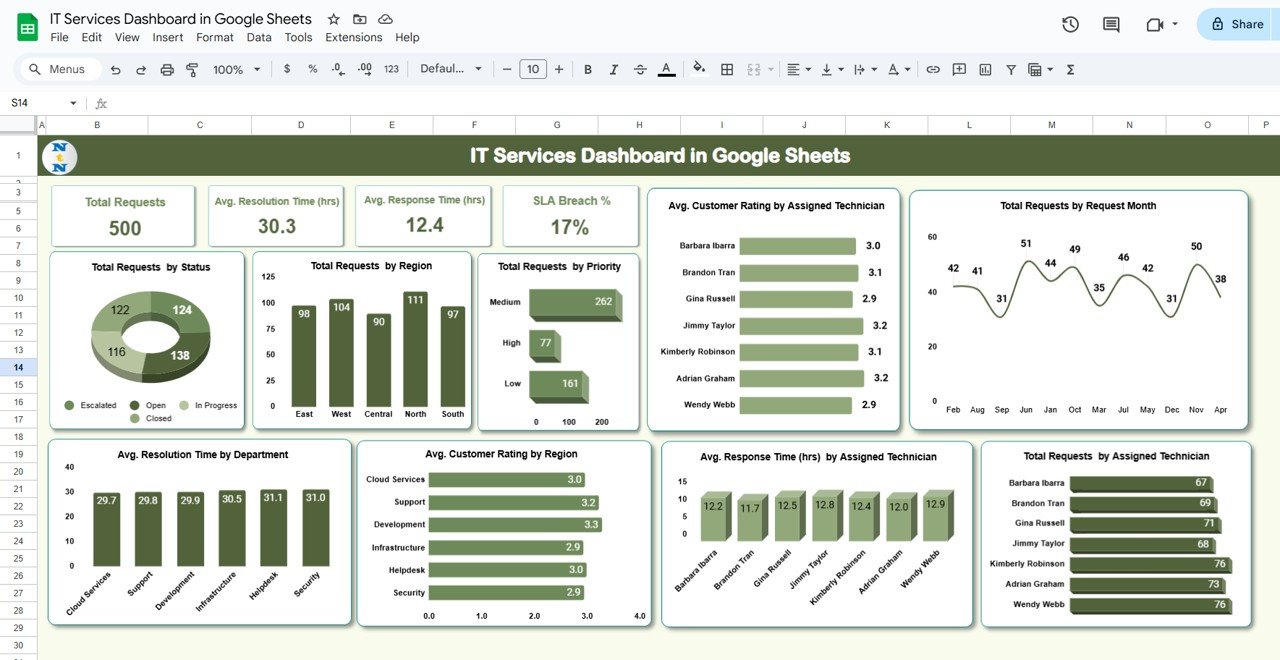
✅ Total Requests
-
⏱ Avg. Resolution Time (hrs)
-
⚡ Avg. Response Time (hrs)
-
❌ SLA Breach Count
-
📉 SLA Breach %
-
-
Charts provide breakdowns of:
-
Requests by Status, Priority & Region
-
Avg. Ratings by Technician & Region
-
SLA breaches & resolution trends
-
Technician workload & performance
-
Everything updates automatically—no formulas to write! 💡
📦 What’s Inside the IT Services Dashboard
-
Dashboard Sheet Tab – 10+ dynamic charts and KPI cards
-
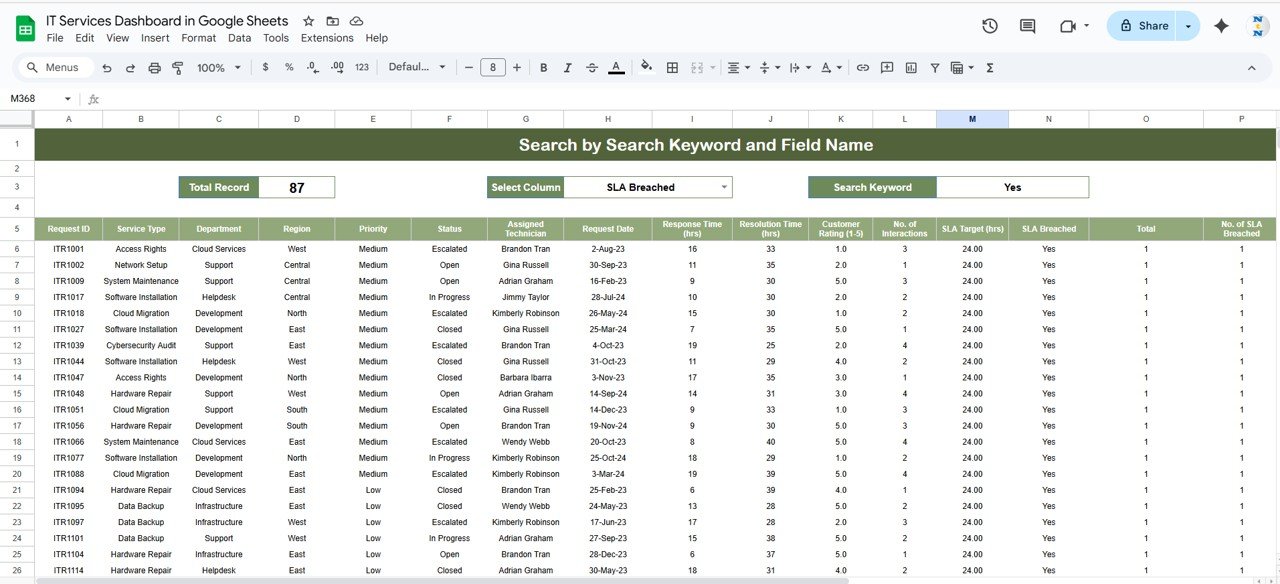
Search Sheet Tab – 🔍 Quickly filter and search by status, priority, tech name, etc.
-
Data Sheet Tab – Full input table capturing all fields: ID, SLA data, cost, rating, etc.
You get a complete system to track every service ticket, from submission to resolution.
🛠 How to Use the IT Services Dashboard
-
Enter Data: Log service requests into the Data Sheet. Include request details, SLAs, and technician info.
-
View Dashboards: Head to the Dashboard Sheet to view cards and charts updating in real time.
-
Use Filters: Use the Search Sheet to drill down into specific queries.
-
Analyze Trends: Use charts to monitor breach percentages, average times, and performance trends.
-
Share with Team: Collaborate easily by sharing the file via Google Sheets.
This system requires zero coding—just plug in your numbers and analyze! ✅
👥 Who Can Benefit from This IT Services Dashboard
-
💼 IT Managers – Monitor SLA performance and service efficiency.
-
🧑💻 Helpdesk Teams – Keep track of requests, priority tickets, and performance ratings.
-
🧠 Service Leaders – Use data to plan improvements and optimize technician allocation.
-
🏢 Managed Service Providers (MSPs) – Analyze client support metrics for quality control.
-
📊 Data Analysts – Visualize IT operations with actionable KPIs.
If your job involves monitoring IT service quality, this tool is built for you!
👉 Click here to read the Detailed blog post
🎥 Visit our YouTube channel to learn step-by-step video tutorials


Reviews
There are no reviews yet.