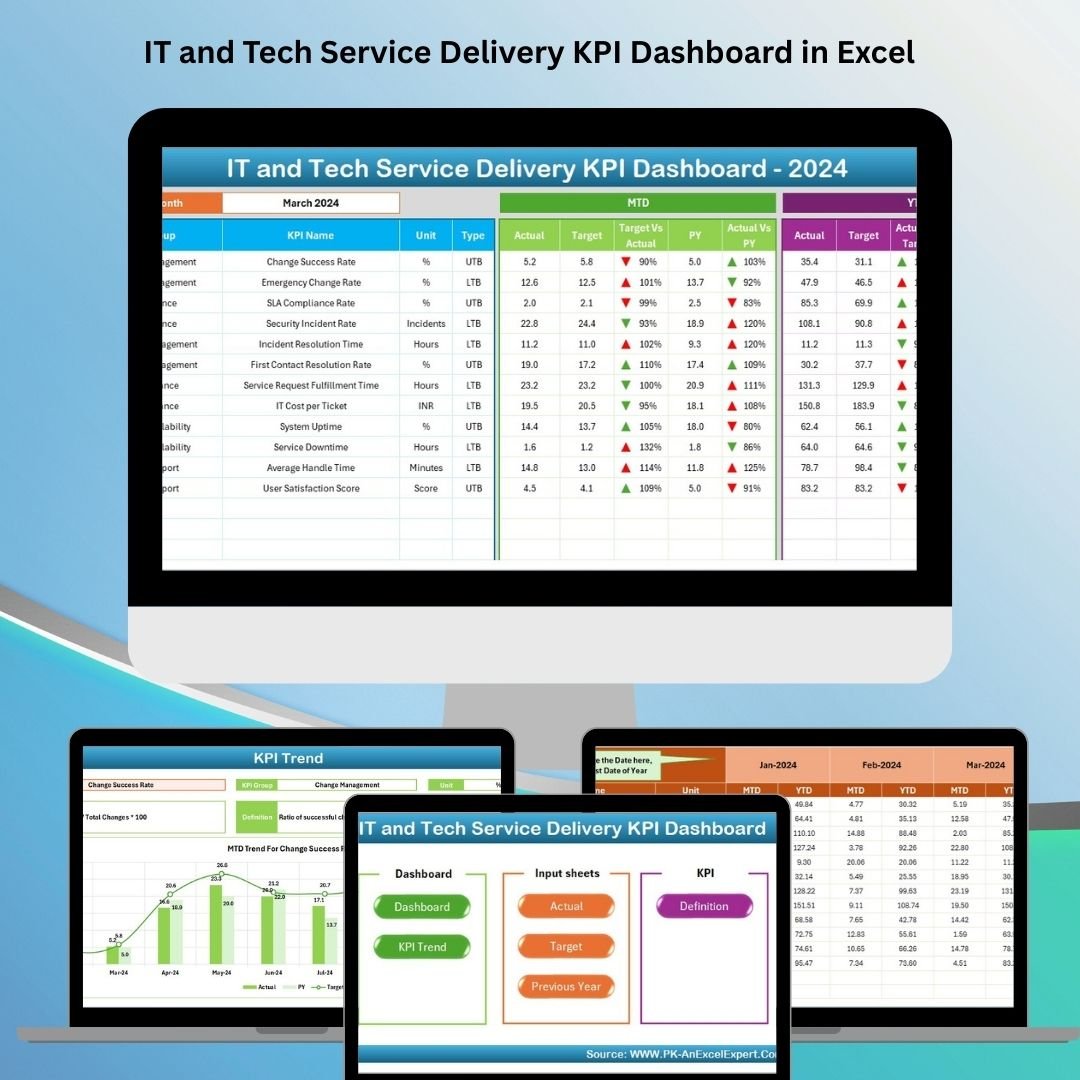
Managing IT services isn’t just about solving tickets—it’s about delivering consistent value, meeting SLAs, and driving service excellence. That’s where the IT and Tech Service Delivery KPI Dashboard in Excel comes in. 📊🚀
This Excel-based dashboard gives you a centralized view of your most critical service delivery KPIs. Whether you’re tracking incident resolution time, system uptime, or project success rates, this tool enables informed decision-making, accountability, and continuous improvement—all in one place.
✨ Key Features of the Service Delivery KPI Dashboard
🏠 Home Sheet – Easy Navigation for Every User
Access any sheet with just a click using the 6 interactive navigation buttons. A perfect entry point for beginners and busy managers alike.
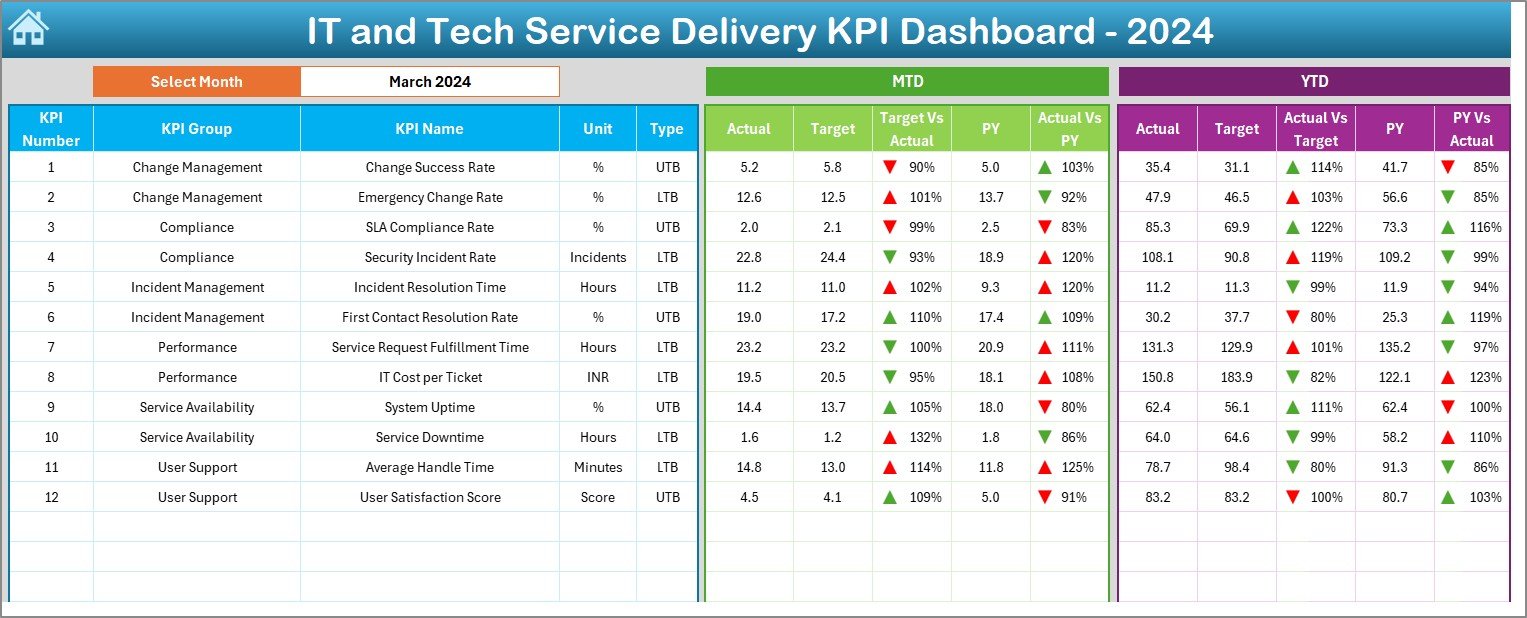
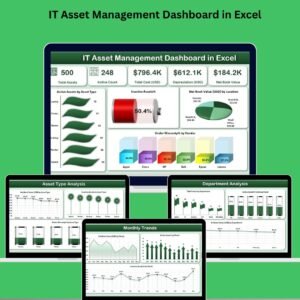
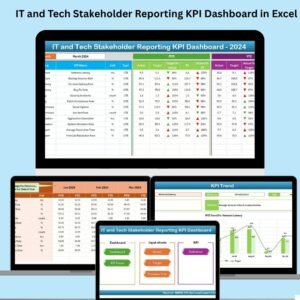
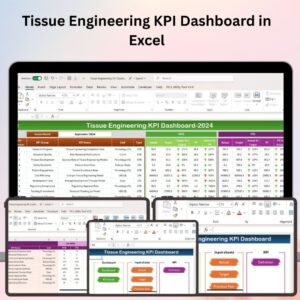
📈 Dashboard Sheet – Visual Performance at a Glance
Track key service metrics in real-time:
-
🔽 Select a Month from the dropdown in cell D3
-
📊 MTD and YTD values for Actual, Target, and Previous Year
-
🔺🔻 Conditional arrows show KPI performance direction
-
🎯 Clear visuals highlight areas of success and concern instantly
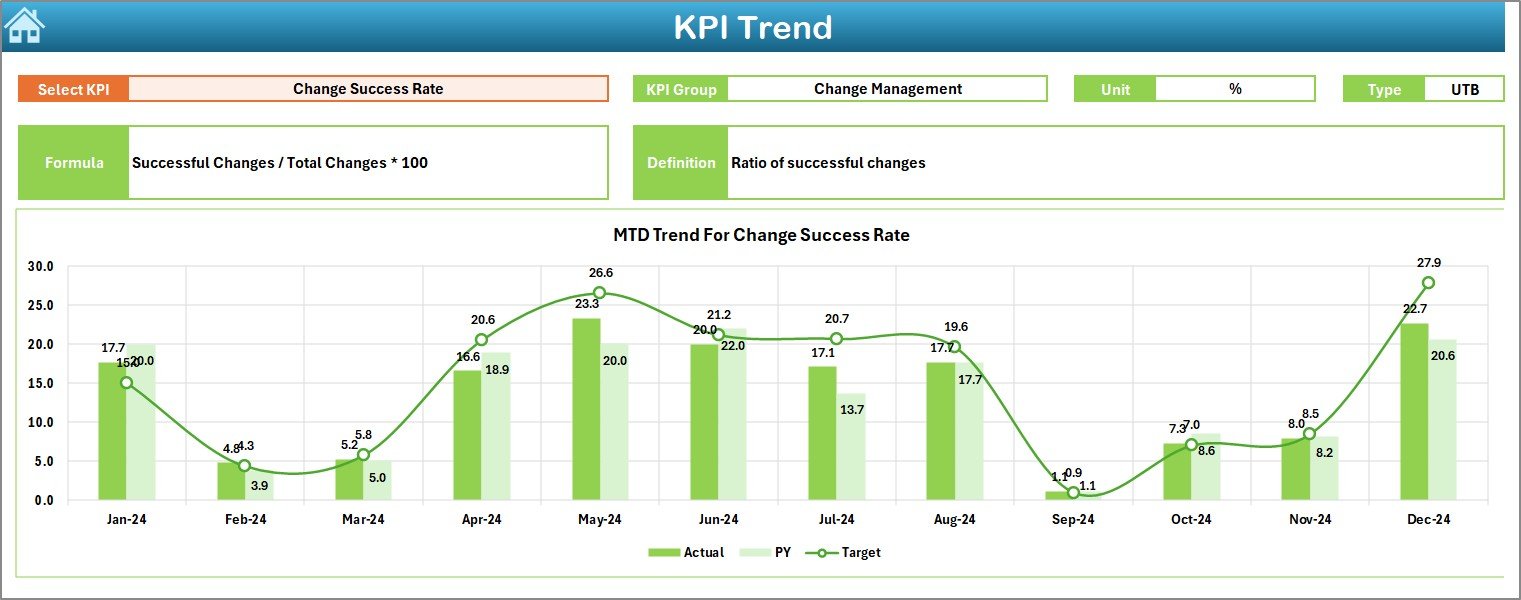
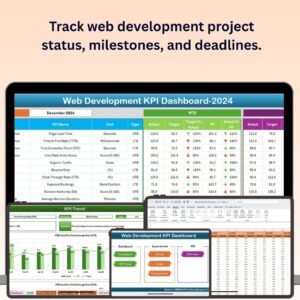
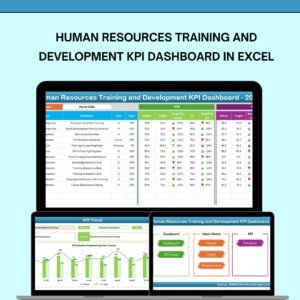
📉 KPI Trend Sheet – Deep Dive into Metrics
Select any KPI from the dropdown in C3 to view:
-
📋 KPI details (Group, Unit, Formula, Type, Definition)
-
📈 Line charts comparing Actual vs Target vs Previous Year
Perfect for understanding long-term trends and performance history.
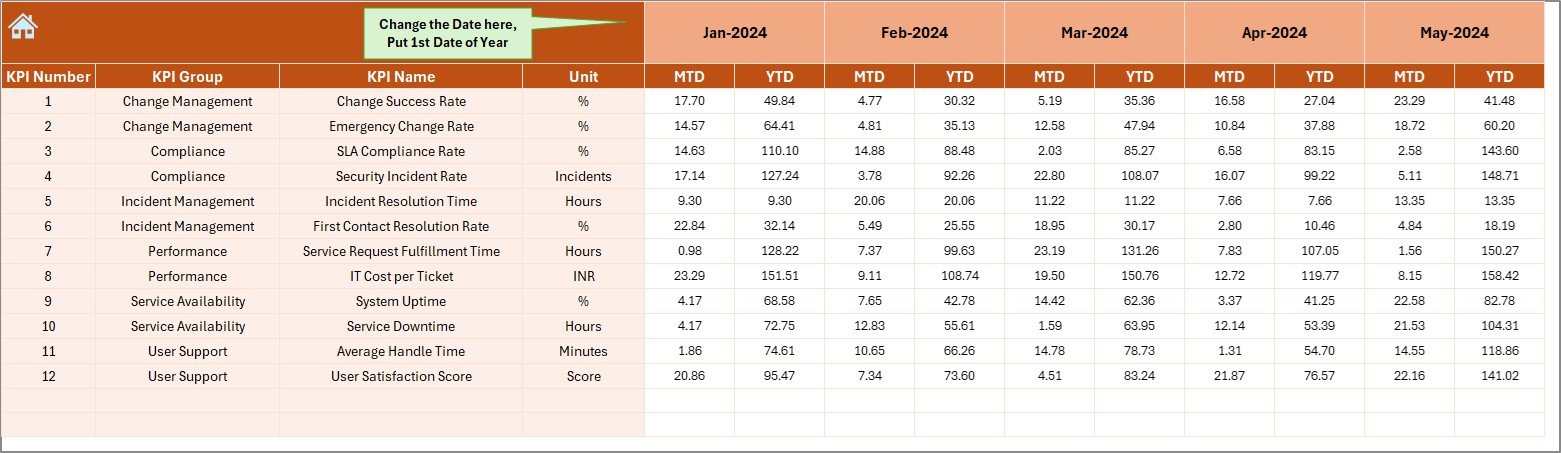
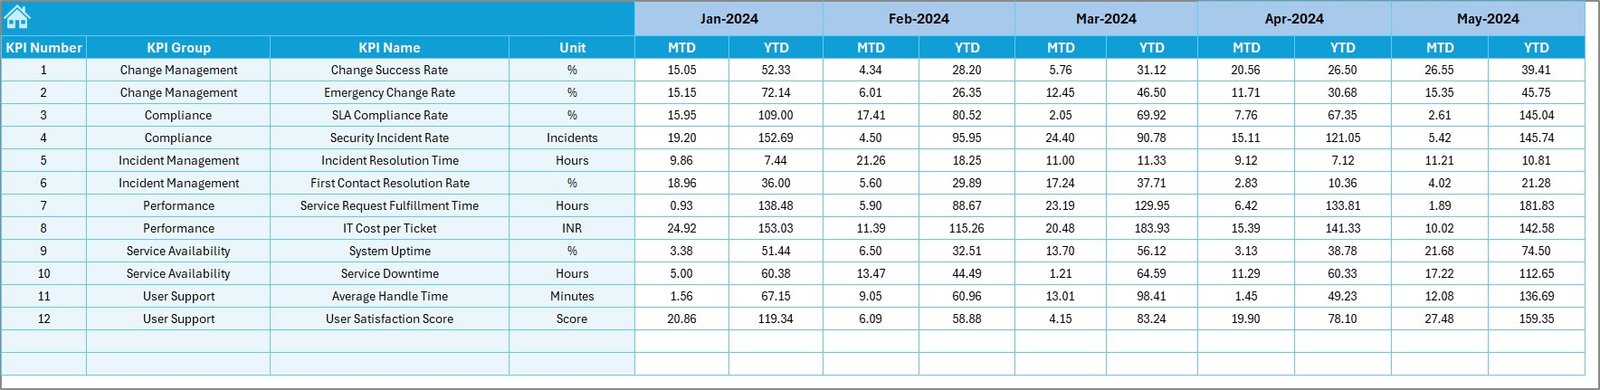
🧾 Input Sheets – Easy Monthly Data Management
Includes:
-
Actual Numbers Input Sheet – Enter MTD and YTD performance
-
Target Sheet – Set monthly goals
-
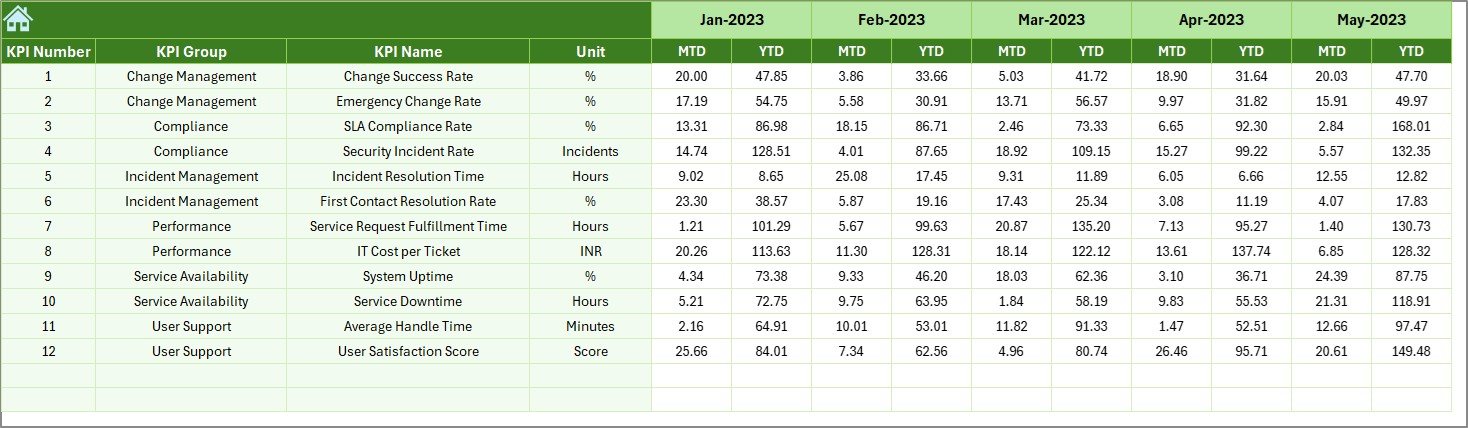
Previous Year Numbers Sheet – Add last year’s benchmarks
-
📅 Configure your fiscal start month in cell E1
Everything you enter auto-updates across the dashboard.
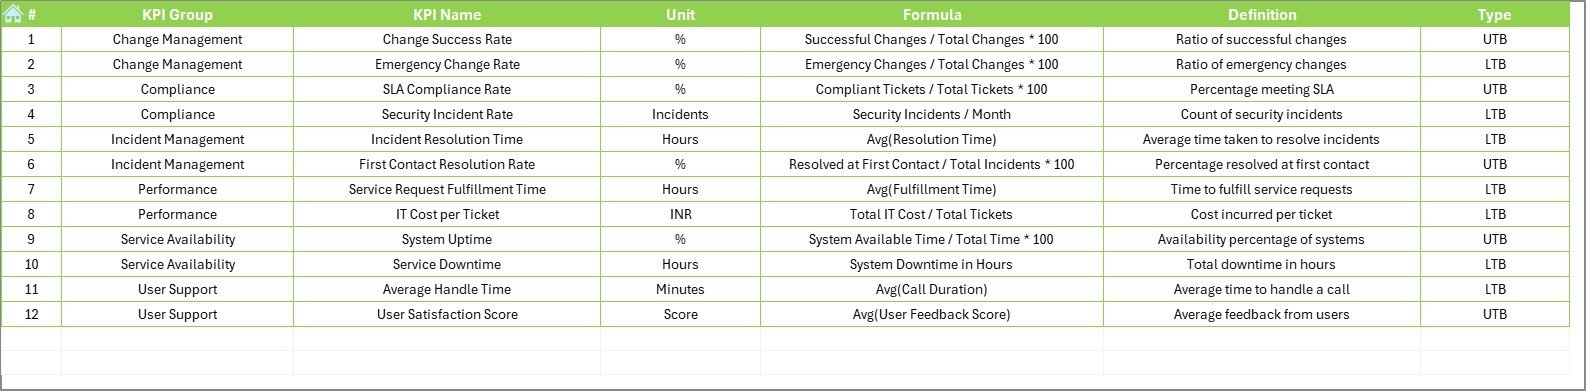
📚 KPI Definition Sheet – Keep Everyone on the Same Page
Maintain clarity with a centralized KPI reference:
-
Group, Name, Unit, Formula, Definition, and KPI Type (LTB or UTB)
Easy to edit, fully customizable, and critical for audit trails or reporting.
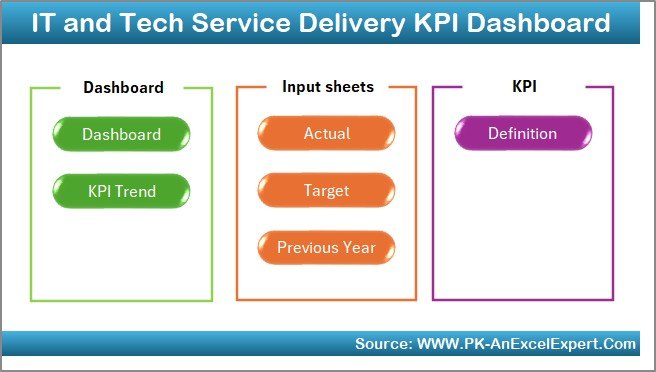
📦 What’s Inside the Dashboard?
-
🧭 Home Sheet – Quick navigation with 6 buttons
-
📊 Dashboard Sheet – Real-time visual analysis
-
📈 KPI Trend Sheet – Graph-based performance history
-
🧾 Data Input Sheets – For Actuals, Targets, and PY metrics
-
📚 KPI Definition Tab – Clear, concise metric documentation
-
🔁 Automated calculations and chart updates with dropdowns
🧠 How to Use the Product
-
📥 Download and open the Excel file
-
🔽 Select the reporting month in the Dashboard tab
-
✍️ Input MTD/YTD Actuals in the Actual Numbers sheet
-
🎯 Set targets in the Target Sheet
-
📉 Add Previous Year metrics for comparison
-
📊 Monitor performance on the Dashboard and Trend tabs
-
🔄 Update monthly for real-time tracking
Zero coding. Maximum clarity.
👥 Who Can Benefit from This Dashboard?
-
🧑💼 IT Managers – Analyze infrastructure performance
-
🧑💻 Support Desk Leads – Track ticket resolution SLAs
-
🧑🏫 Service Delivery Managers – Report on KPIs during reviews
-
👨💼 Executives – Gain insights into service ROI and team performance
-
🧰 Project Coordinators – Monitor deliverables and timelines
Whether managing 10 KPIs or 100, this Excel dashboard grows with your team.
🔗 Click here to read the Detailed blog post
📺 Visit our YouTube channel to learn step-by-step video tutorials


Reviews
There are no reviews yet.