

 Mobile-Friendly Format – Access from anywhere
Whether you’re a seasoned investor or just getting started, staying on top of your portfolio is essential. The Investment Tracker in Google Sheets is a ready-to-use, fully customizable tool that helps you track investment types, monitor ROI, and optimize your financial strategy—all in real-time. It’s the easiest way to bring clarity and control to your investments.
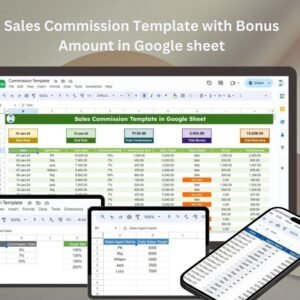
 Key Features of the Investment Tracker in Google Sheets
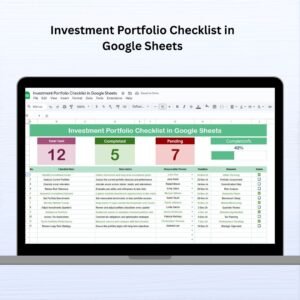
 Summary Sheet Tab
Get a complete overview of your portfolio in one glance with:
-
 Month Selector – Pick a specific month to view filtered data
 -
 Amount Invested by Investment Type – Visual pie chart for asset allocation
 -
 ROI by Investment Type – Know which investments are paying off
 -
 Key Metrics
-
Total Invested
-
Current Value
-
Total ROI (%)
-
Avg. Investment Duration (Months)
-
-
Data Sorting Options – Sort by Date or Investment Type
-
 Table Fields:
-
Date
-
Investment Type
-
Amount Invested
-
Current Value
-
ROI
-
Purchase Price
-
Duration (Months)
-
Notes
-
Dynamic Charts
The dashboard auto-updates with visuals every time you log a new transaction.
 What’s Inside the Investment Tracker in Google Sheets
You’ll get two powerful, fully integrated sheets:
 Summary Sheet – Automatically aggregates and visualizes your entire portfolio by type, date, and ROI. Ideal for monthly performance reviews and presentations.
 Investment Tracker Data Sheet – This is where you log all your transactions. Fields include:
-
Date
-
Investment Type (e.g., Crypto, Stocks, Bonds)
-
Amount Invested
-
Current Value
-
Purchase Price
-
ROI (Auto-calculated)
-
Investment Duration
-
Notes
As you update this sheet, the summary dashboard responds instantly—no formulas required.
 How to Use the Investment Tracker
-
 Enter Transactions – Log each investment in the Data Sheet
 -
View Performance – Check the Summary Dashboard for ROI and total value
-
 Sort and Filter – Organize by date, type, or month with dropdown controls
 -
 Track ROI & Duration – Automatically calculate key metrics
 -
Monitor Progress Monthly – Select your preferred month to isolate data
-
 Review & Share – Export for analysis or present to financial advisors
This tracker offers full control of your portfolio—no spreadsheets skills needed.
 Who Can Benefit from This Investment Tracker?
 Individual Investors – Stay informed and in control of personal wealth
 Financial Advisors – Use it to track and present client portfolios Traders & Crypto Enthusiasts – Monitor performance across asset classes
 Wealth Managers – Keep tabs on ROI, duration, and asset distribution Side Hustlers & Passive Income Investors – Analyze performance over time
If you invest money, this tool is for you!
 Why You’ll Love This Template
 Auto-calculates ROI—no formulas needed Visually track asset performance and distribution Filter by month or investment type Sort and analyze data instantly Mobile compatible—track on the go Shareable for advisors or tax reporting Beginner-friendly and highly customizable 100% Google Sheets—no software required
This tracker turns your scattered investment data into clean, decision-ready insights.
 Click here to read the Detailed blog post
Click here to read the Detailed blog post
 Visit our YouTube channel to learn step-by-step video tutorials
Youtube.com/@NeotechNavigators


Reviews
There are no reviews yet.