Whether you’re a seasoned investor or just getting started, staying on top of your portfolio is essential. The Investment Tracker in Google Sheets is a ready-to-use, fully customizable tool that helps you track investment types, monitor ROI, and optimize your financial strategy—all in real-time. It’s the easiest way to bring clarity and control to your investments.
📊 Key Features of the Investment Tracker in Google Sheets
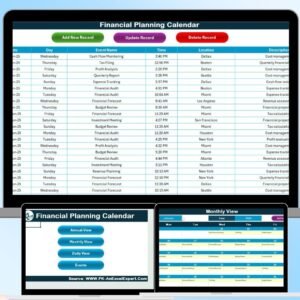
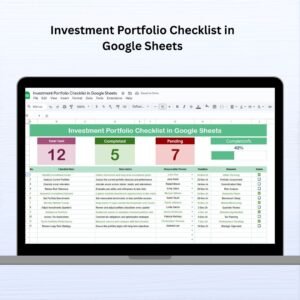
📋 Summary Sheet Tab
Get a complete overview of your portfolio in one glance with:
-
📆 Month Selector – Pick a specific month to view filtered data
-
📈 Amount Invested by Investment Type – Visual pie chart for asset allocation
-
💰 ROI by Investment Type – Know which investments are paying off
-
🔢 Key Metrics
-
Total Invested
-
Current Value
-
Total ROI (%)
-
Avg. Investment Duration (Months)
-
-
📊 Data Sorting Options – Sort by Date or Investment Type
-
📅 Table Fields:
-
Date
-
Investment Type
-
Amount Invested
-
Current Value
-
ROI
-
Purchase Price
-
Duration (Months)
-
Notes
-
📈 Dynamic Charts
The dashboard auto-updates with visuals every time you log a new transaction.
📁 What’s Inside the Investment Tracker in Google Sheets
You’ll get two powerful, fully integrated sheets:
1️⃣ Summary Sheet – Automatically aggregates and visualizes your entire portfolio by type, date, and ROI. Ideal for monthly performance reviews and presentations.
2️⃣ Investment Tracker Data Sheet – This is where you log all your transactions. Fields include:
-
Date
-
Investment Type (e.g., Crypto, Stocks, Bonds)
-
Amount Invested
-
Current Value
-
Purchase Price
-
ROI (Auto-calculated)
-
Investment Duration
-
Notes
As you update this sheet, the summary dashboard responds instantly—no formulas required.
🧭 How to Use the Investment Tracker
-
📥 Enter Transactions – Log each investment in the Data Sheet
-
📊 View Performance – Check the Summary Dashboard for ROI and total value
-
🗂️ Sort and Filter – Organize by date, type, or month with dropdown controls
-
🧮 Track ROI & Duration – Automatically calculate key metrics
-
📆 Monitor Progress Monthly – Select your preferred month to isolate data
-
📤 Review & Share – Export for analysis or present to financial advisors
This tracker offers full control of your portfolio—no spreadsheets skills needed.
👥 Who Can Benefit from This Investment Tracker?
👨💼 Individual Investors – Stay informed and in control of personal wealth
🏦 Financial Advisors – Use it to track and present client portfolios
📈 Traders & Crypto Enthusiasts – Monitor performance across asset classes
💸 Wealth Managers – Keep tabs on ROI, duration, and asset distribution
📊 Side Hustlers & Passive Income Investors – Analyze performance over time
If you invest money, this tool is for you!
💡 Why You’ll Love This Template
✅ Auto-calculates ROI—no formulas needed
✅ Visually track asset performance and distribution
✅ Filter by month or investment type
✅ Sort and analyze data instantly
✅ Mobile compatible—track on the go
✅ Shareable for advisors or tax reporting
✅ Beginner-friendly and highly customizable
✅ 100% Google Sheets—no software required
This tracker turns your scattered investment data into clean, decision-ready insights.
🔁 Click here to read the Detailed blog post
Click here to read the Detailed blog post
🎥 Visit our YouTube channel to learn step-by-step video tutorials
Youtube.com/@NeotechNavigators


Reviews
There are no reviews yet.