Every organization faces incidents — whether technical glitches, safety hazards, or operational interruptions. What differentiates high-performing teams is how efficiently they track, respond to, and resolve these incidents. The Incident Management Dashboard in Google Sheets is a ready-to-use, interactive tool designed to help organizations monitor incidents, evaluate severity levels, and improve response efficiency — all within an easy-to-use Google Sheets environment. ⚙️📊
This dashboard transforms raw data into actionable insights through real-time visual analytics, KPI summaries, and trend charts. Built for managers, safety officers, and IT teams, it enables transparent reporting, quick prioritization, and smarter decision-making — without any complex software setup.
🔑 Key Features of the Incident Management Dashboard in Google Sheets
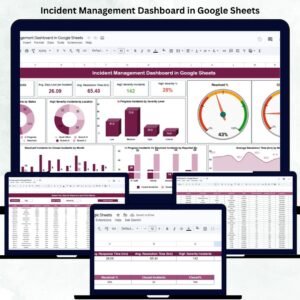
📋 Dashboard Sheet Tab (Main Interface)
-
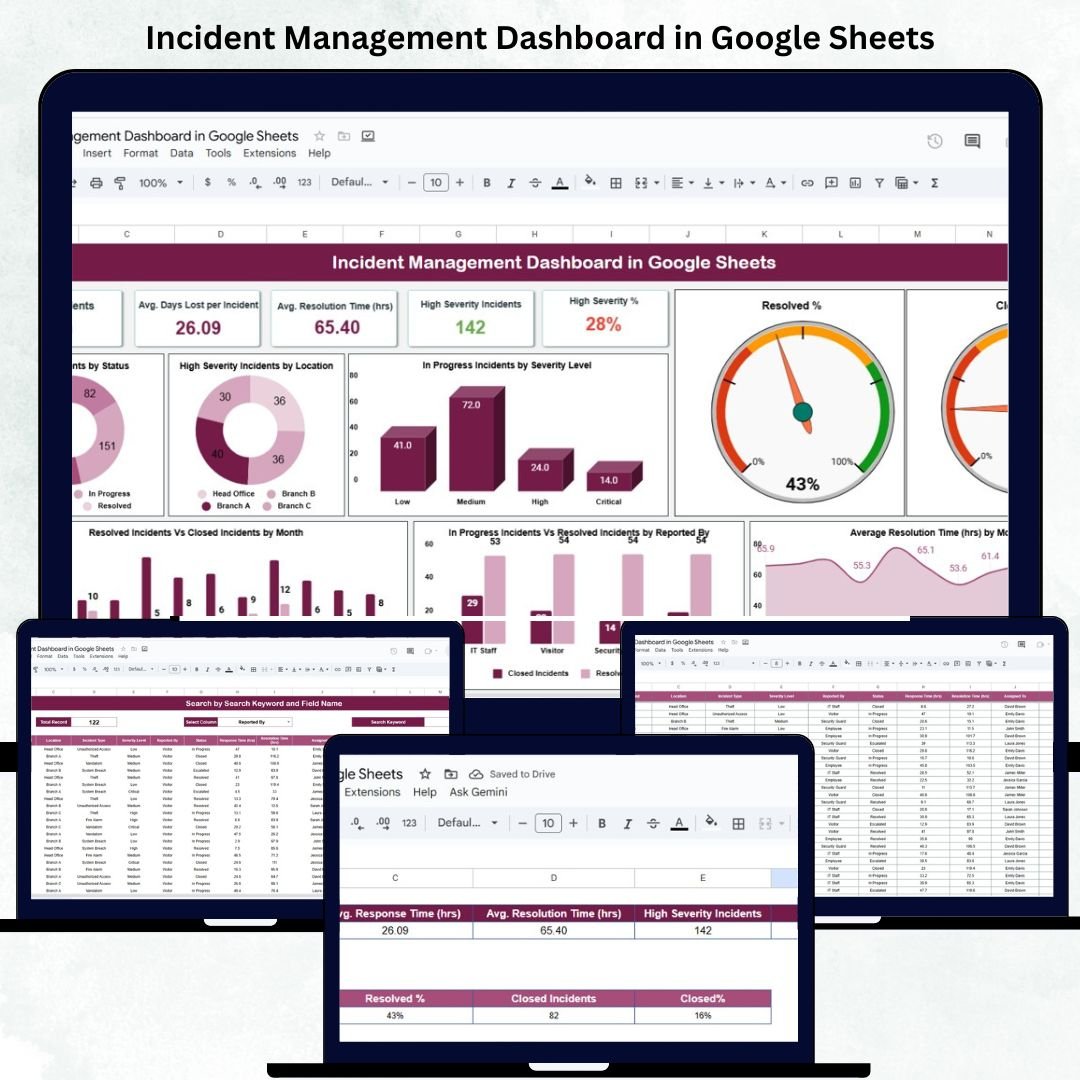
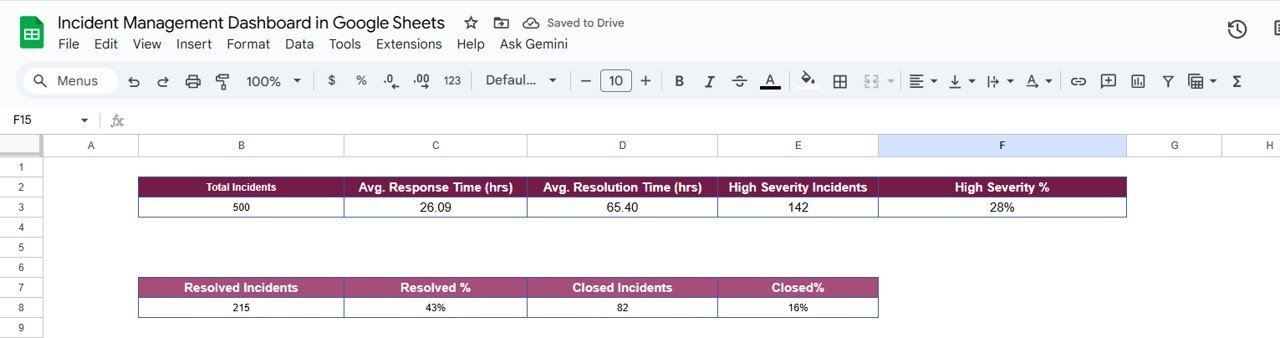
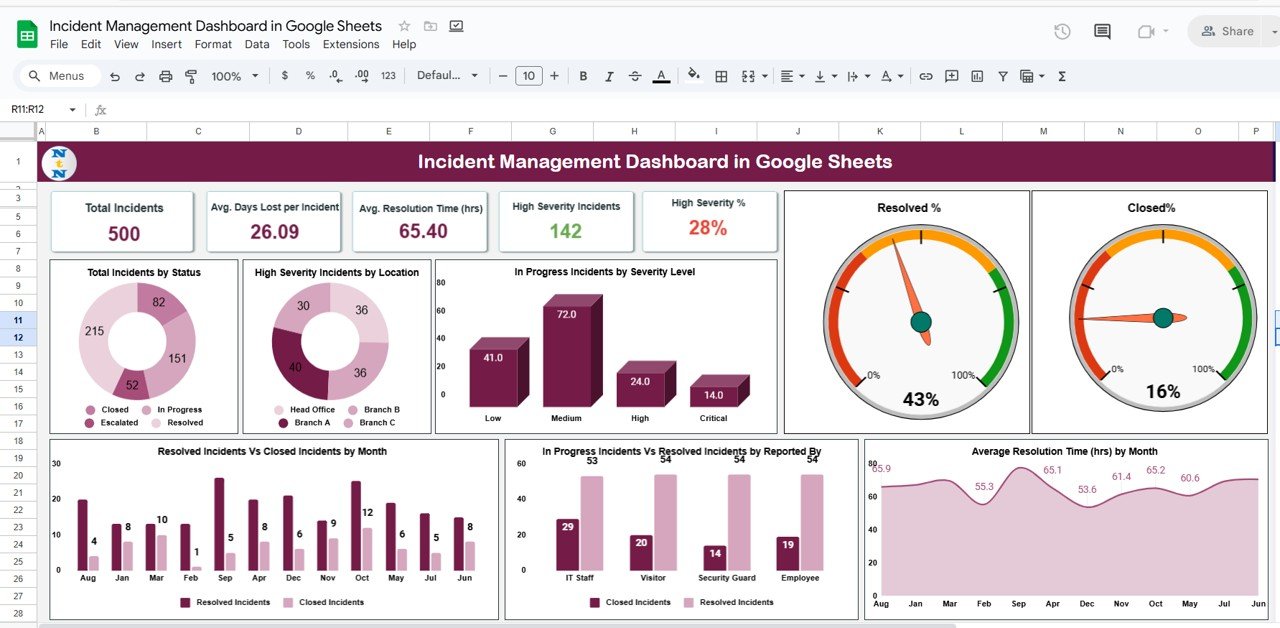
Displays all key incident KPIs at a glance:
-
Total Incidents – Count of all reported incidents
-
Avg. Response Time (hrs) – Time taken to acknowledge incidents
-
Avg. Resolution Time (hrs) – Time to resolve reported issues
-
High Severity % – Percentage of incidents marked as critical
-
High Severity Incidents – Number of high-impact cases
-
-
Visually rich charts for trend and performance tracking:
-
📊 Total Incidents by Status – Resolved, In Progress, Closed
-
🔥 High Severity by Location – Identify risk-prone areas
-
⚠️ In Progress by Severity Level – Prioritize active cases
-
✅ Resolved % vs Closed % – Compare closure efficiency
-
📅 Monthly Resolution vs Closure Rate – Evaluate progress trends
-
👥 Incidents by Reporter – Monitor team responsiveness
-
⏱️ Average Resolution Time by Month – Detect improvement or delay trends
-
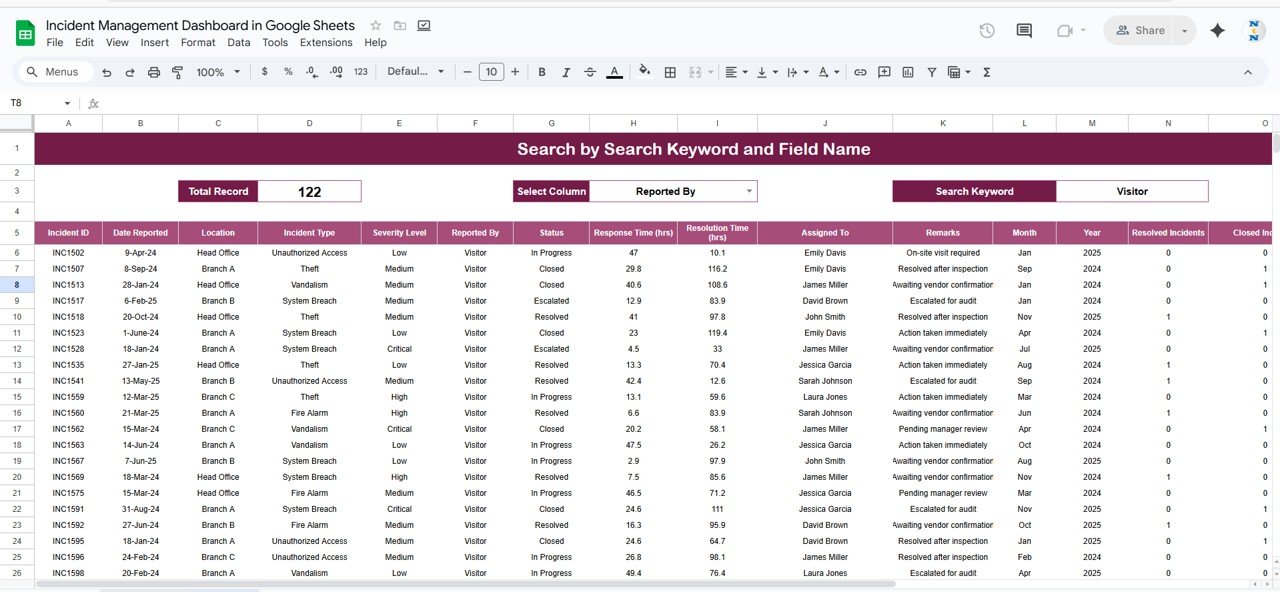
📈 Search Tab (Quick Finder)
-
Advanced filtering to search incidents by:
-
Incident ID
-
Location
-
Incident Type
-
Severity Level
-
Reported By
-
Status
-
-
Quickly locate specific records without scrolling through large data tables.
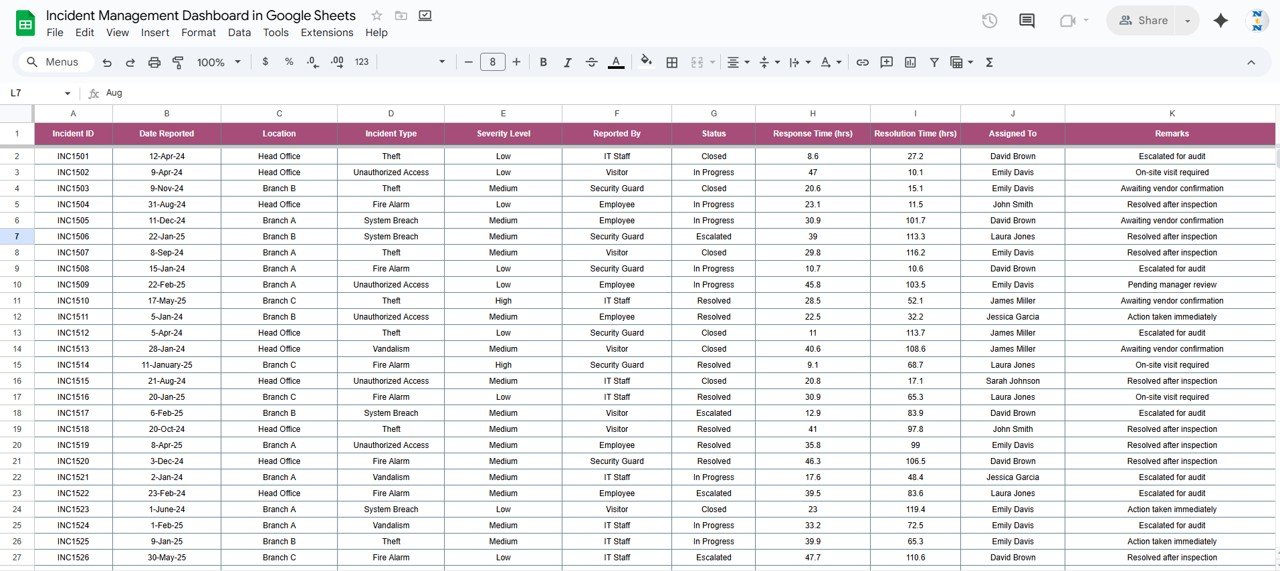
📊 Data Sheet Tab (Input Source)
-
Structured input sheet with fields like:
-
Date, Time, Location, Type, Severity, Status, Reported By, Response Time, Resolution Time
-
-
Automatic linking to dashboards and charts for real-time updates
-
Fully editable and customizable for industry-specific needs
📦 What’s Inside the Incident Management Dashboard?
✅ Pre-built Google Sheets file with ready-to-use KPI dashboards
✅ Dynamic charts and summary cards for instant insights
✅ Search tab for quick filtering and record lookup
✅ Auto-calculated metrics (response time, resolution rate, severity %)
✅ Real-time updates as new data is entered
✅ Fully customizable data fields and visuals
✅ Preloaded sample data for demonstration and testing
Everything is designed to help you track incidents efficiently, reduce risks, and improve response processes — without requiring technical expertise. 🚀
🧑💼 Who Can Benefit from This Dashboard?
🎯 IT Teams – Track system outages and ticket resolution times
🦺 Safety Officers – Monitor workplace incidents and severity
🏢 Operations Managers – Evaluate performance and process efficiency
💼 HR & Compliance Teams – Ensure timely reporting and resolution tracking
🌍 Multi-location Businesses – Monitor incidents across multiple branches
This dashboard provides clarity, accountability, and data-driven control for any organization managing frequent operational or safety incidents.
🧪 How to Use the Incident Management Dashboard
1️⃣ Enter Incident Data – Log incidents in the Data Sheet Tab.
2️⃣ View KPIs – The Dashboard Tab updates automatically.
3️⃣ Analyze Trends – Review incidents by severity, department, or location.
4️⃣ Use Search – Quickly locate specific incidents for review or escalation.
5️⃣ Share Insights – Collaborate live in Google Sheets with real-time updates.
💡 Tip: Integrate Google Forms for automated incident submissions and connect with Google Apps Script for email alerts on high-severity cases.
🌟 Why Choose This Dashboard?
-
Centralized incident tracking and performance analytics
-
Color-coded KPIs for instant decision-making
-
Customizable to any organization’s structure or workflow
-
Real-time insights via cloud-based collaboration
-
Reduces reporting time and human error
-
Improves SLA compliance and response consistency
The Incident Management Dashboard in Google Sheets gives your organization a single, powerful tool to improve safety, efficiency, and accountability. 🌟


Reviews
There are no reviews yet.