

In the renewable energy world, hydropower is a cornerstone of sustainability — but tracking its performance can be a real challenge. That’s where the Hydropower KPI Dashboard in Power BI steps in. This dynamic, interactive dashboard is tailor-made for energy analysts, power plant managers, and operations teams who want to make data-driven decisions fast.
From equipment uptime to power generation, this dashboard gives you real-time, drillable insights across all critical KPIs — helping you improve efficiency, reduce downtime, and hit your targets with confidence.
✨ Key Features of Hydropower KPI Dashboard in Power BI
📊 Summary Dashboard

Your one-stop snapshot for all KPIs. Filter by Month or KPI Group, then explore:
-
✅ Total KPIs Count
-
🎯 MTD Target Met vs Missed
-
📋 Visual KPI table with trends, variances & red/green indicators
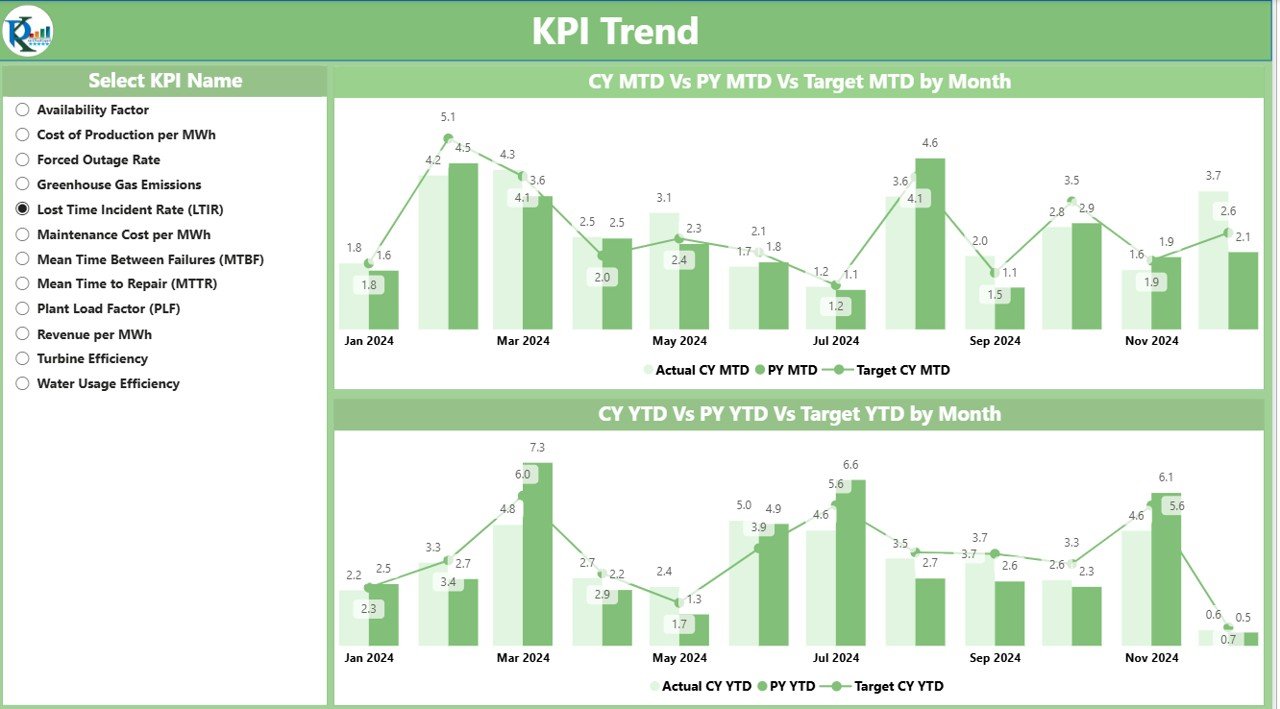
📈 KPI Trend Page
Track your performance like a pro. See MTD and YTD Trends across:
-
Current Year vs Target
-
Current Year vs Previous Year
-
Combo charts for side-by-side comparison
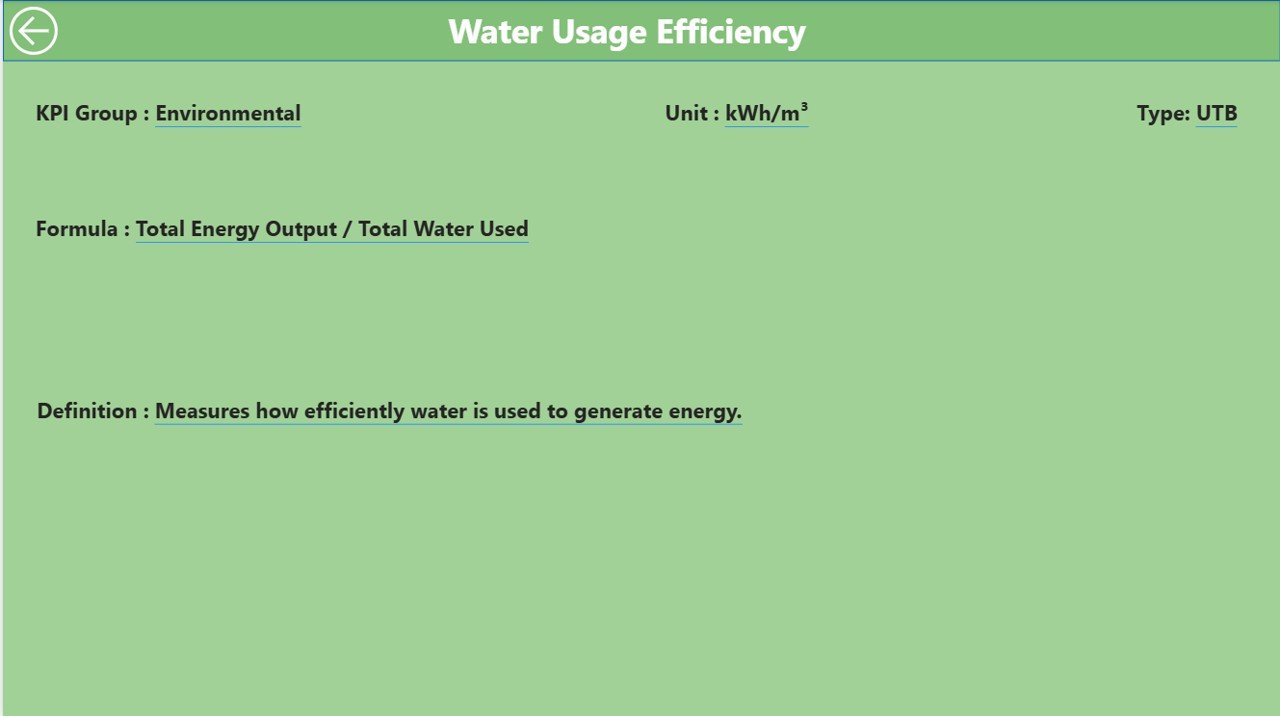
🔍 KPI Definition Page
Drill down into KPI logic! View the formula, unit, and definition of any KPI with a click. Then return instantly using the built-in Back Button.
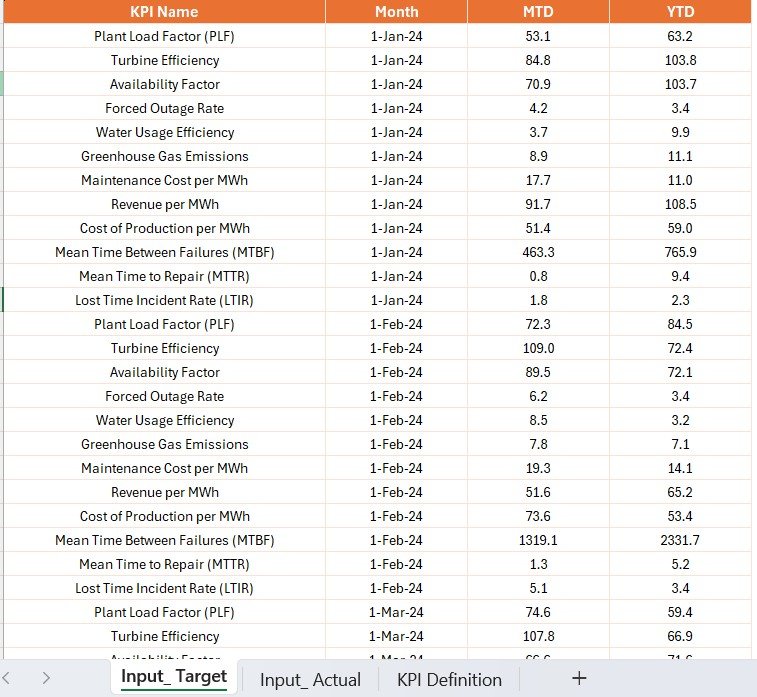
⚡ Excel-Powered Data Source
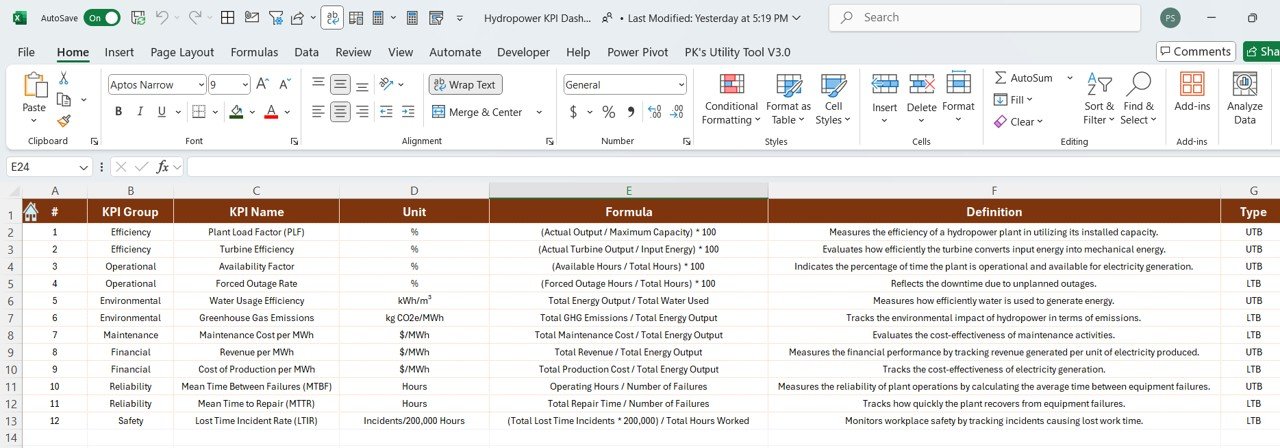
All KPI values and targets are pulled from a structured Excel file with three tabs:
-
Actual Input – MTD and YTD values
-
Target Input – Performance benchmarks
-
KPI Definitions – Metadata, grouping, formulas, and KPI types
📦 What’s Inside the Hydropower KPI Dashboard?
-
Power BI File (.pbix) – Fully interactive, no setup required
-
Excel Data Source (.xlsx) – Includes Actual, Target, and KPI Definition sheets
-
Pre-Built Pages:
-
✅ Summary Page
-
📈 KPI Trend Page
-
🔍 Drill-through Definition Page
-
-
Visual Cues:
-
▲ ▼ icons, red/green colors, performance variance in %
-
Everything is built with clarity and usability in mind — even for non-tech users.
🛠 How to Use the Hydropower KPI Dashboard
-
Prepare Your Excel Data
Fill in your actuals, targets, and definitions in the provided template. -
Open Power BI File
Refresh the file to pull the latest metrics into the dashboard. -
Start Exploring!
Use slicers to filter by KPI group or month, track trends, and review target achievements. -
Drill Down for More Info
Click any KPI row to view formula, type, and details on the KPI Definition page. -
Repeat Monthly
Update your Excel source regularly to keep your reports fresh and accurate.
👥 Who Can Benefit from This Dashboard?
✅ Power Plant Managers – Stay on top of generation goals and operational health
✅ Energy Analysts – Monitor performance, uncover inefficiencies, and report with clarity
✅ Operations Teams – Drill into trends and benchmark progress monthly
✅ Renewable Energy Consultants – Deliver better client insights with real-time visuals
✅ Sustainability Leads – Track environmental impact metrics efficiently
If your job involves hydropower or energy reporting, this dashboard is your secret weapon!


Reviews
There are no reviews yet.