
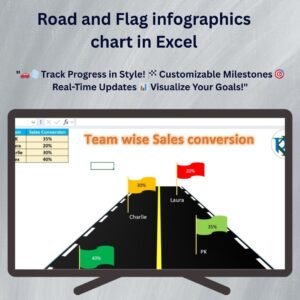
The Road and Flag Infographics Chart in Excel is an innovative and visually striking tool designed to enhance your presentations and reports. This dynamic chart allows you to showcase data progress, milestones, and goals in a clear, visually appealing manner using a road and flag theme. Whether you’re tracking project milestones, sales targets, or other key performance indicators (KPIs), this chart provides an engaging way to present your data.
Built within Excel, this infographic chart is fully customizable, enabling you to adapt it to any type of data. It’s the perfect way to illustrate progress toward goals, show stages of a process, or simply add a creative touch to your reports. With its easy-to-understand layout and interactive features, it’s ideal for business professionals, project managers, and analysts.

Key Features of the Road and Flag Infographics Chart in Excel
📌 Visually Engaging Design
The road and flag infographic chart uses vibrant colors and intuitive design elements to highlight progress, making your data both visually appealing and easy to understand.
🛠 Customizable Milestones
You can easily customize the chart to reflect your unique milestones, from project phases to sales targets. Adjust the number of milestones and modify the icons, labels, and colors to match your brand or theme.
💡 Track Progress in Real-Time
This chart allows you to update progress as it happens, showing real-time changes to data points, which helps you stay on top of goals and deadlines.
🔢 Interactive and Dynamic
Use Excel’s interactive features to update the chart dynamically. With a simple change in the data, the chart will automatically update to reflect new progress, keeping it accurate and relevant at all times.
🚀 Easy to Use
No advanced Excel skills are needed to create or update the chart. The design is user-friendly, allowing both beginners and advanced users to use it effectively.
📊 Multiple Use Cases
This chart is versatile and can be used in a variety of industries and sectors, including project management, sales tracking, education, and more.
⚙ Simple Setup
The chart is easy to set up, with clear instructions to help you integrate it into your existing Excel workbooks quickly.
🚀 Why You’ll Love This Road and Flag Infographics Chart in Excel
✅ Engaging Visuals – Use a creative road and flag design to track your goals and milestones. ✅ Customizable for Any Data – Adapt the chart for project tracking, sales goals, or any other data-driven needs. ✅ Real-Time Updates – Automatically update progress as data changes. ✅ Easy to Use – No technical skills needed to set up or modify the chart. ✅ Enhance Presentations – Make your reports more compelling with this visually appealing chart.
📂 What’s Inside the Road and Flag Infographics Chart in Excel?
- Road and Flag Design: A unique infographic chart to visually track progress.
- Customizable Milestones: Adjust milestones to fit your goals and data points.
- Dynamic Updates: The chart updates in real-time based on the input data.
- Simple Setup Instructions: Clear and easy-to-follow instructions to get started quickly.
🔍 How to Use the Road and Flag Infographics Chart in Excel
1️⃣ Download the Template – Access the Excel template instantly after purchase. 2️⃣ Customize the Data – Enter your milestones and goals into the provided fields. 3️⃣ Track Progress – Use the interactive features to track and update progress in real-time. 4️⃣ Visualize Results – Watch your goals come to life with the colorful and engaging design. 5️⃣ Present and Share – Share the chart in presentations or reports for a visually appealing summary of your progress.
🎯 Who Can Benefit from This Road and Flag Infographics Chart? 🔹 Project Managers 🔹 Sales Teams 🔹 Business Analysts 🔹 Educators 🔹 Marketers and Campaign Managers 🔹 Anyone who needs to track goals and progress visually
Track progress in an engaging and effective way with the Road and Flag Infographics Chart in Excel. Perfect for projects, sales goals, and any other milestones you need to monitor, this chart adds creativity and clarity to your data.
Click here to read the Detailed blog post
https://www.pk-anexcelexpert.com/road-and-flag-infographics-chart-in-excel/
Visit our YouTube channel to learn step-by-step video tutorials
Also check our Incentive Dashboard in Excel


Reviews
There are no reviews yet.