

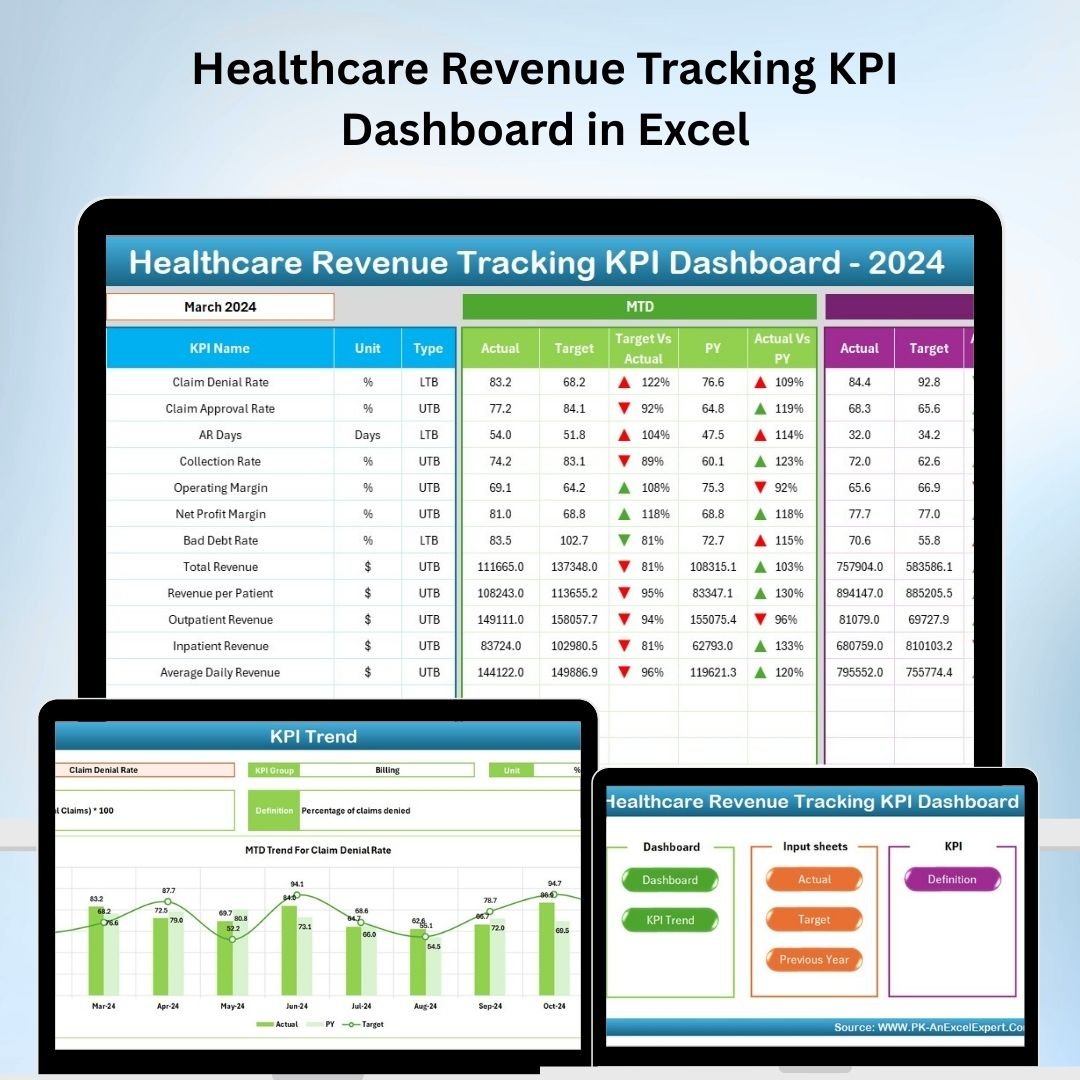
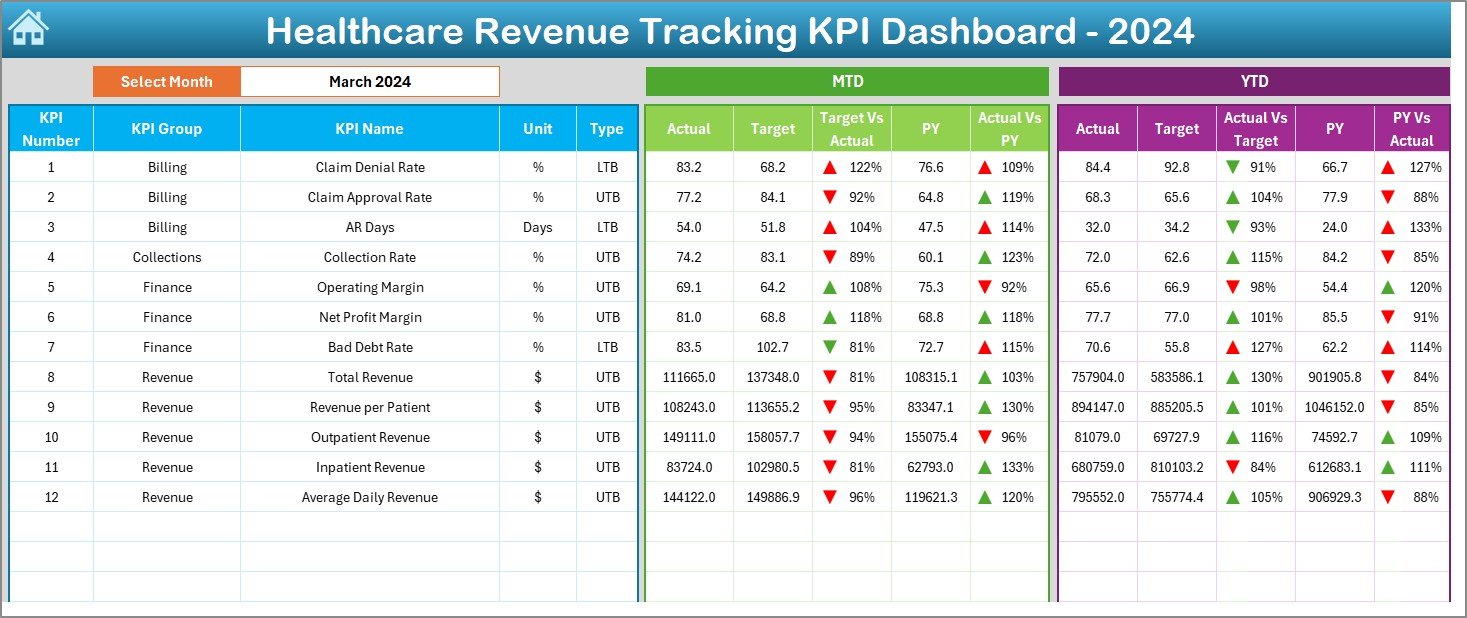
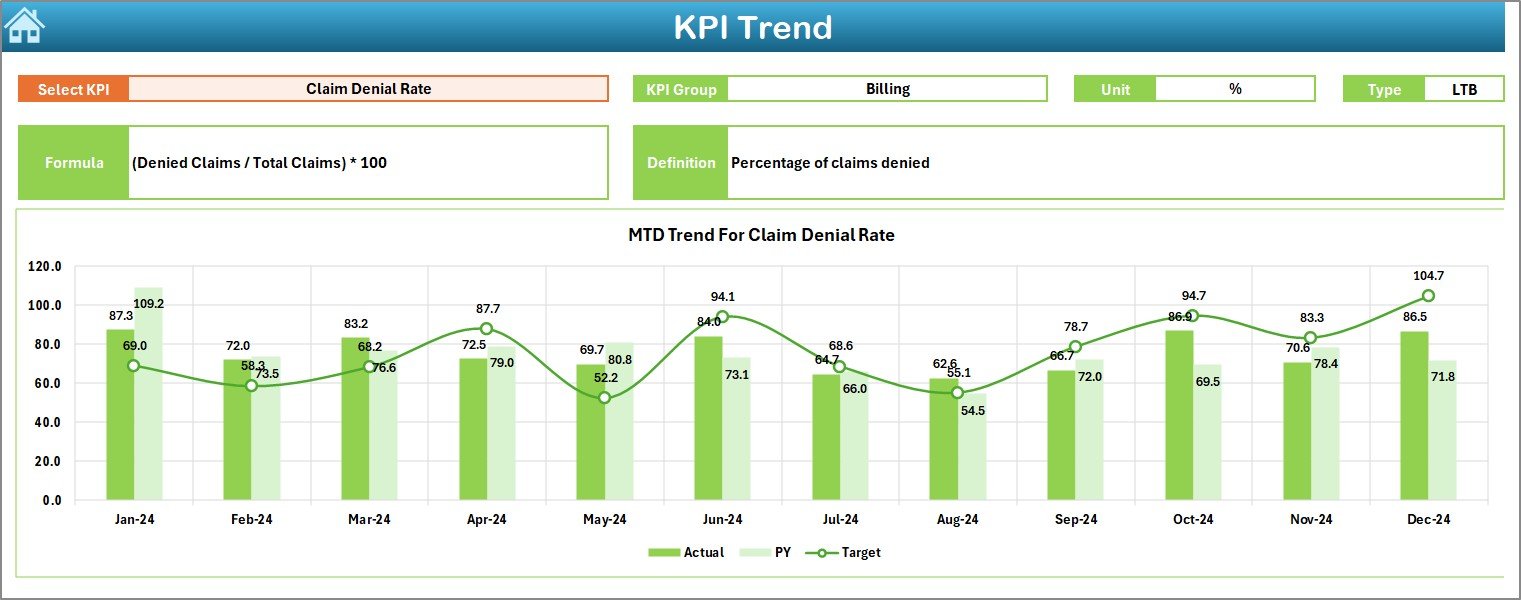
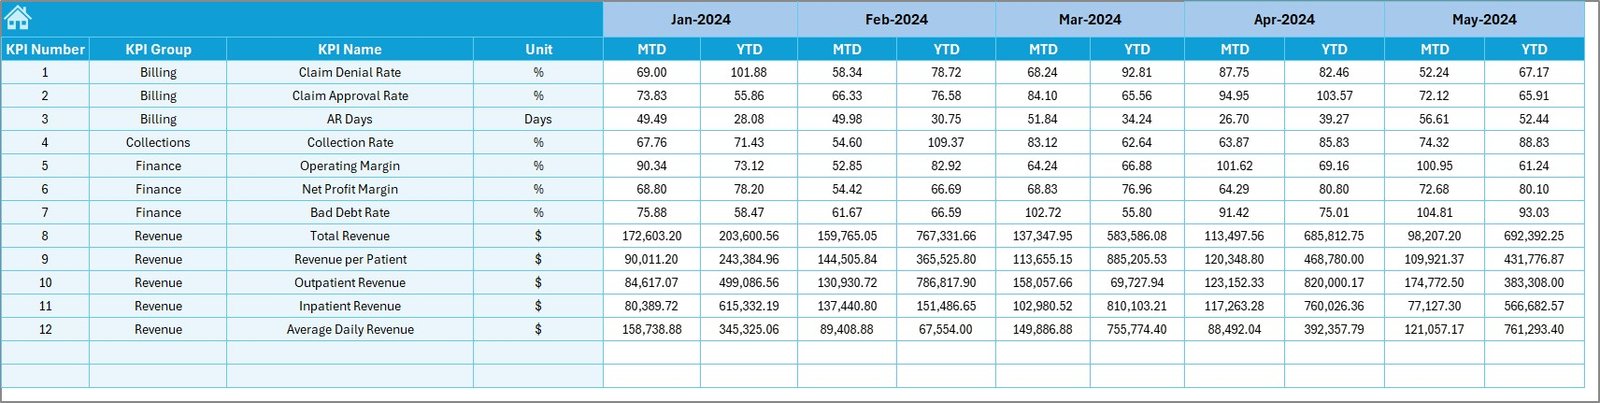
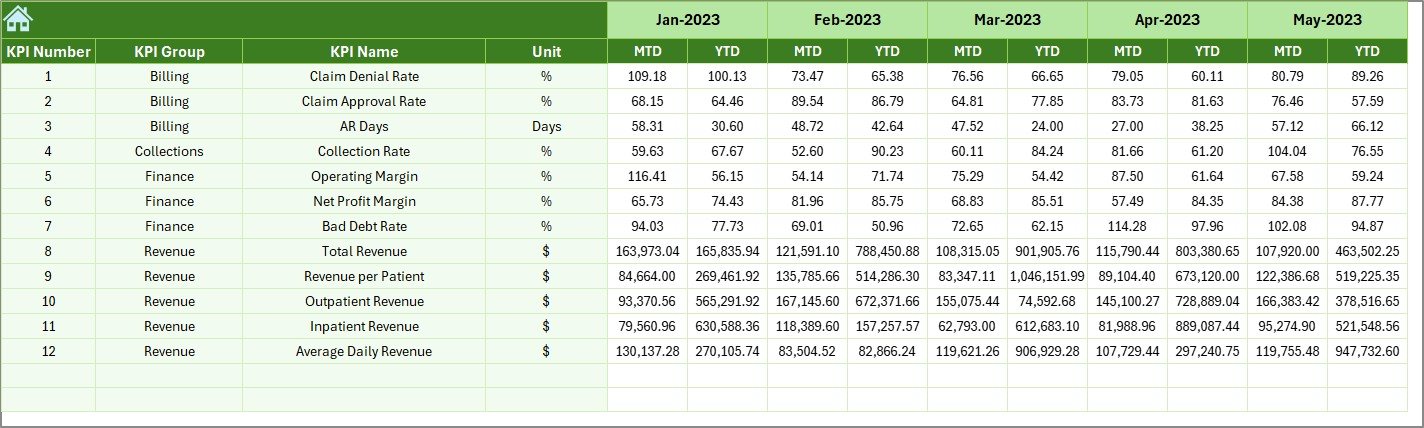
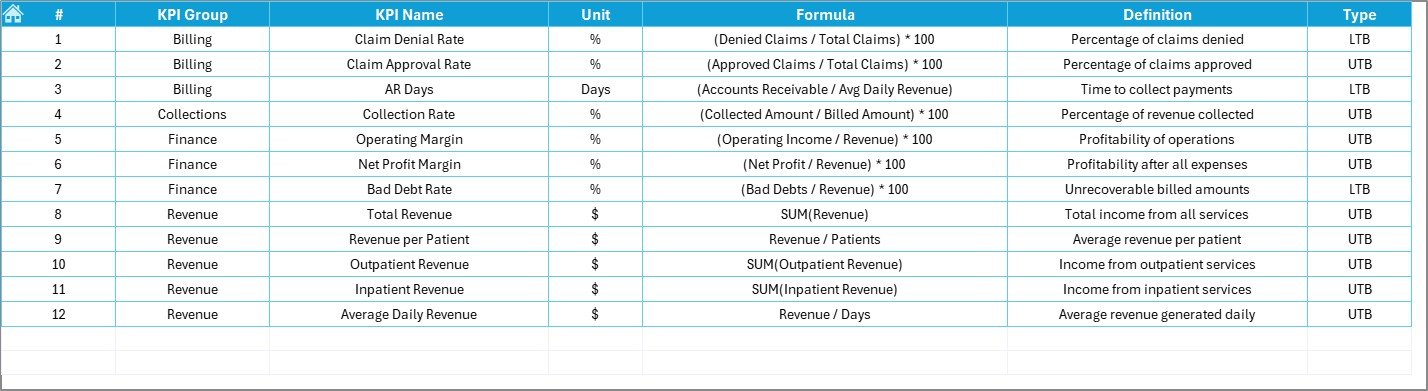

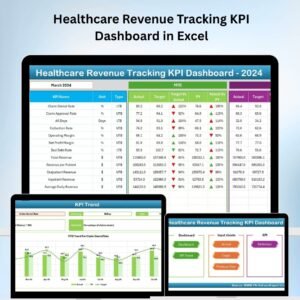
The Healthcare Revenue Tracking KPI Dashboard in Excel is a powerful and comprehensive tool designed to help healthcare providers, administrators, and finance teams track and manage revenue performance. This Excel-based dashboard allows you to monitor key performance indicators (KPIs) such as patient revenue, insurance claims, payment collections, and outstanding balances, providing essential insights into the financial health of your healthcare organization.
By using this dashboard, you can streamline your revenue management processes, improve cash flow, and enhance financial decision-making. Whether you are managing a hospital, clinic, or private practice, this tool provides a centralized platform to track healthcare revenue, identify trends, and ensure optimal financial performance.
Key Features of the Healthcare Revenue Tracking KPI Dashboard in Excel
📊 Revenue Performance Monitoring
Track your total revenue, including patient payments, insurance reimbursements, and additional income streams. This feature provides a clear overview of your revenue streams and helps you manage your finances more effectively.
💳 Insurance Claims & Payments Tracking
Monitor insurance claim submissions, claim statuses, and payments. Track outstanding claims and identify issues that may delay reimbursements, ensuring faster payments and improved cash flow.
📈 Outstanding Balance Monitoring
Track unpaid balances, overdue invoices, and payment collection progress. This KPI helps you identify outstanding revenue and take necessary actions to recover payments.
📅 Time-Based Revenue Analysis
Track revenue performance over time (daily, weekly, monthly, quarterly). Analyze trends in payment collections and claim processing to assess long-term revenue growth and financial sustainability.
📉 Customizable KPIs & Metrics
Tailor the dashboard to track the specific financial KPIs most relevant to your healthcare organization. Add custom revenue categories, cost centers, or billing information to suit your needs.
⚙️ Data Visualization & Insights
Visualize financial data with dynamic charts and graphs. Use real-time insights to make informed decisions that drive financial growth and operational efficiency.
Why You’ll Love the Healthcare Revenue Tracking KPI Dashboard in Excel
✅ Centralized Financial Management
Keep track of all revenue-related data in one organized dashboard. From patient payments to insurance claims, everything is consolidated in one place for easy access and management.
✅ Improve Cash Flow & Payments
Monitor payment progress and outstanding balances. By identifying payment delays early, you can take action to improve cash flow and reduce outstanding invoices.
✅ Optimize Revenue Collection
Track insurance claims, payments, and outstanding balances to ensure efficient and timely revenue collection, minimizing revenue leakage.
✅ Data-Driven Financial Decisions
Use real-time data to analyze revenue trends, identify growth opportunities, and improve financial forecasting. Make informed decisions based on reliable financial insights.
✅ Customizable & Scalable
The dashboard is fully customizable to meet your healthcare organization’s unique financial tracking needs. It can scale from small clinics to large hospitals with complex billing systems.
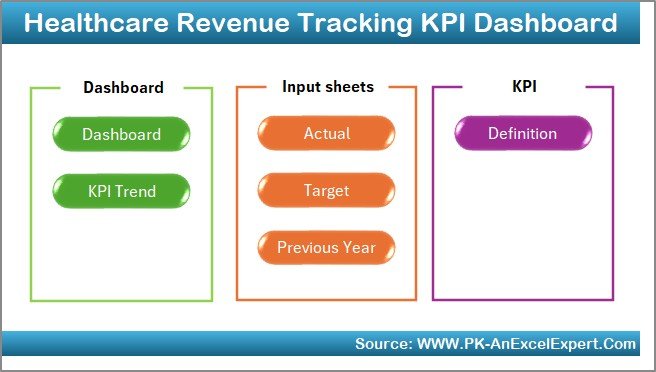
What’s Inside the Healthcare Revenue Tracking KPI Dashboard in Excel?
Revenue Performance Monitoring: Track patient payments, insurance claims, and total revenue.
Insurance Claims & Payments Tracking: Monitor insurance claim statuses, payments, and outstanding claims.
Outstanding Balance Monitoring: Track overdue payments and unpaid invoices.
Time-Based Analysis: Monitor revenue performance over different periods to assess growth trends.
Customizable KPIs: Tailor the dashboard to track the most relevant financial metrics for your organization.
Data Visualization & Insights: Generate charts and graphs to visualize revenue data and identify trends.
How to Use the Healthcare Revenue Tracking KPI Dashboard in Excel
1️⃣ Download the Template: Access the Healthcare Revenue Tracking KPI Dashboard in Excel instantly.
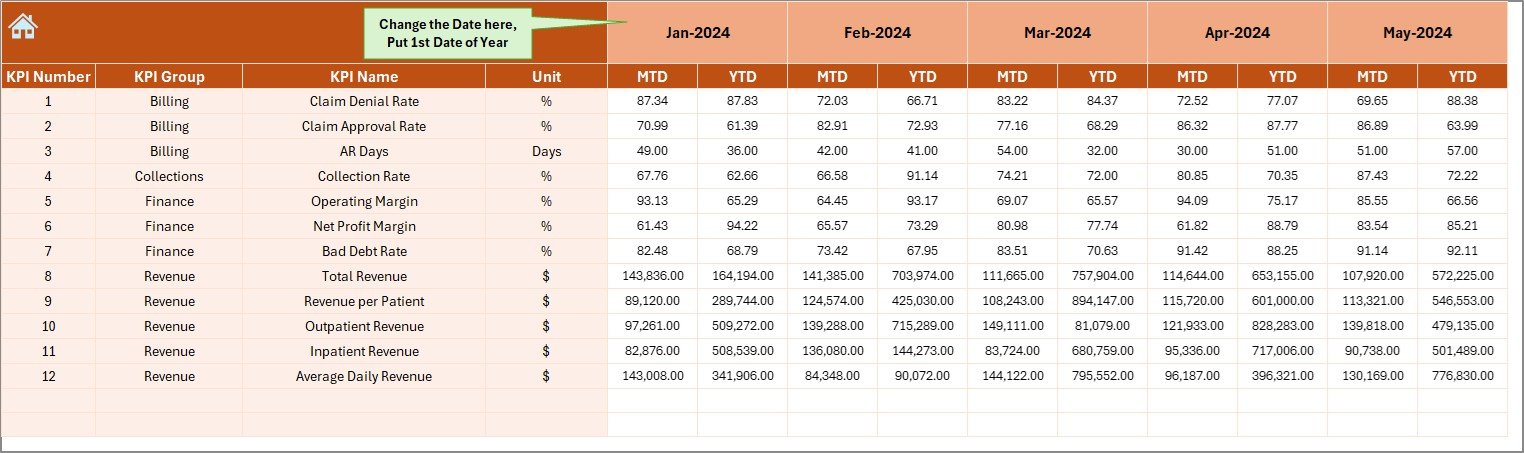
2️⃣ Input Financial Data: Enter data such as patient payments, insurance claims, and outstanding balances.
3️⃣ Track KPIs & Performance: Monitor key financial metrics such as claim status, revenue, and overdue payments.
4️⃣ Analyze Trends & Data: Use time-based analysis to identify trends and improve revenue collection strategies.
5️⃣ Optimize Financial Performance: Make data-driven decisions to optimize revenue collection and financial management.
Who Can Benefit from the Healthcare Revenue Tracking KPI Dashboard in Excel?
🔹 Healthcare Providers & Clinics
🔹 Hospitals & Medical Institutions
🔹 Medical Billing & Revenue Cycle Teams
🔹 Insurance & Claims Management Teams
🔹 Financial Managers & Analysts in Healthcare
🔹 Small & Medium Healthcare Practices
🔹 Large Healthcare Organizations
Ensure efficient revenue tracking and financial management with the Healthcare Revenue Tracking KPI Dashboard in Excel. Monitor insurance claims, outstanding balances, and total revenue to optimize cash flow and improve operational efficiency.
Click here to read the Detailed blog post
Visit our YouTube channel to learn step-by-step video tutorials
Youtube.com/@PKAnExcelExpert






























Reviews
There are no reviews yet.