


Healthcare Insurance KPI Dashboard in Google Sheets
In the rapidly evolving healthcare insurance industry, staying on top of key performance indicators (KPIs) is crucial. This Healthcare Insurance KPI Dashboard in Google Sheets provides a simple, yet powerful, tool to track, visualize, and analyze the most important metrics related to healthcare insurance performance. From assessing service efficiency to improving customer satisfaction, this customizable template offers real-time insights that can help healthcare providers make informed decisions.

Key Features of the Healthcare Insurance KPI Dashboard
🔑 Real-Time Tracking
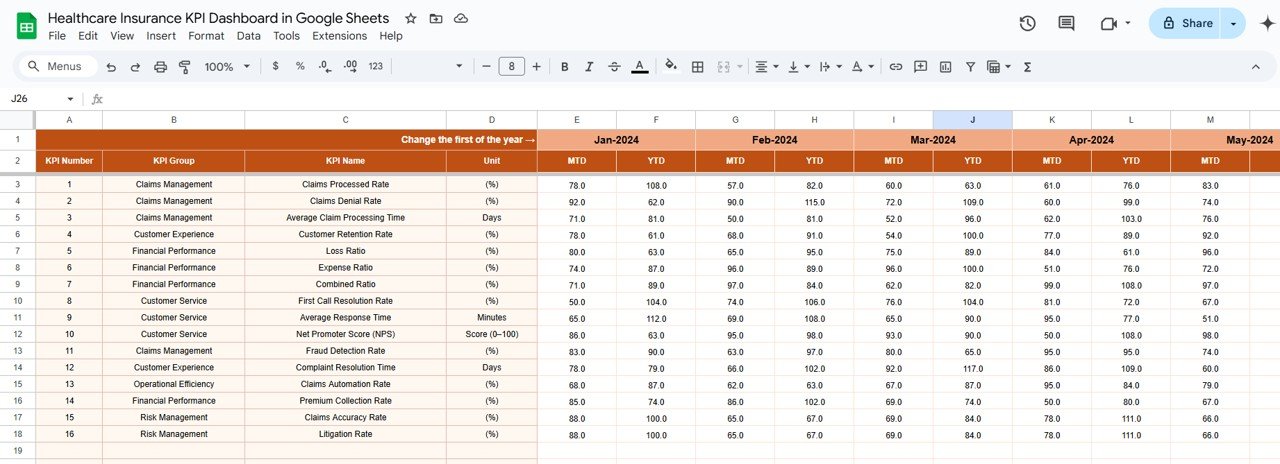
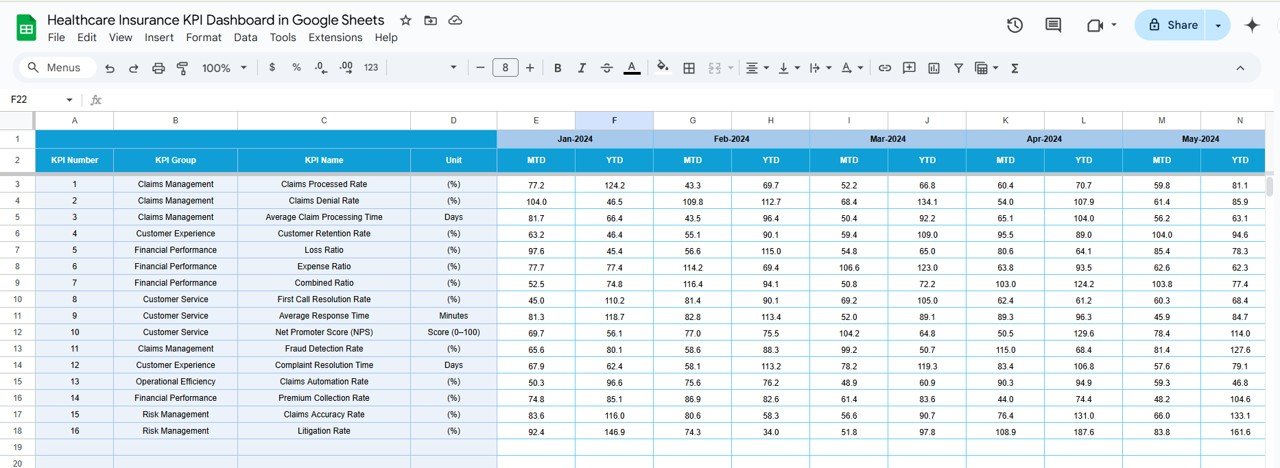
Track all your key metrics in real time, ensuring you can always make data-driven decisions. By monitoring Month-to-Date (MTD) and Year-to-Date (YTD) data, you can quickly identify trends and act accordingly.
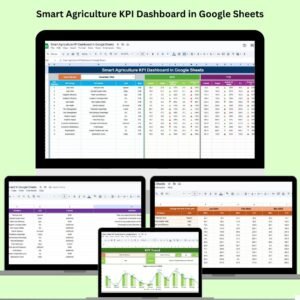
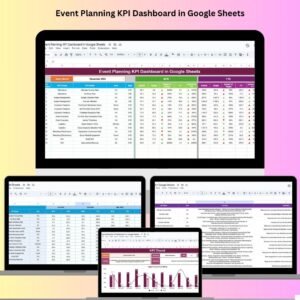
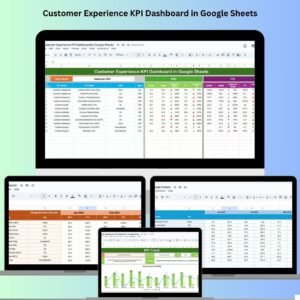
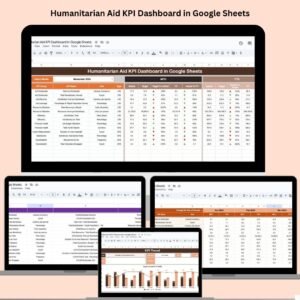
📊 Data Visualizations
The dashboard includes visually engaging charts and graphs, making complex data easy to understand at a glance. With conditional formatting (up and down arrows) to track performance against targets, decision-making becomes seamless.
📅 Customizable Date Selection
The month dropdown feature allows you to select any month and update the entire dashboard with relevant data, making it easy to compare performance across time periods.
📝 Multiple Sheets for Comprehensive Tracking
This template includes multiple sheets to input, monitor, and compare data:
-
Dashboard Sheet: Displays all key metrics in one place
-
KPI Trend Sheet: Visualize KPI trends over time
-
Actual Numbers Sheet: Input actual performance data
-
Target Sheet: Set targets and track performance
-
Previous Year Sheet: Compare with historical data
-
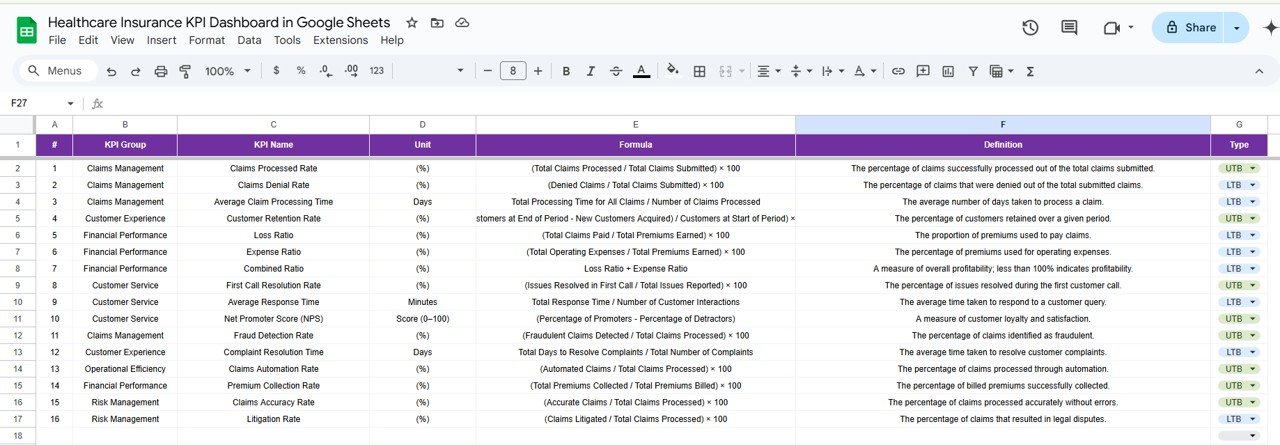
KPI Definition Sheet: Define and clarify each metric
What’s Inside the Healthcare Insurance KPI Dashboard
💼 6 Comprehensive Worksheets
The template consists of six sheets, each dedicated to tracking and managing different aspects of healthcare insurance KPIs. Whether you are inputting actual data, setting targets, or analyzing trends, each sheet provides structured areas for seamless data entry.
📊 Dynamic Performance Tracking
Visual representation of KPIs such as claims processing time, policy renewal rates, and customer satisfaction helps you identify strengths and weaknesses quickly.
🔄 Easy-to-Use Interface
With user-friendly dropdowns and automatic data updates, you don’t need to be an Excel expert to get started. The dashboard simplifies complex data analysis into a few clicks.
How to Use the Healthcare Insurance KPI Dashboard
1️⃣ Download and Install the Template
Simply download the Healthcare Insurance KPI Dashboard and open it in Google Sheets.
2️⃣ Input Data for MTD, YTD, and Historical Trends
Enter your actual data in the Actual Numbers Sheet, set monthly and yearly targets in the Target Sheet, and track your performance with ease.
3️⃣ Customize for Your Needs
Adjust the KPIs based on your specific needs and business goals. Whether you’re tracking claims processing or customer satisfaction, you can modify the dashboard as required.
4️⃣ Track Trends and Compare Results
Use the KPI Trend Sheet to visualize how each metric has changed over time, and make comparisons with last year’s data using the Previous Year Sheet.
5️⃣ Stay Informed with Real-Time Updates
Keep the data updated regularly to ensure that your dashboard always reflects accurate, real-time insights.
Who Can Benefit from This Healthcare Insurance KPI Dashboard
🏥 Healthcare Providers
Whether you run a small practice or a large insurance company, tracking key performance metrics is vital to improving operational efficiency and customer service. This dashboard can be customized to fit your exact needs.
📊 Data Analysts
If you’re responsible for analyzing healthcare insurance data, this dashboard offers the tools you need to track KPIs, analyze trends, and provide actionable insights.
💼 Insurance Managers
Streamline the process of monitoring insurance claims, customer satisfaction, and policy renewals to optimize your team’s performance.
👨👩👧👦 Customer Service Teams
With this dashboard, customer service teams can track key metrics that directly affect customer satisfaction, ensuring a high-quality service experience.
Click here to read the Detailed blog post
Watch the step-by-step video Demo:


Reviews
There are no reviews yet.