
Running a golf course efficiently requires clear visibility into key performance metrics such as rounds played, revenue streams, customer satisfaction, and operational efficiency. The Golf Course KPI Dashboard in Google Sheets is a ready-to-use, interactive template that consolidates all essential KPIs into one central hub, empowering managers to make data-driven decisions and optimize operations.
With its easy-to-use design, this dashboard provides Month-to-Date (MTD) and Year-to-Date (YTD) insights, year-over-year comparisons, and customizable KPIs tailored to your golf course operations. Collaborative and accessible from anywhere, it’s the perfect solution for golf course managers, club executives, and operations teams.
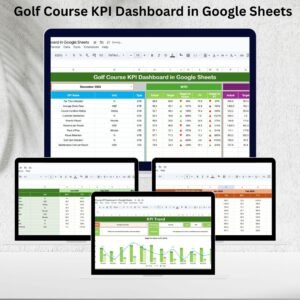
🔑 Key Features of the Golf Course KPI Dashboard
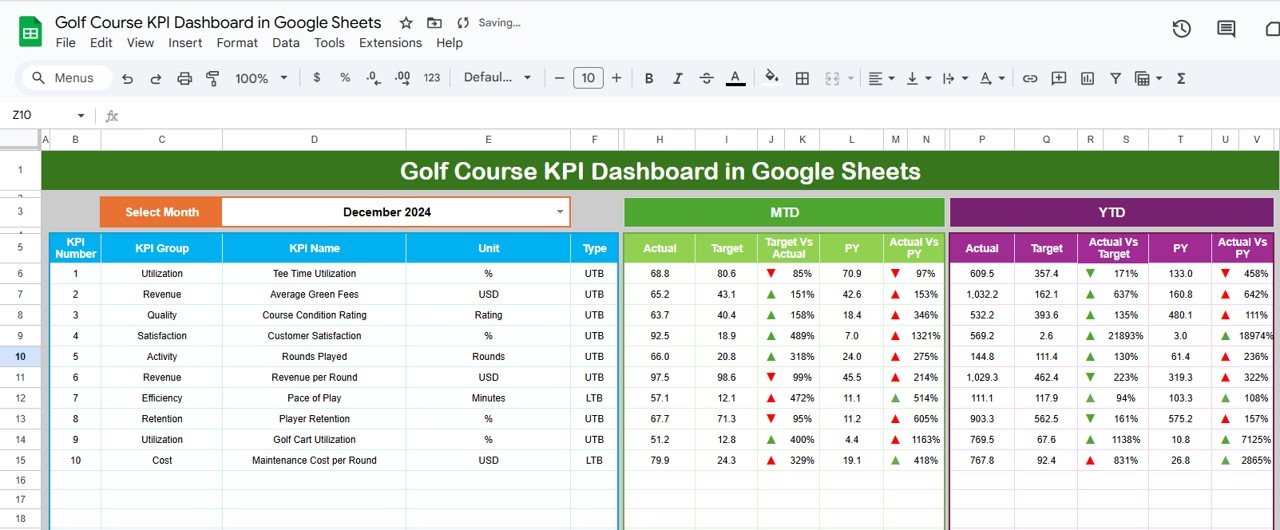
📋 Dashboard Sheet Tab
-
Month selector to view data dynamically
-
KPI cards with Actual vs Target vs Previous Year comparisons
-
MTD and YTD metrics with up/down arrows for performance indicators
-
Quick snapshot of golf course performance in one view
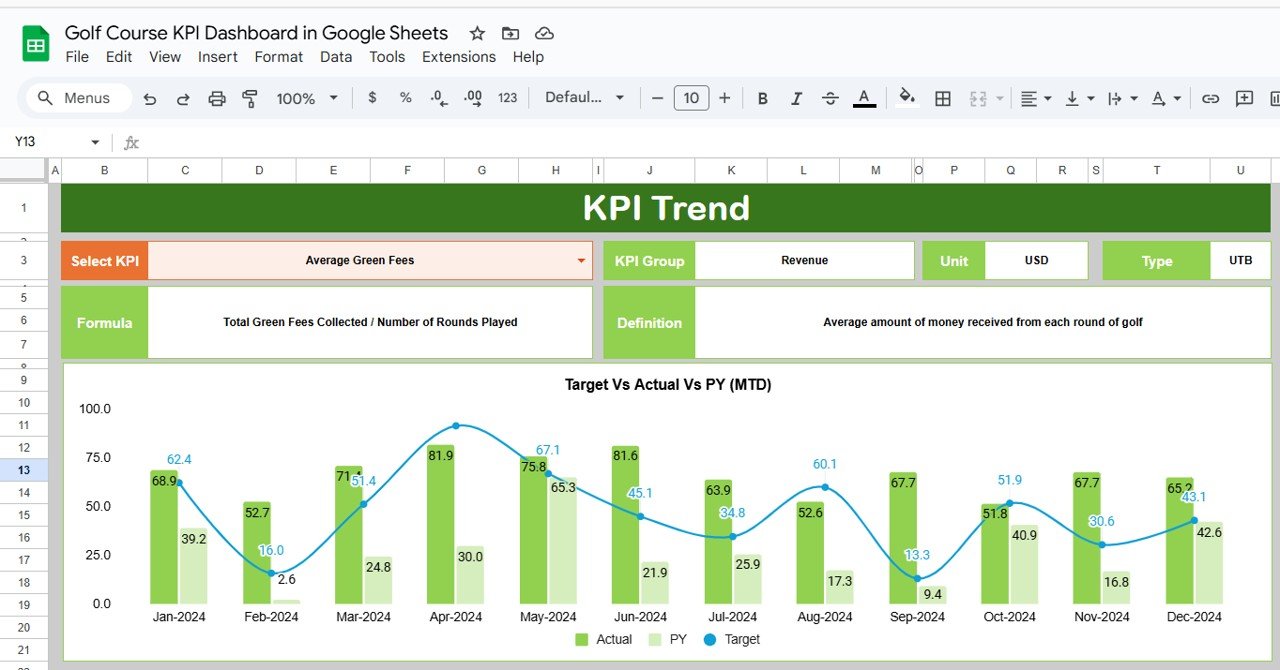
📊 KPI Trend Sheet
-
Select a KPI from a dropdown menu for detailed analysis
-
Displays KPI Group, Unit, Formula, and Type (UTB/LTB)
-
Trend charts for monthly performance tracking
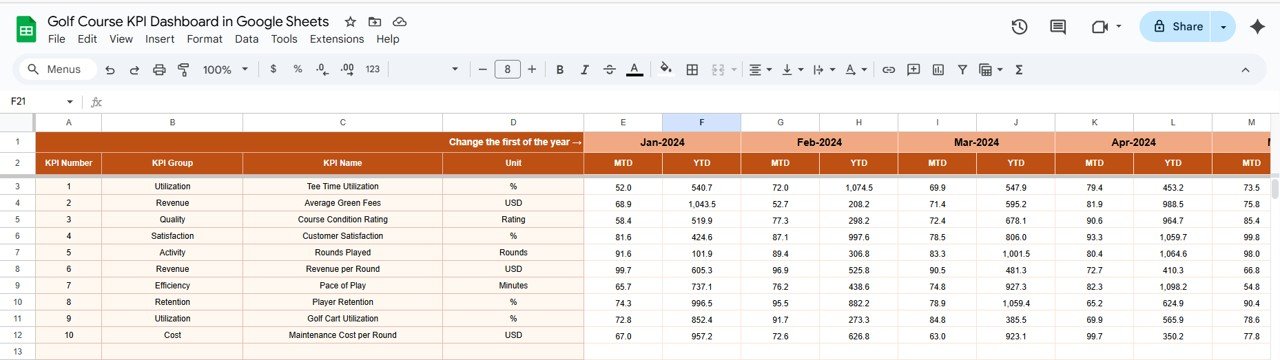
🧾 Actual Numbers Sheet
-
Enter monthly and yearly actuals for each KPI
-
Real-time calculations update across the dashboard
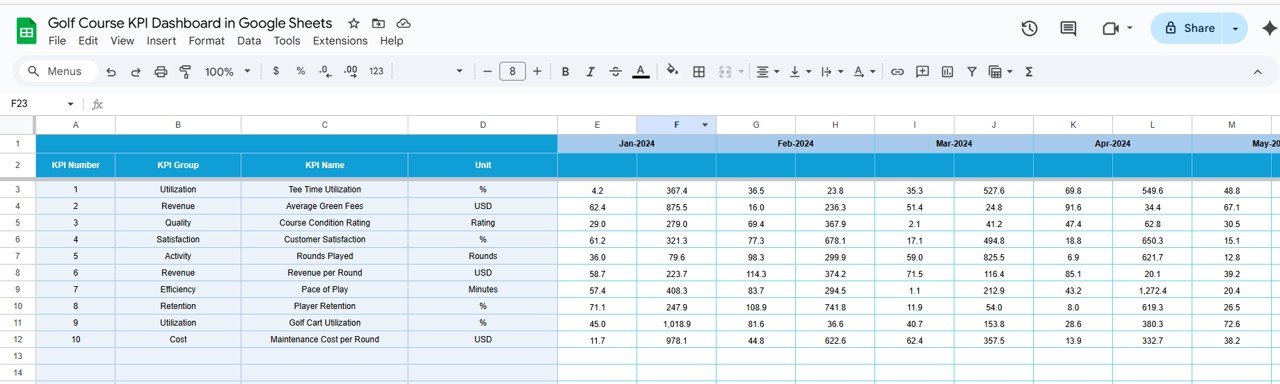
🎯 Target Sheet
-
Record monthly and yearly target values
-
Compare planned vs actual results instantly
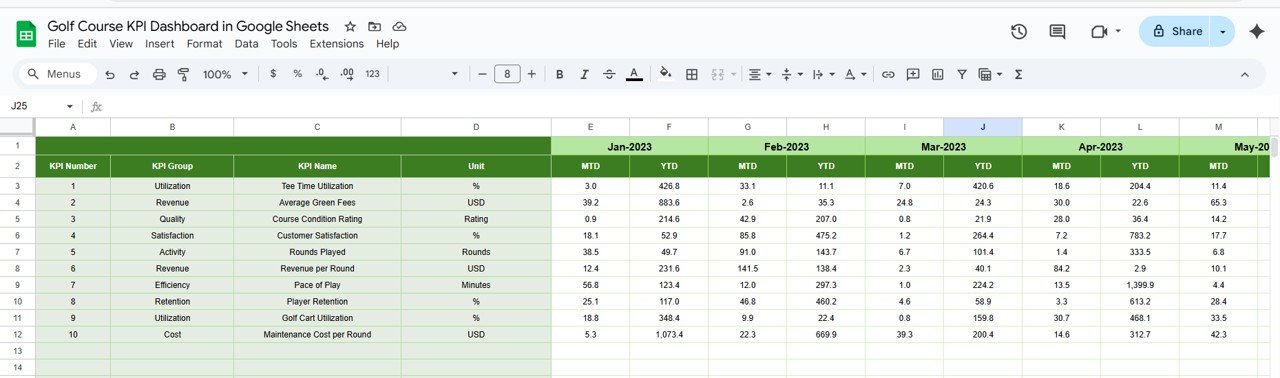
📅 Previous Year Numbers Sheet
-
Input past data for year-over-year comparison
-
Identify performance improvements or declines
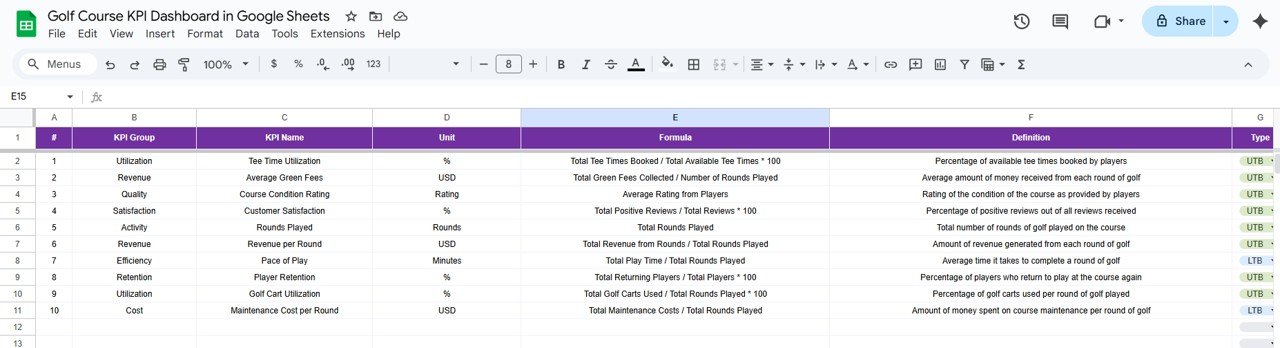
📖 KPI Definition Sheet
-
Clear documentation of KPI names, formulas, units, and definitions
-
Ensures alignment and accuracy across reporting
⛳ Examples of KPIs to Track
-
Rounds Played (UTB)
-
Revenue from Green Fees & Memberships (UTB)
-
Average Customer Satisfaction Score (UTB)
-
Course Maintenance Cost per Round (LTB)
-
On-Time Tee Times % (UTB)
-
Food & Beverage Revenue (UTB)
-
Membership Retention Rate (UTB)
Each KPI includes unit of measurement, definition, and performance type for clarity.
📦 What’s Inside the Golf Course KPI Dashboard?
✅ Dashboard Tab – KPI overview with comparisons and visual indicators
✅ KPI Trend Tab – Track performance across months
✅ Actual Numbers Tab – Record data for MTD & YTD reporting
✅ Target Tab – Define your operational and financial goals
✅ Previous Year Data Tab – Year-over-year trend analysis
✅ KPI Definition Tab – Keep KPI documentation consistent
✅ Pre-Filled Sample Data – Start analyzing immediately
All elements are fully customizable, so you can adapt the dashboard to your specific operations.
🧑💼 Who Can Benefit from This Dashboard?
🎯 Golf Course Managers – Monitor operations, staffing, and customer experience
🎯 Club Executives – Gain financial and performance insights at a glance
🎯 Operations Teams – Track efficiency and identify bottlenecks
🎯 Membership Managers – Evaluate member engagement and retention metrics
🎯 Hospitality & F&B Managers – Analyze revenue from food and beverage services
🧪 How to Use the Golf Course KPI Dashboard
-
Input Data – Add monthly figures into the Actual Numbers sheet
-
Set Targets – Record performance goals in the Target sheet
-
Review Dashboard – Track MTD and YTD KPIs against targets
-
Analyze Trends – Use the KPI Trend sheet for performance evaluation
-
Compare with Last Year – Input historical data to track growth
-
Adjust Strategy – Make data-driven decisions for revenue and efficiency
🌟 Why Choose This Dashboard?
-
Centralized KPI monitoring
-
Instant visual comparisons of Actual vs Target vs Previous Year
-
Real-time performance tracking in Google Sheets
-
Trend analysis for long-term planning
-
Fully customizable metrics for golf operations
-
Collaborative and accessible from anywhere
With the Golf Course KPI Dashboard in Google Sheets, managers can boost revenue, improve customer satisfaction, and optimize operations, all while keeping performance tracking simple and transparent.


Reviews
There are no reviews yet.