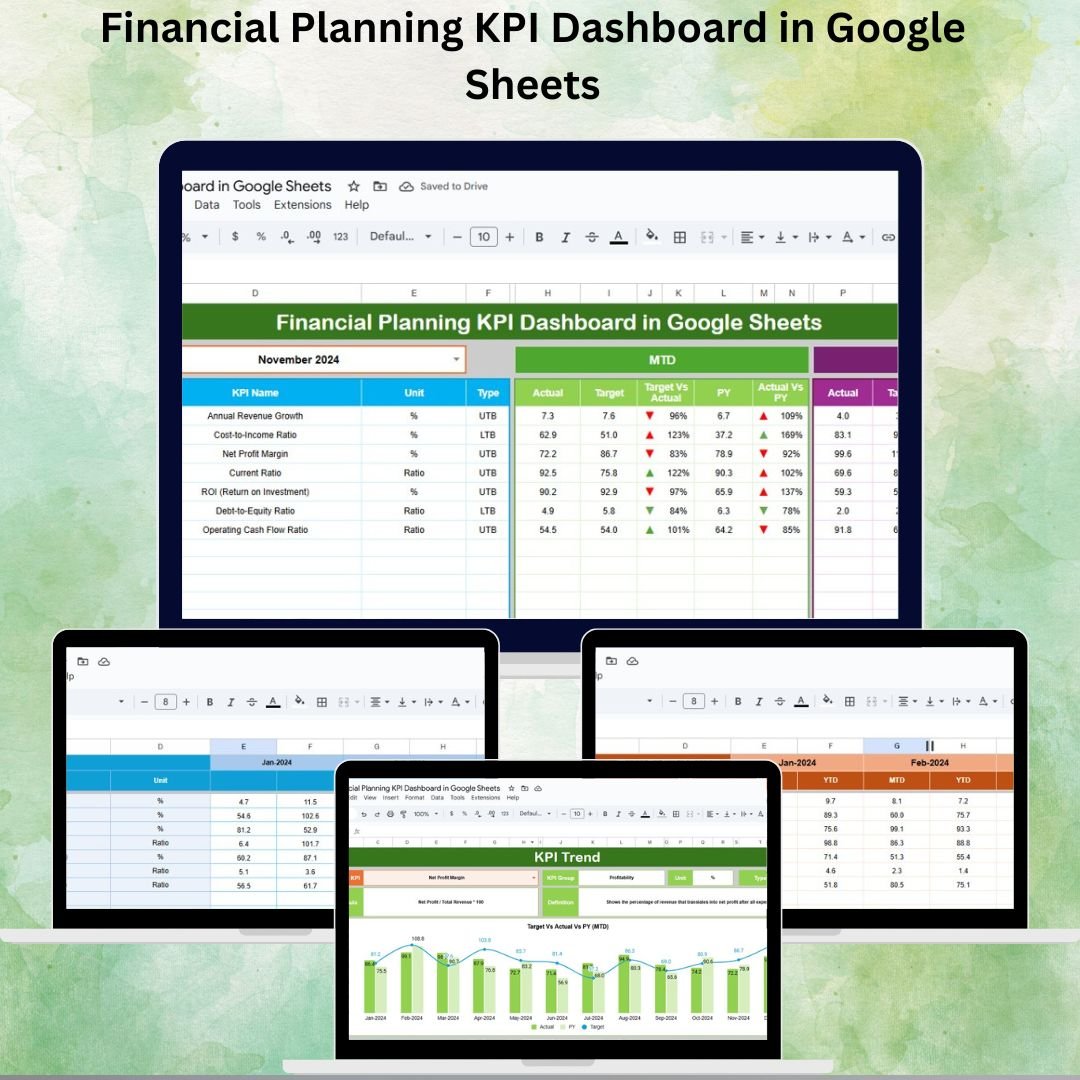
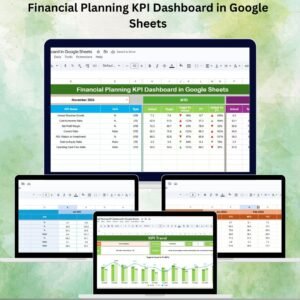
Managing finances effectively is a cornerstone of business success. Without clear insights into key financial metrics, organizations risk overspending, missed targets, and poor decision-making. The Financial Planning KPI Dashboard in Google Sheets is a ready-to-use, interactive solution designed to give finance teams, managers, and decision-makers full visibility over financial performance.
This dashboard consolidates Month-to-Date (MTD), Year-to-Date (YTD), targets, and previous year data into one easy-to-navigate tool. With real-time updates, automated calculations, and intuitive visuals, it ensures businesses stay informed and agile in managing their financial health.
🔑 Key Features of Financial Planning KPI Dashboard
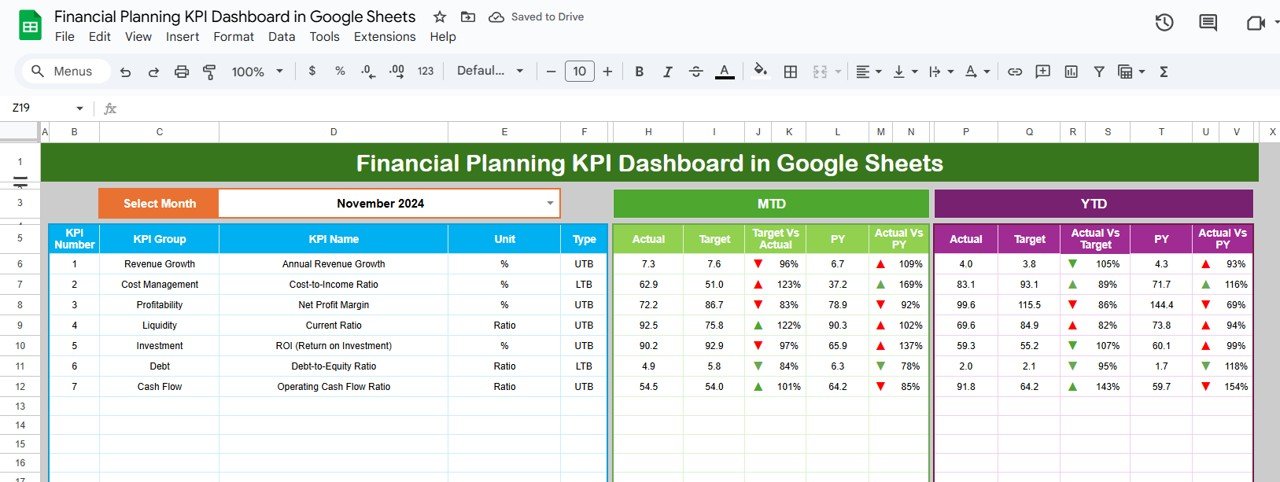
📊 Dashboard Sheet Tab
-
Main interface showing all KPIs at a glance.
-
Select a month (cell D3) to auto-update the entire dashboard.
-
Displays MTD Actual, Target, and Previous Year data with up/down arrows for trend analysis.
-
YTD insights with conditional formatting indicators.
-
Dynamic charts and progress visuals for instant clarity.
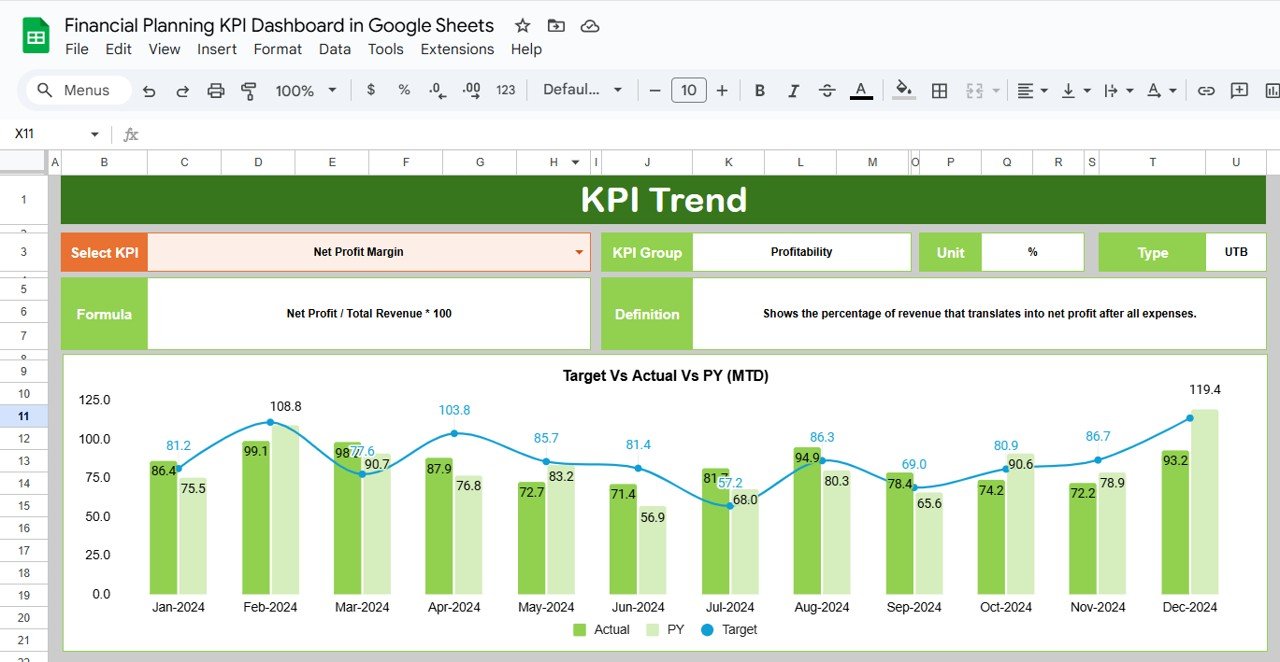
📈 KPI Trend Sheet Tab
-
Select a KPI (cell C3) for a detailed breakdown.
-
Includes KPI Group, Unit, Type (Lower the Better / Upper the Better), Formula, and Definition.
-
Helps users understand calculations and purpose for consistent tracking.
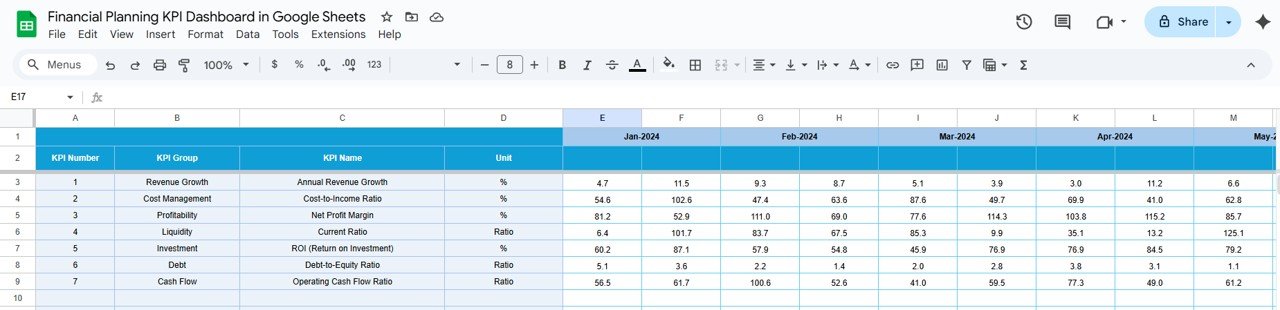
🧾 Actual Number Sheet Tab
-
Input monthly and yearly actual numbers.
-
Enter starting month (cell E1) to auto-update totals.
-
Ensures a single source of truth for all financial data.
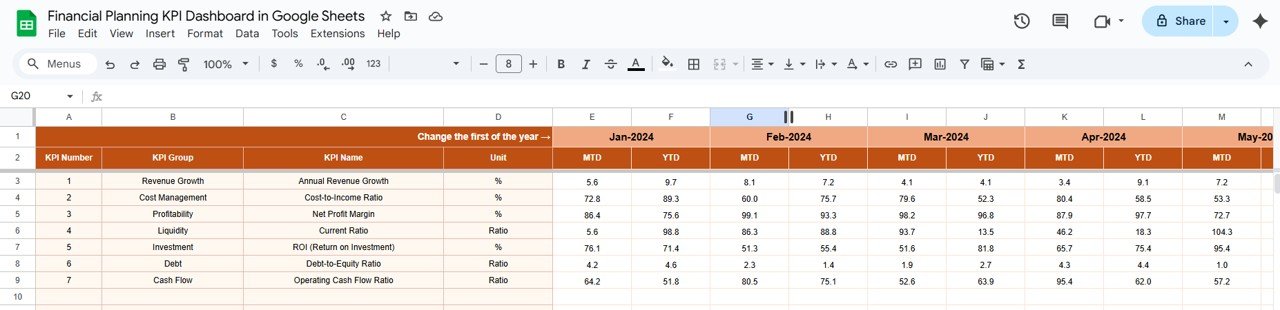
🎯 Target Sheet Tab
-
Enter planned MTD and YTD targets.
-
Provides benchmarks for measuring financial success.
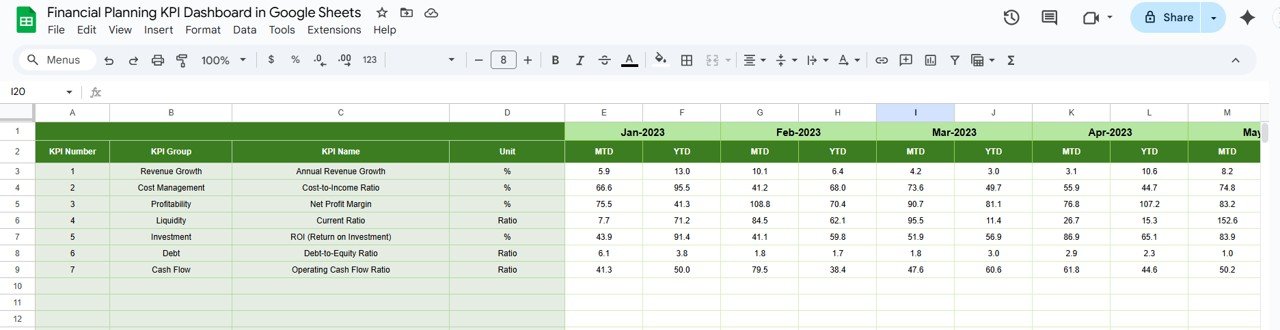
📉 Previous Year Numbers Sheet Tab
-
Stores historical data for year-over-year comparisons.
-
Track growth patterns and identify recurring issues.
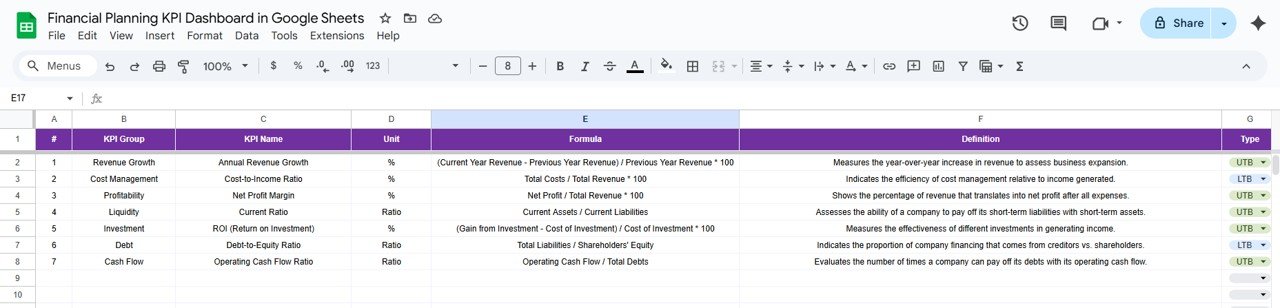
📑 KPI Definition Sheet Tab
-
Master list of all KPIs with names, groups, formulas, and definitions.
-
Ensures clarity, standardization, and transparency across all users.
📦 What’s Inside the Dashboard
✅ 6 Structured Worksheets – Dashboard, KPI Trend, Actual Numbers, Targets, Previous Year, KPI Definitions
✅ Automated KPI Calculations – MTD, YTD, and PY comparisons
✅ Dynamic Visuals – Charts, conditional arrows, and progress indicators
✅ Customizable KPIs – Add, remove, or adjust KPIs as needed
✅ Cloud-Based Collaboration – Share in real time with Google Sheets
✅ User-Friendly Design – No coding or advanced knowledge required
👥 Who Can Benefit from This Dashboard?
💼 Finance Managers & CFOs – Get clear visibility of organizational financial health.
📊 Project Managers – Track budgets, expenditures, and performance targets.
🏢 Business Owners – Monitor profitability and growth at a glance.
👥 Finance Teams – Collaborate on real-time data for accuracy and compliance.
This dashboard is ideal for businesses of all sizes looking to improve transparency, efficiency, and decision-making in financial planning.
📋 Best Practices for Using the Dashboard
-
🔄 Update Data Regularly – Keep MTD/YTD numbers current.
-
🎯 Set Realistic Targets – Align goals with capacity and market conditions.
-
📊 Review Monthly Trends – Use arrows to quickly spot underperformance.
-
📘 Document KPI Formulas – Maintain transparency for audits and training.
-
👥 Collaborate in Real Time – Share with finance and management teams.
✅ Advantages of Financial Planning KPI Dashboard
-
Centralized Data – All financial KPIs in one sheet.
-
Real-Time Updates – Monthly selection updates dashboard instantly.
-
Comparative Insights – MTD vs YTD and PY vs Actual comparisons.
-
Customizable – Adapt KPIs to match business objectives.
-
Affordable & Accessible – Built in Google Sheets, no expensive software needed.
-
Decision Support – Data-driven insights improve financial strategies.
🔗 Click here to read the Detailed blog post
Watch the step-by-step video Demo:


Reviews
There are no reviews yet.