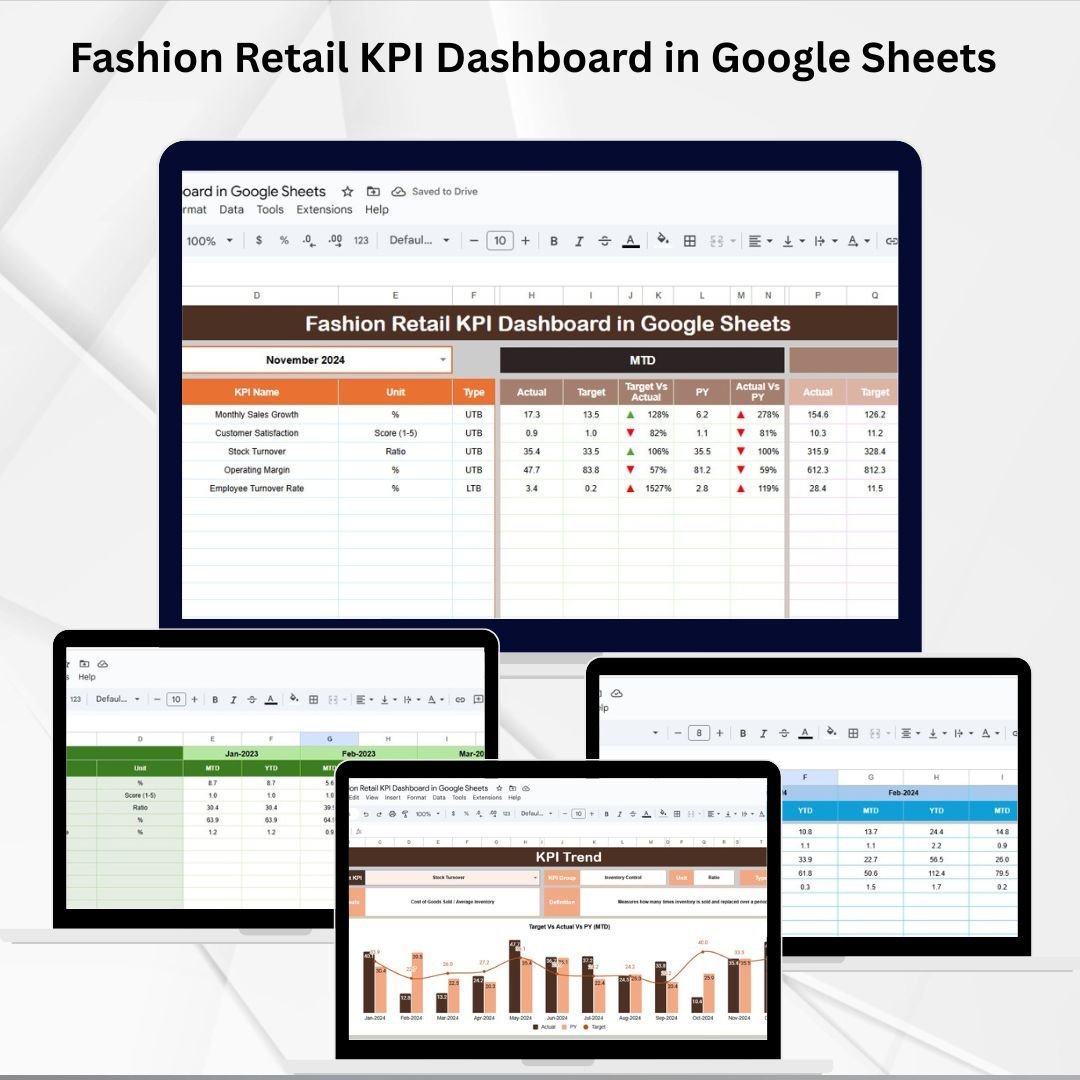
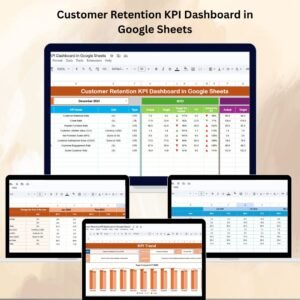
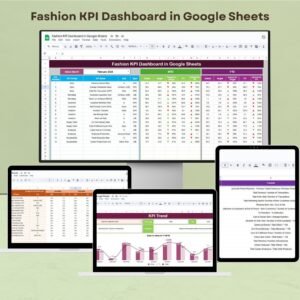
In the highly competitive world of fashion retail, success depends on how effectively you monitor your store’s performance. Sales numbers, customer footfall, stock turnover, and return rates can’t just sit in scattered spreadsheets — they need to be visualized and analyzed in one place. That’s exactly what the Fashion Retail KPI Dashboard in Google Sheets delivers. 🎯
This ready-to-use dashboard helps managers, analysts, and business owners track Month-to-Date (MTD) and Year-to-Date (YTD) KPIs, compare results with targets, and measure progress against the previous year. With interactive charts, dropdowns, and pre-built calculations, it transforms raw data into actionable insights. 📊✨
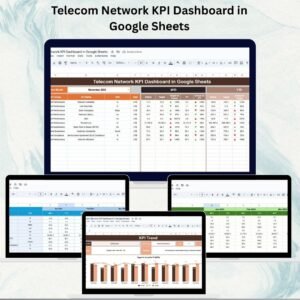
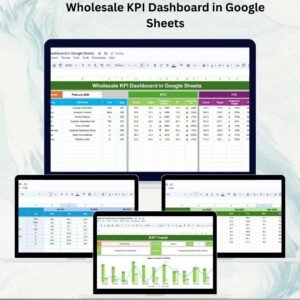
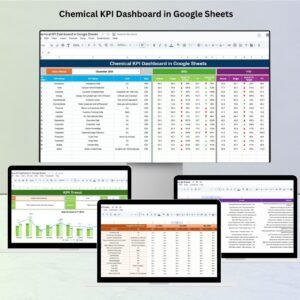
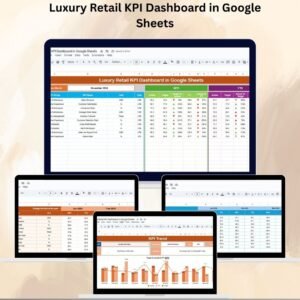
🔑 Key Features of Fashion Retail KPI Dashboard in Google Sheets
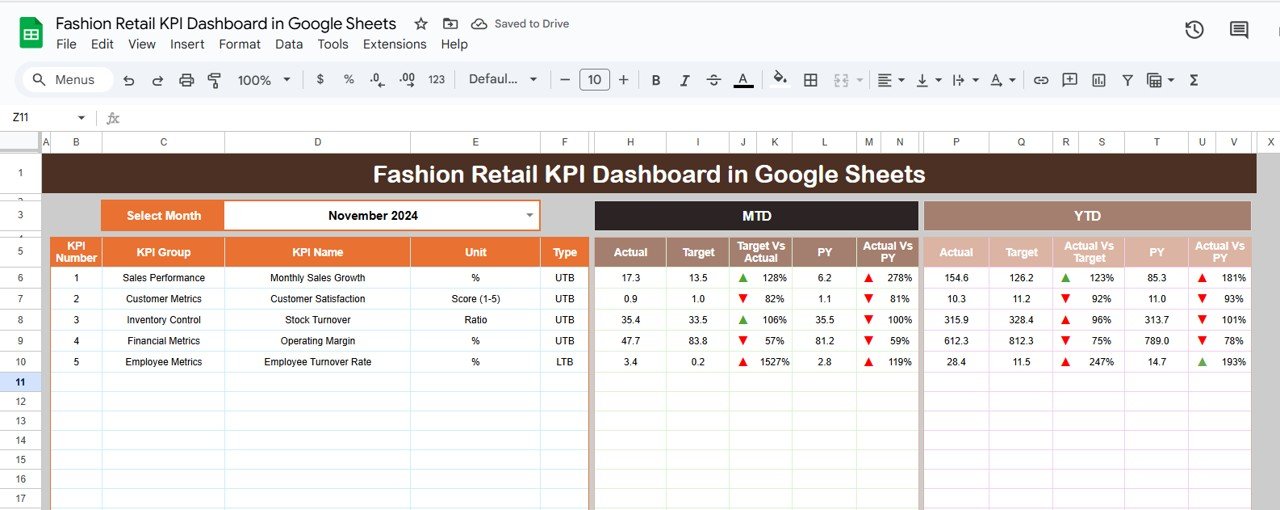
📋 Dashboard Sheet (Main Page)
-
Central hub with all KPIs in one place.
-
Month selection dropdown updates MTD and YTD metrics instantly.
-
Conditional formatting with green/red arrows shows if KPIs are on track.
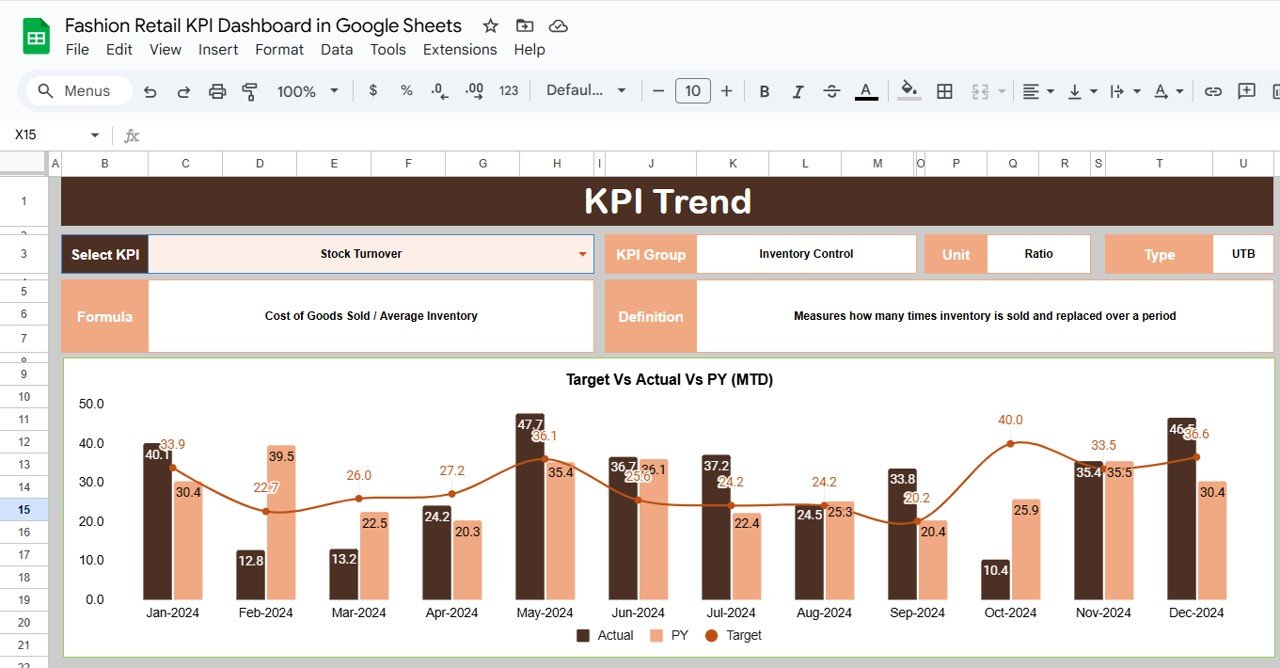
📈 KPI Trend Sheet
-
Select a KPI from the dropdown to view detailed trends.
-
Displays KPI Group, Unit, Type (LTB/UTB), Formula, and Definition.
-
Visual trend charts for performance tracking.
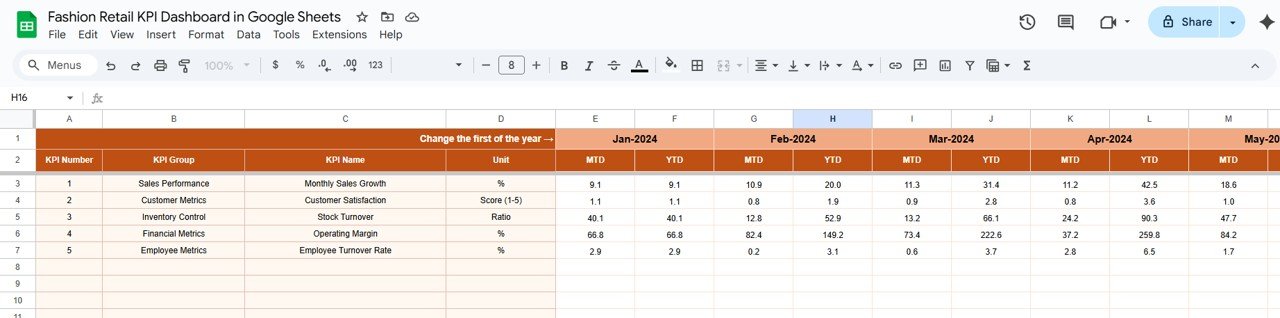
🧾 Actual Number Sheet
-
Enter actual monthly KPI values.
-
Automatically feeds into dashboard for instant insights.
🎯 Target Sheet
-
Define monthly and yearly targets.
-
Compare target vs. actual performance side by side.
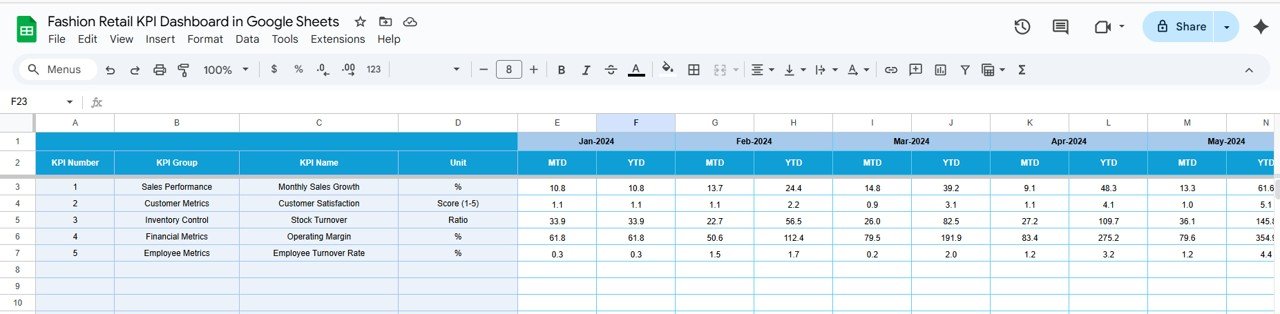
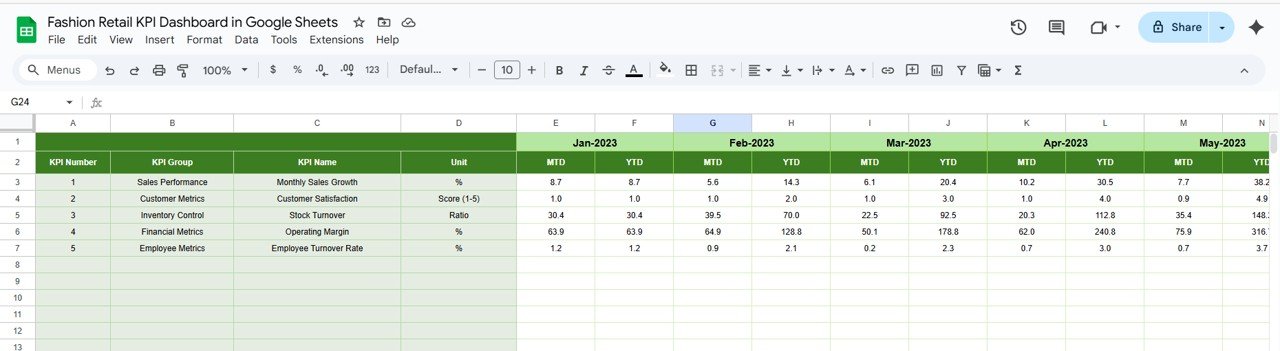
📊 Previous Year Number Sheet
-
Store last year’s data for historical comparisons.
-
Measure growth and identify long-term trends.
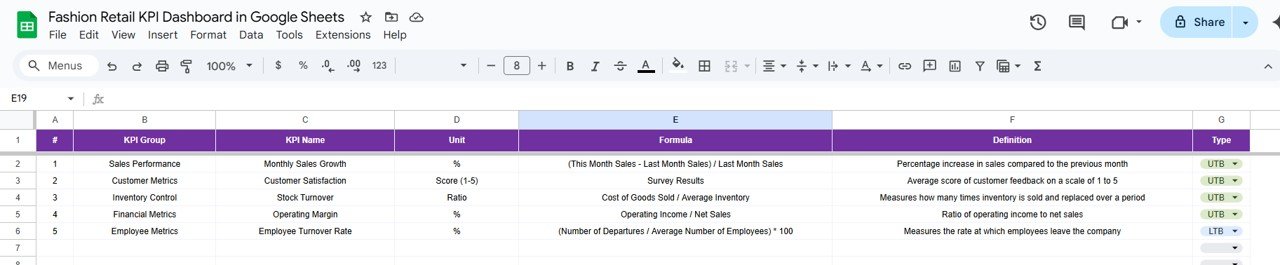
📘 KPI Definition Sheet
-
Clear documentation of KPIs: Name, Group, Unit, Formula, Definition, Type.
-
Ensures clarity and consistency across the dashboard.
📦 What’s Inside the Dashboard?
When you download this Google Sheets dashboard, you’ll get:
✅ A fully interactive dashboard with dropdowns and visual indicators
✅ Pre-built trend charts and conditional formatting
✅ Structured tabs for Actual, Target, and Previous Year data
✅ A complete KPI Definition library
✅ Ready-to-use formulas and formatting — no coding required
Everything is designed for plug-and-play use, so you can start tracking performance right away. 🚀
🧑💼 Who Can Benefit from This Dashboard?
👕 Fashion Retail Managers – Monitor store-level KPIs in real time
📈 Business Analysts – Identify underperforming metrics and trends
👗 Store Owners – Stay on top of sales, margins, and customer engagement
💡 Decision Makers – Use insights to plan promotions, staffing, and inventory
🏬 Multi-Store Chains – Customize to track performance across multiple locations
🧠 How to Use the Fashion Retail KPI Dashboard
-
Open the Actual Number Sheet and input monthly performance data.
-
Update Target Sheet and Previous Year Sheet for accurate comparisons.
-
Select a month in the Dashboard Sheet to see MTD and YTD performance.
-
Use the KPI Trend Sheet to drill down into specific metrics.
-
Review arrows and charts to quickly spot strengths and bottlenecks.
It’s that simple. With Google Sheets’ cloud-based features, you can also share the dashboard with your team for collaborative decision-making. 🌍
🔗 Click here to read the Detailed blog post
Watch the step-by-step video Demo:


Reviews
There are no reviews yet.