


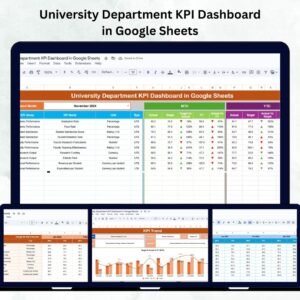
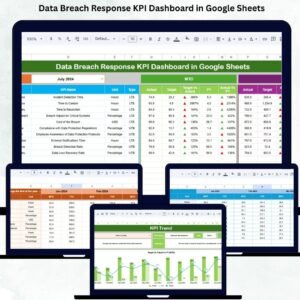
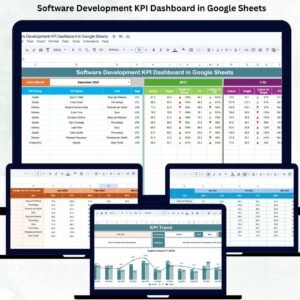
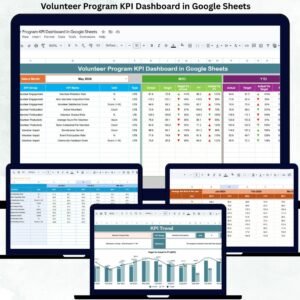
The Event Management KPI Dashboard in Google Sheets is a powerful tool designed for event planners and organizers to monitor, analyze, and optimize key performance indicators (KPIs) across all stages of event management. This customizable dashboard allows users to track various aspects such as attendee engagement, budget management, vendor performance, and overall event success, all within an easy-to-use Google Sheets template.

Key Features of the Event Management KPI Dashboard in Google Sheets
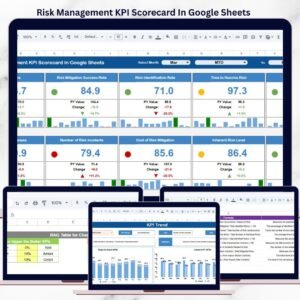
📊 Comprehensive KPI Tracking
-
Monitor Key Metrics: Track KPIs such as attendee satisfaction, registration rates, budget vs. actual expenses, vendor performance, and post-event feedback.
-
Real-Time Data Updates: Keep the dashboard up-to-date with live data, ensuring that event performance metrics are accurate at all times.
📈 Customizable Dashboard
-
Tailored to Your Event Needs: Customize the dashboard to track the specific KPIs that are most important for your events.
-
Visual Analytics: Use charts and graphs to easily visualize trends, identify areas of improvement, and assess the impact of your event strategies.
🔧 Easy Integration
-
Data Import: Seamlessly integrate data from external sources to provide a complete view of event performance.
-
Manage Multiple Events: Track multiple events at once, making it easier to compare and evaluate them over time.
📅 User-Friendly Interface
-
Intuitive Design: The dashboard is easy to navigate, allowing you to quickly input data and analyze results with minimal training required.
-
Time-Saving Setup: Save time on reporting and data analysis with built-in functions and automated tracking.
Benefits of Using the Event Management KPI Dashboard
✅ Data-Driven Decision Making
Access to real-time insights enables event planners to make informed decisions based on key performance metrics.
✅ Improved Event Planning
By analyzing KPIs, you can optimize your event strategies, improving attendee satisfaction, vendor coordination, and budget management.
✅ Cost Efficiency
Track budget spending and vendor performance to ensure your event stays within financial constraints while achieving the desired outcomes.
✅ Enhanced Stakeholder Satisfaction
Monitor attendee engagement and feedback to ensure your event meets or exceeds the expectations of all stakeholders.
How to Use the Event Management KPI Dashboard in Google Sheets
-
Download the Template: Download the Event Management KPI Dashboard template and save it to your Google Drive for easy access.
-
Input Data: Enter event details such as attendee numbers, budget data, and feedback scores into the dashboard.
-
Customize KPIs: Adjust the dashboard to track the KPIs that are most relevant to your event goals.
-
Track and Analyze: Use the dashboard to monitor event progress, track key metrics, and identify areas for improvement.
-
Make Adjustments: Leverage insights from the dashboard to implement strategies that enhance future event outcomes.
By using the Event Management KPI Dashboard in Google Sheets, you can streamline event planning, track performance more effectively, and make data-driven decisions to maximize event success.
Click here to read the Detailed blog post
Event Management KPI Dashboard in Google Sheets
Visit our YouTube channel to learn step-by-step video tutorials
YouTube.com/@NeotechNavigators


Reviews
There are no reviews yet.