Plan, execute, and measure events with confidence. Whether you’re managing a small seminar, a corporate expo, or a multi-day festival, the Event Planning KPI Dashboard in Google Sheets gives you the power to monitor your entire event lifecycle—all in one place.
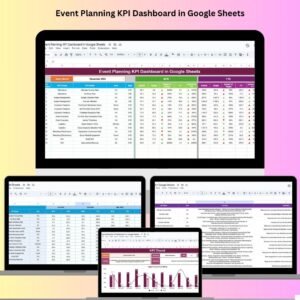
This professionally built Google Sheets template allows you to track budgeting, scheduling, attendance, satisfaction, and vendor logistics—through real-time visuals, auto-updating metrics, and interactive charts.
No more juggling spreadsheets or manual reports. Just input your data into structured sheets, and watch your dashboard bring everything to life. Perfect for event planners, coordinators, and project teams, this tool is fully editable and designed to save you time while improving event outcomes.
✨ Key Features of the Event Planning KPI Dashboard
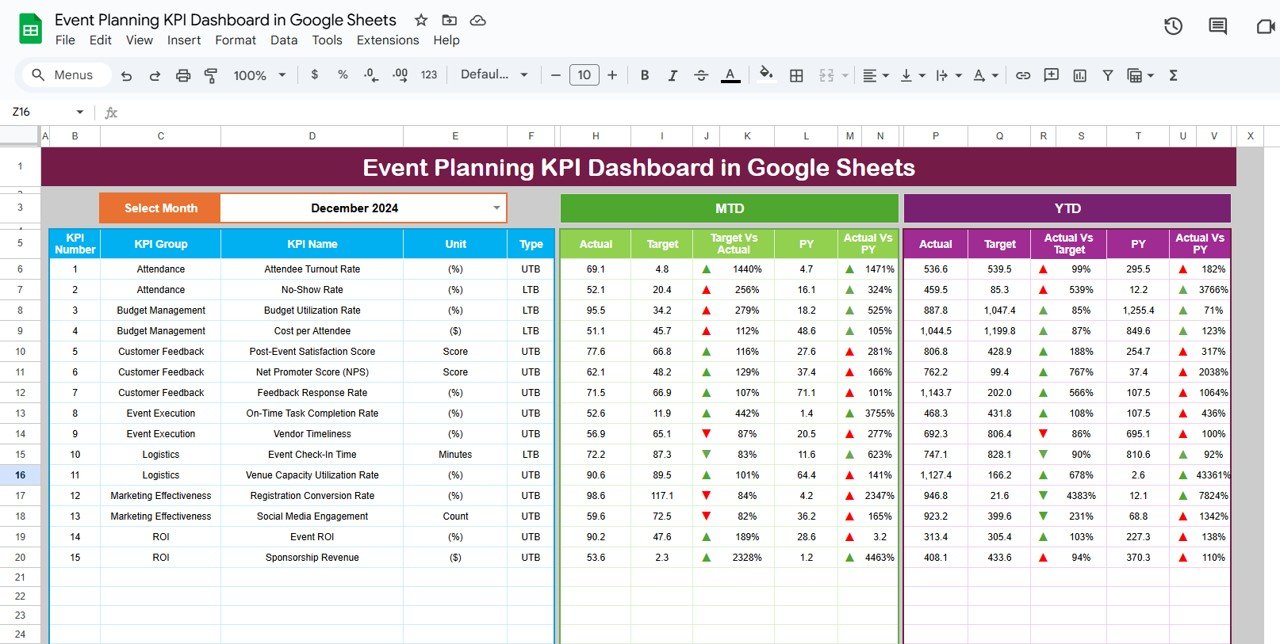
📊 Centralized KPI Dashboard
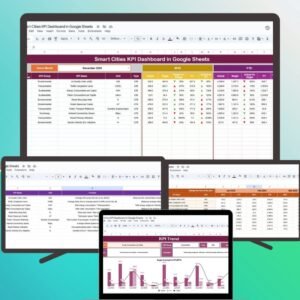
Monitor MTD/YTD performance, targets, and previous year comparisons with automated indicators. Arrows show whether you’re on track, over budget, or exceeding expectations.
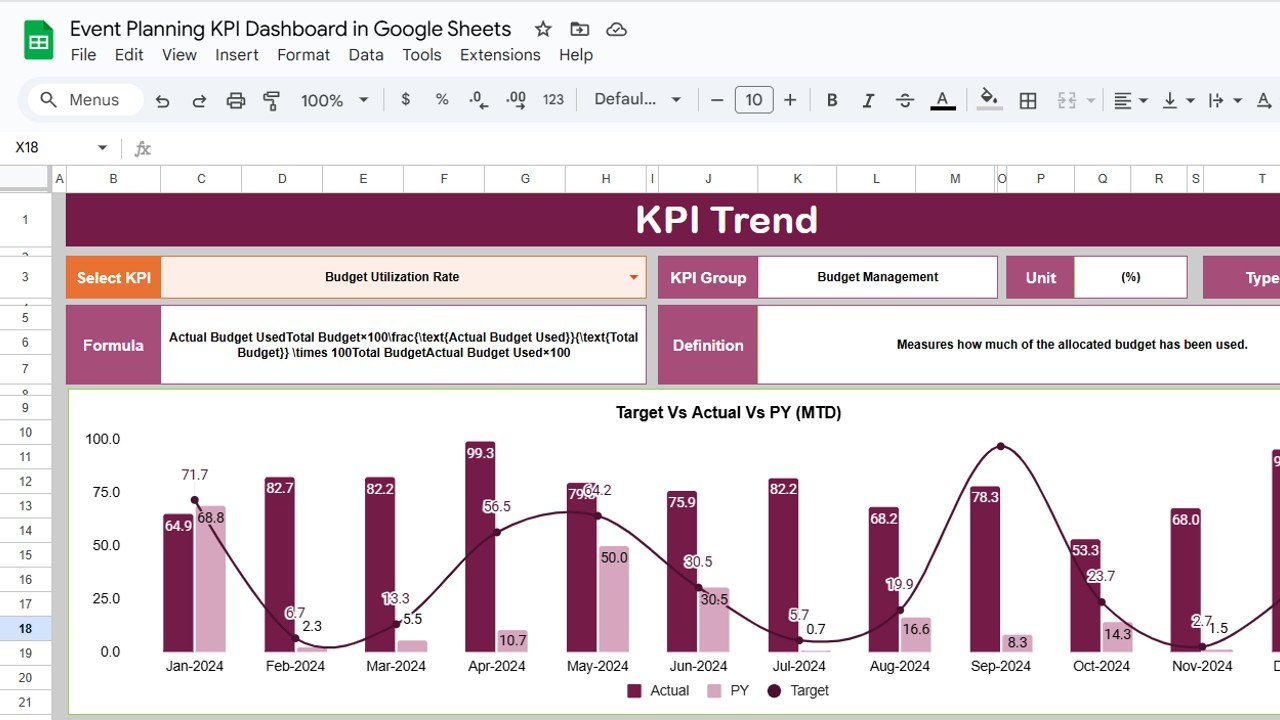
📈 KPI Trend Analysis
Select any KPI using a drop-down to view historical trends. Charts auto-update for MTD and YTD, so you can quickly identify what’s improving or needs attention.
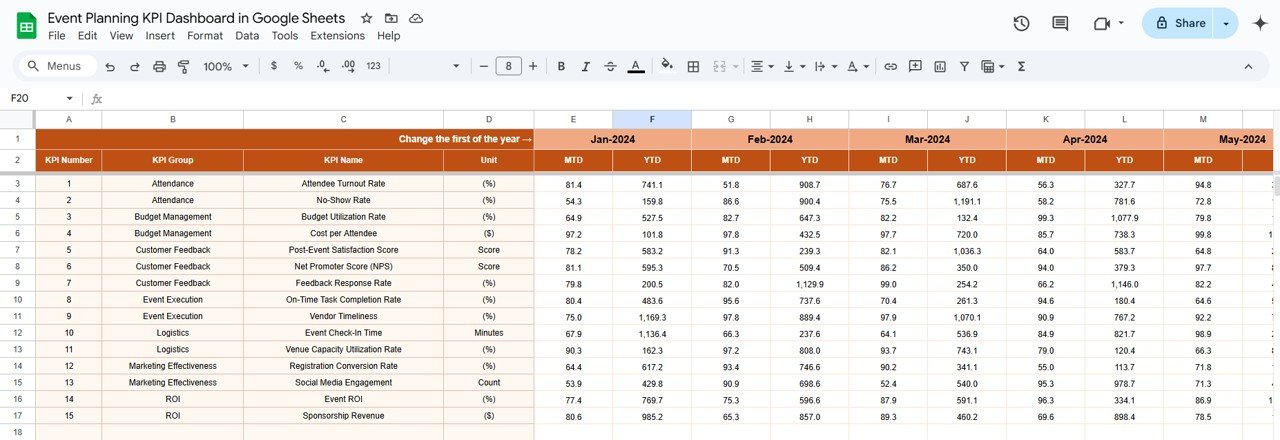
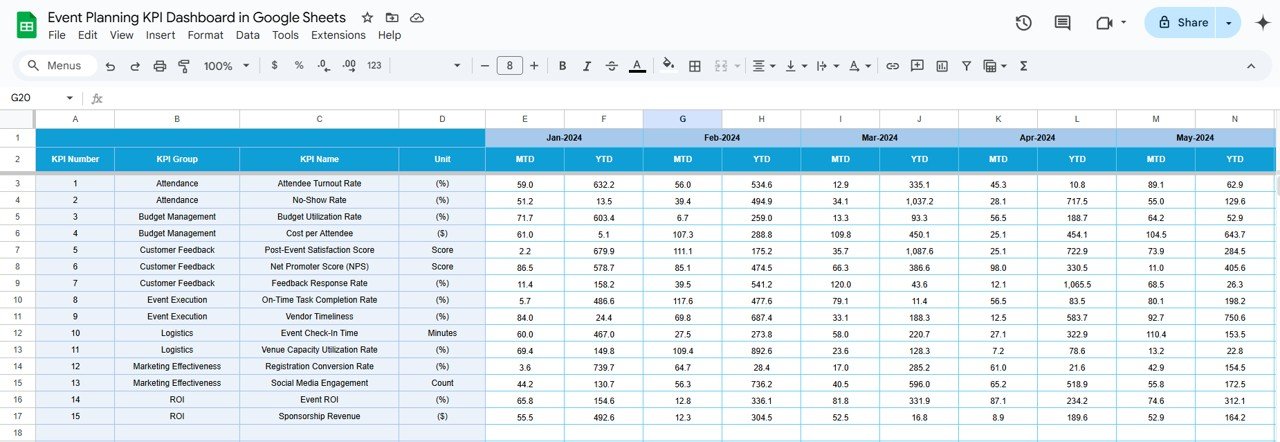
📥 Easy Data Input Sheets
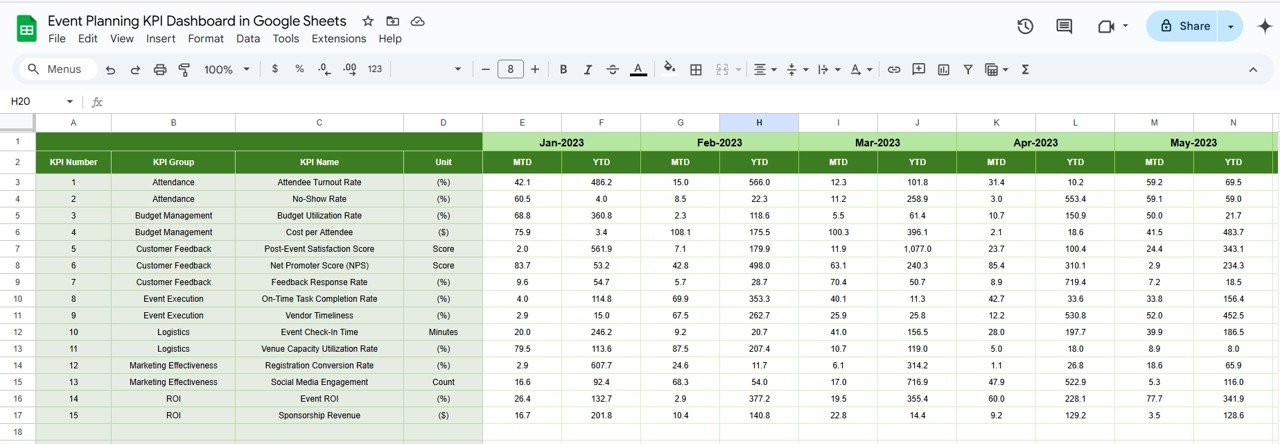
Update your Actuals, Targets, and Previous Year Numbers in dedicated, cleanly structured sheets. No coding or formulas needed—everything is pre-set.
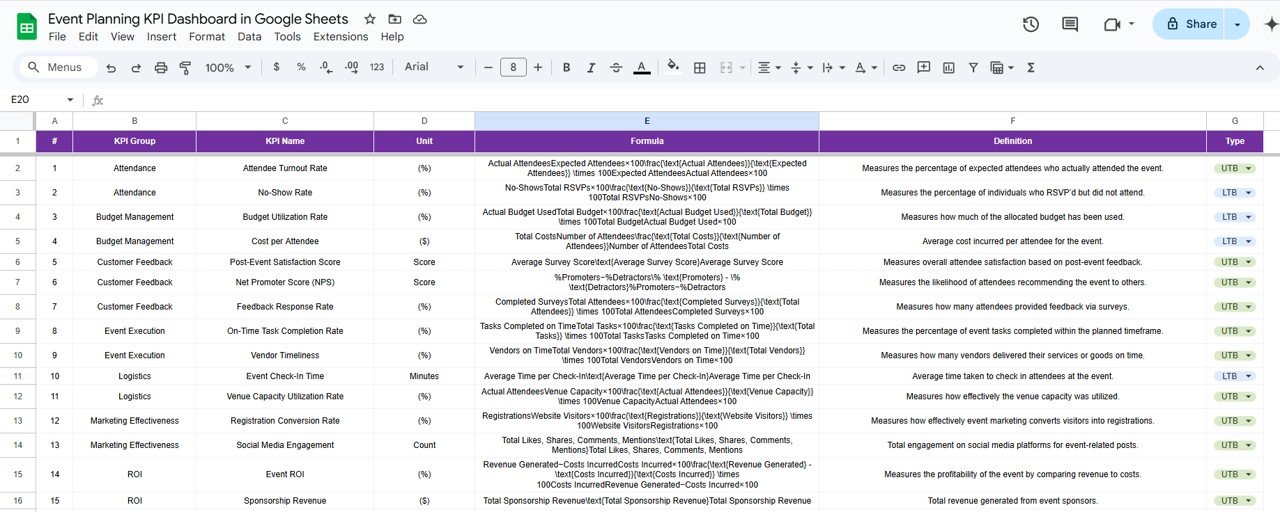
📘 KPI Definition Sheet
Includes KPI Name, Group, Unit, Formula, Type (UTB/LTB), and detailed definitions to ensure clarity across your planning team.
🔁 Year-over-Year Comparison
Analyze how your event KPIs have evolved by comparing with previous year’s data in the visual dashboard.
⚙️ Google Sheets Flexibility
Use it anywhere, collaborate in real-time, and customize it as per your event needs—whether for single or multiple events.
📦 What’s Included in the Template?
Your download includes:
✅ 6 Google Sheets Tabs:
-
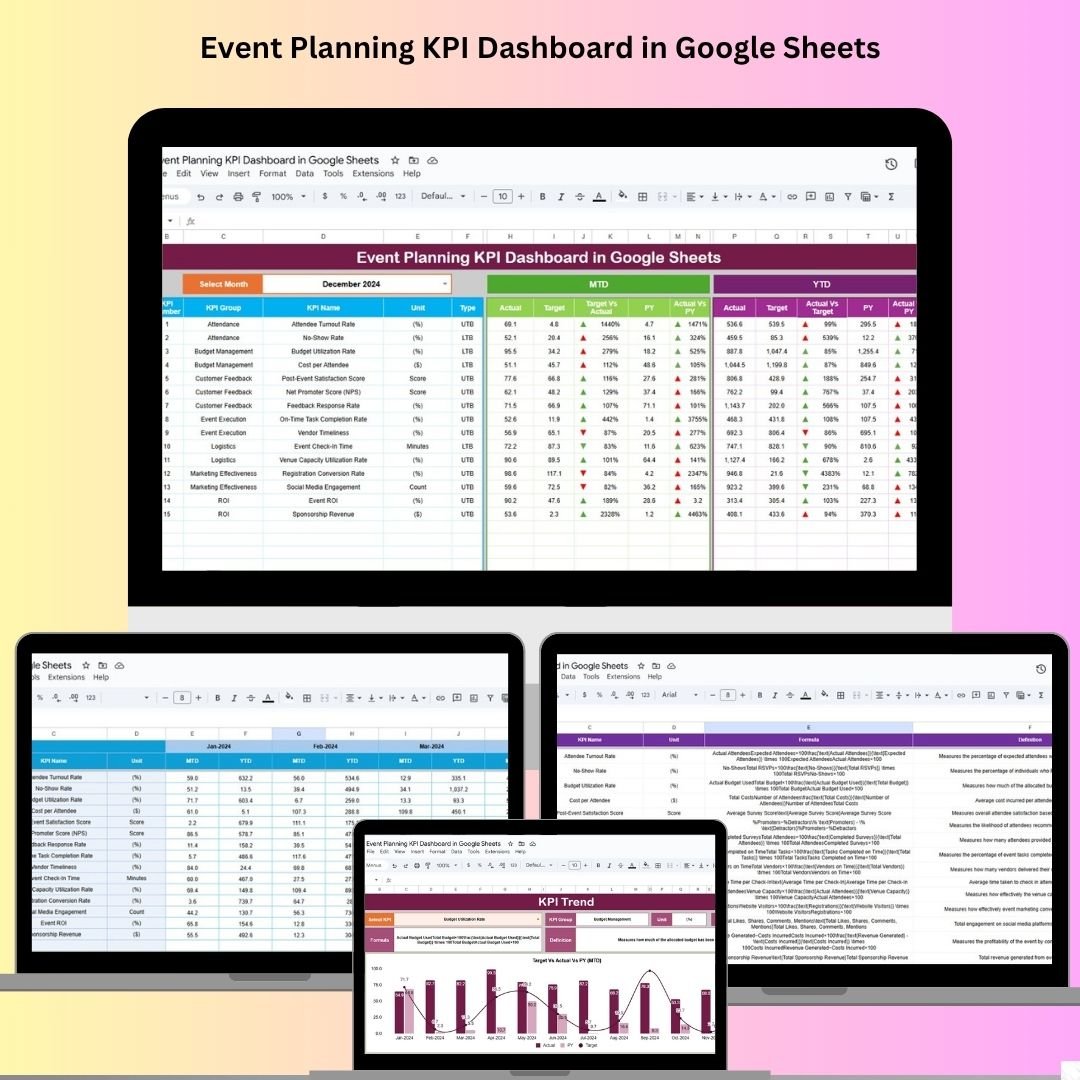
Dashboard Sheet – Overview of all KPIs
-
KPI Trend Sheet – Select KPI to see MTD & YTD line charts
-
Actual Number Sheet – Enter actual KPI numbers monthly
-
Target Sheet – Input KPI goals and targets
-
Previous Year Number Sheet – Store and compare last year’s data
-
KPI Definition Sheet – Complete KPI logic and explanation
✅ Built-in conditional formatting (green/red arrows for easy visual tracking)
✅ Pre-linked charts and metrics that auto-update on every data entry
✅ Fully editable layout and color scheme to match your branding
🧩 Sample KPIs You Can Track
-
Budget Adherence Rate
-
Ticket Sales Revenue
-
Event Attendance Rate
-
Vendor Timeliness Index
-
Sponsorship Conversion Rate
-
Attendee Satisfaction Score
-
On-Site Incident Rate
-
Setup & Logistics Timeliness
-
Post-Event Feedback Score
Each KPI can be set as either UTB (Upper the Better) or LTB (Lower the Better) depending on its objective.
👥 Who Can Use This Dashboard?
🎯 Event Managers & Coordinators – Stay on top of planning timelines, execution, and follow-ups
🏢 Corporate Event Teams – Align KPIs across departments and sponsors
🎤 Conference & Expo Organizers – Track logistics, ticket sales, and audience satisfaction
🎟 Marketing & PR Teams – Evaluate campaign results for event attendance and engagement
🛠 Vendors & Support Teams – Share KPIs across collaborators in real time
🔥 Advantages of This Dashboard
✅ Real-Time Performance Tracking – Always know where you stand
✅ Data-Driven Event Planning – Make strategic adjustments on the go
✅ Easy Collaboration in Google Sheets – Share access with team members effortlessly
✅ Customizable KPIs – Tailor the dashboard for different event types
✅ Visual Trend Analysis – Spot patterns and improve event efficiency over time
🧠 Best Practices for Success
✔️ Update monthly to keep metrics relevant
✔️ Focus on KPIs that matter most to your team and stakeholders
✔️ Use definitions to avoid confusion during cross-functional collaboration
✔️ Review trends to optimize future events
✔️ Leverage visuals for team presentations or stakeholder updates
📖 Click here to read the detailed blog post
Event Planning KPI Dashboard in Google Sheets – Full Guide









Reviews
There are no reviews yet.