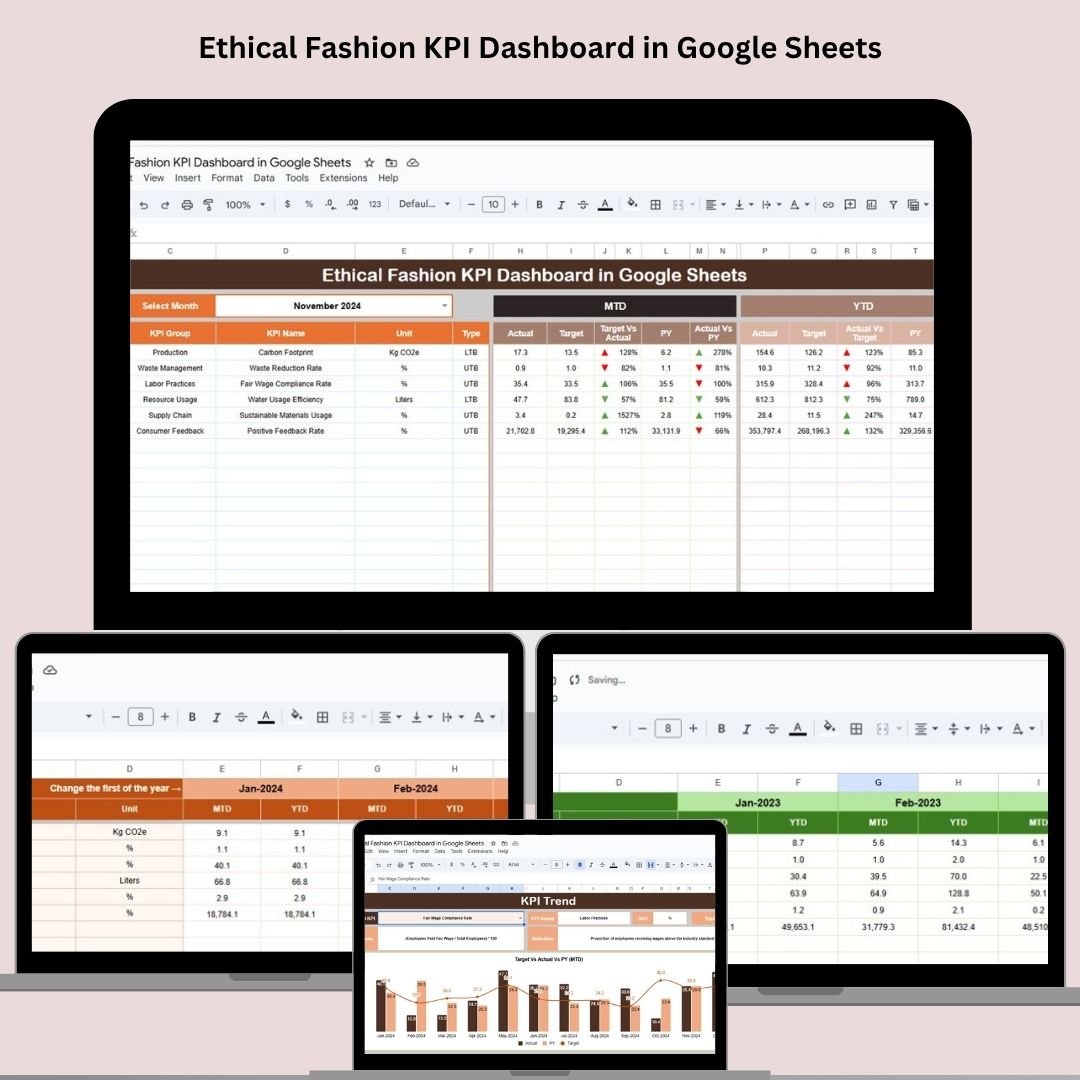
In today’s eco-conscious fashion world, tracking impact matters as much as design. The Ethical Fashion KPI Dashboard in Google Sheets empowers ethical fashion brands to monitor key sustainability metrics—across environmental, social, and economic fronts—in one beautifully organized, data-driven dashboard.
From tracking carbon footprint and fair wages to monitoring material sourcing and waste reduction, this ready-to-use template helps you stay aligned with your sustainability commitments.
📊 Key Features of the Ethical Fashion KPI Dashboard
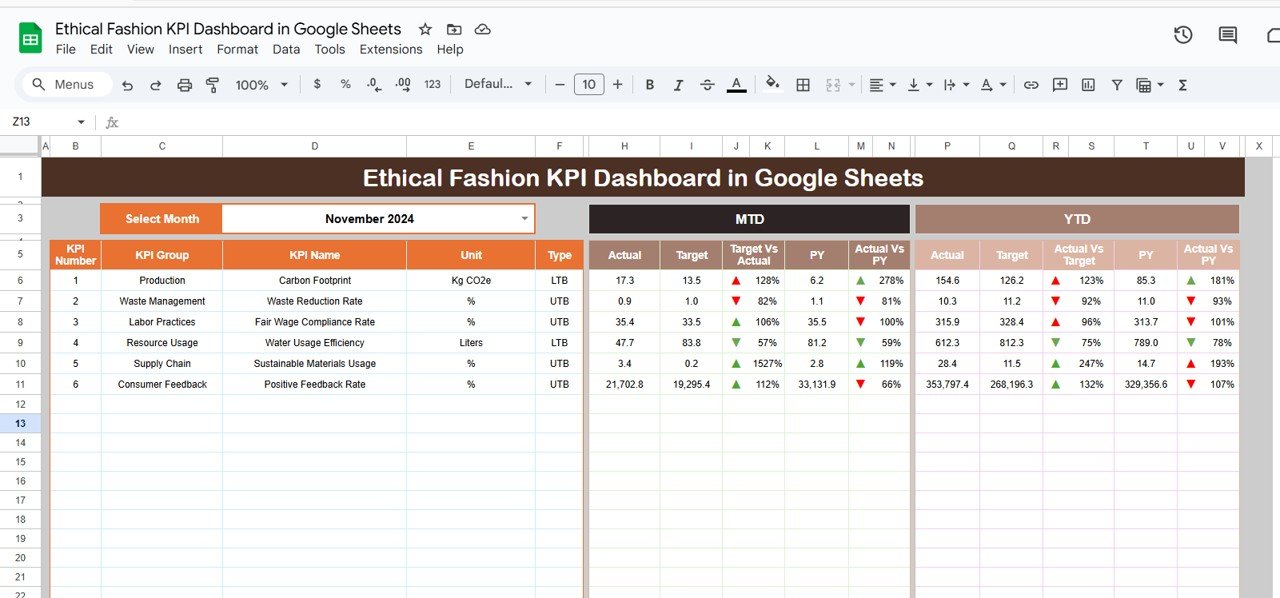
📌 Dashboard Sheet Tab – Your one-screen performance center
-
📅 Month Selector (D3): Choose a month to instantly update dashboard stats
-
📈 MTD & YTD Actuals: Track current and cumulative sustainability performance
-
🎯 Target vs Actual Comparison: Visual arrows indicate goal achievement
-
📆 Previous Year (PY) Comparison: See your progress over time
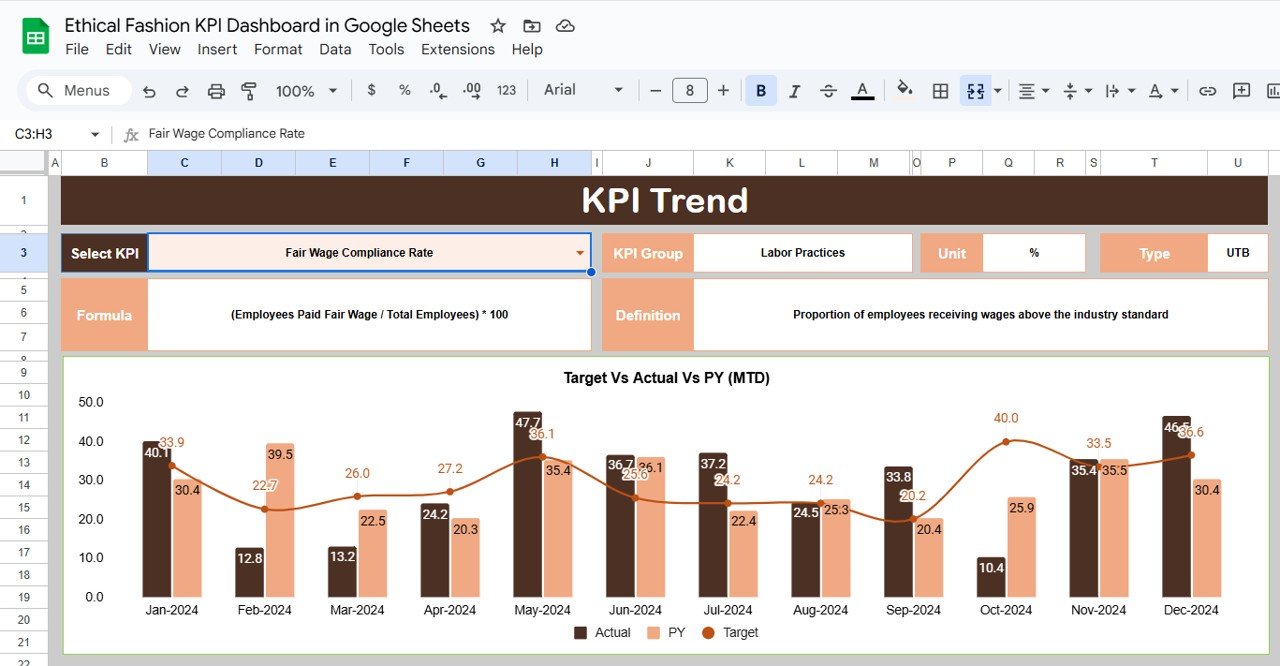
📈 KPI Trend Sheet Tab
-
Select any KPI from the dropdown (C3) and analyze its performance over time
-
View KPI Group, Unit, Type (UTB or LTB), Formula, and Definition for full context
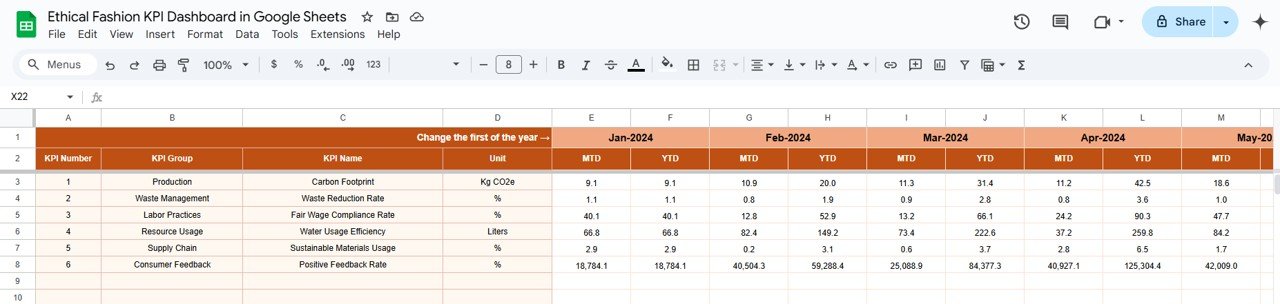
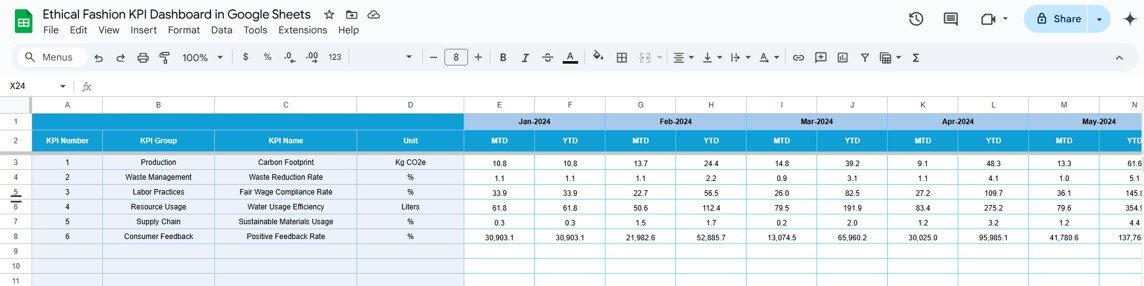
📥 Actual Numbers Sheet Tab
-
Enter your Month-To-Date and Year-To-Date figures
-
Changing the selected month in E1 updates the full dashboard dynamically
🎯 Target Sheet Tab
-
Set your monthly and annual sustainability goals
-
Compare actual performance against these benchmarks automatically
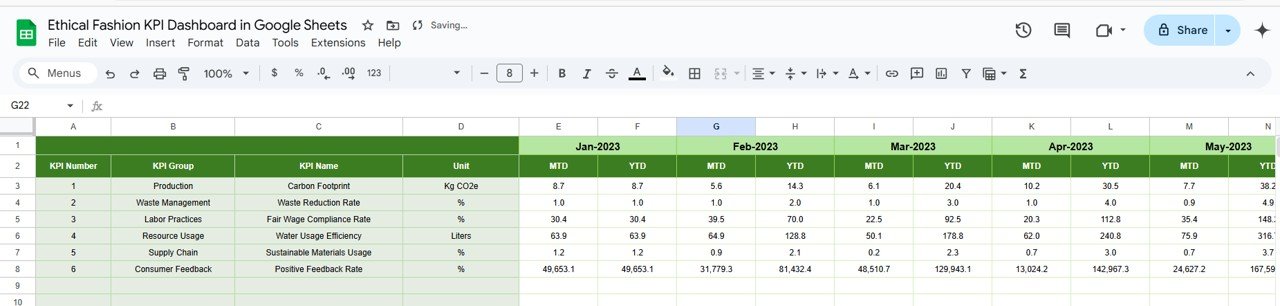
🕰️ Previous Year Numbers Sheet Tab
-
Input historical KPI data to measure your year-over-year growth
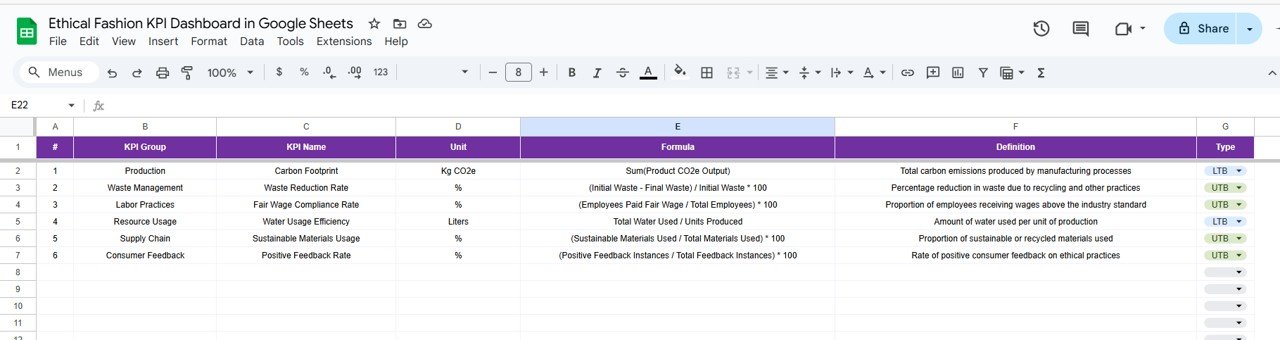
📚 KPI Definition Sheet Tab
-
Includes names, formulas, KPI groups, units, and definitions for every tracked metric
-
Ensures full alignment and understanding across teams
📦 What’s Inside the Ethical Fashion KPI Dashboard
You’ll receive 6 linked worksheets designed for complete performance visibility:
-
Dashboard – All key metrics and visuals in one clean dashboard
-
KPI Trend – Drill-down trend analysis by individual KPI
-
Actual Numbers – Your main entry point for real-world sustainability data
-
Target Sheet – Define your goals for MTD and YTD metrics
-
Previous Year Sheet – Compare current performance to last year’s data
-
KPI Definition Sheet – A reference sheet that explains each KPI clearly
Everything is dynamic, auto-calculating, and ready to use from Day 1.
🧭 How to Use the Dashboard
1️⃣ Input Your Data: Enter actual results in the “Actual Numbers” sheet
2️⃣ Set Monthly/Annual Targets: Fill out the “Target” sheet with your goals
3️⃣ Review Performance: Navigate to the Dashboard for visual comparisons
4️⃣ Compare Past vs Present: Use “Previous Year Numbers” for progress tracking
5️⃣ Drill Into KPIs: Visit the “KPI Trend” tab for detailed breakdowns
No technical skills required—just update the values, and let the dashboard do the work.
👥 Who Can Benefit from This Dashboard?
👗 Ethical Fashion Brands – Track environmental and social KPIs
📦 Sustainable Clothing Retailers – Monitor sourcing, waste, and labor impact
🧵 Fashion Startups – Build a strong ethical foundation from day one
🧑💼 Sustainability Managers – Present real-time data to stakeholders
🛍️ Small Business Owners – Align business growth with sustainability values
💡 Why You’ll Love This Google Sheets Template
✅ No extra software—just open in Google Sheets
✅ Visuals and indicators for at-a-glance tracking
✅ KPI definitions and formulas built-in
✅ Compare MTD, YTD, and PY data in one view
✅ Auto-updating dashboard with dropdown filters
✅ 100% customizable to match your impact goals
✅ Easy to share, present, or export as a report
If you’re serious about sustainable fashion, this dashboard is your essential toolkit.
🔁 Click here to read the Detailed blog post
Click here to read the Detailed blog post


Reviews
There are no reviews yet.