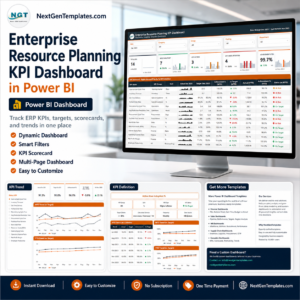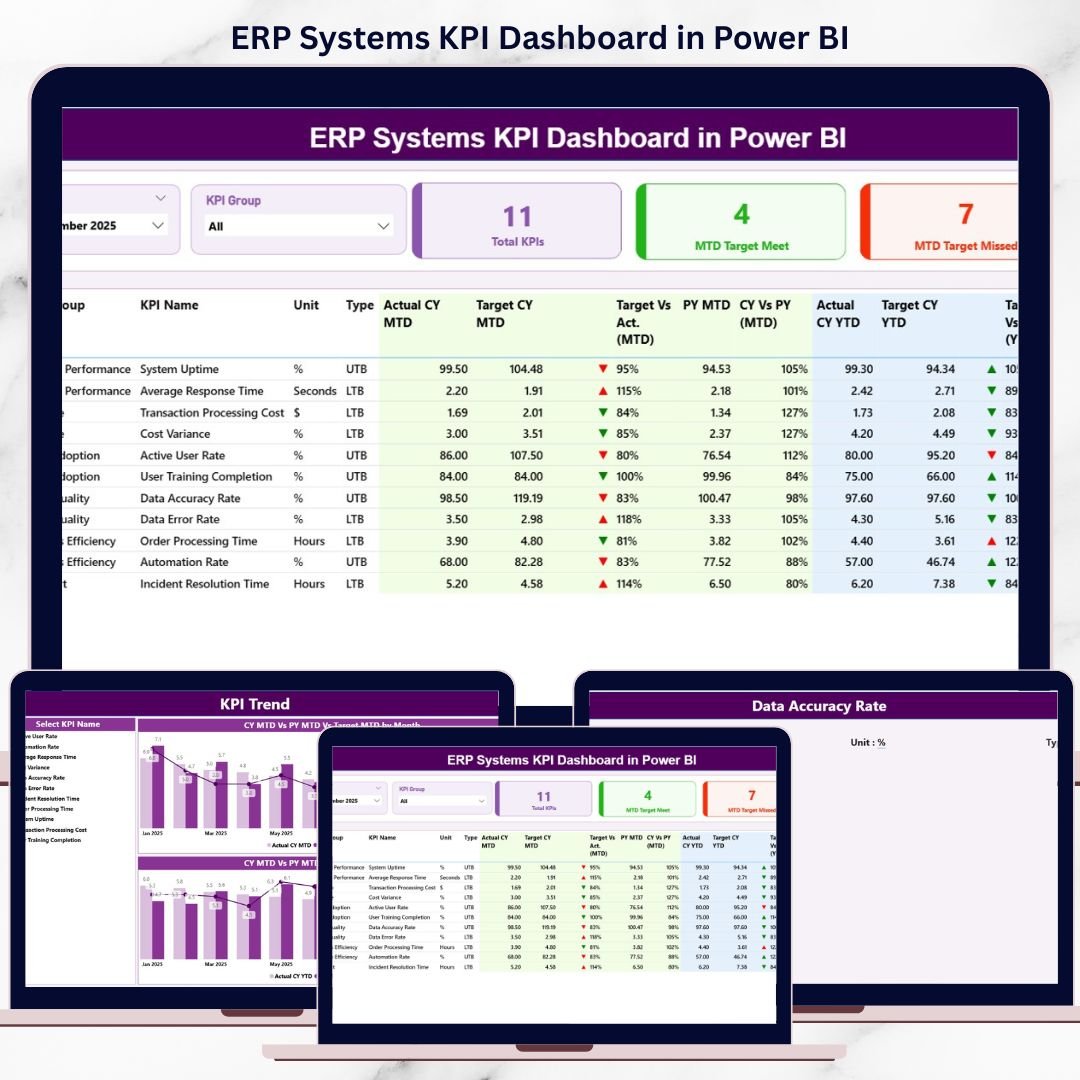
Modern enterprises depend on ERP Systems KPI Dashboardto run finance, supply chain, HR, operations, procurement, and sales. However, implementing an ERP system alone does not guarantee success. What truly matters is how well the ERP system performs, how closely it meets targets, and how effectively leadership can track results. That is exactly why the ERP Systems KPI Dashboard in Power BI becomes a critical performance management solution.
This ready-to-use Power BI dashboard transforms raw ERP data into clear KPIs, visual indicators, and actionable insights. Instead of opening multiple ERP modules or reviewing static reports, decision-makers can monitor MTD, YTD, target, and previous-year performance from a single interactive dashboard.
Built with an Excel-to-Power BI data model, this dashboard keeps data entry simple while delivering enterprise-grade analytics. As a result, both technical and non-technical users can work confidently with the same dashboard.
🔑 Key Features of ERP Systems KPI Dashboard in Power BI
📊 Centralized ERP KPI monitoring in one Power BI dashboard
📅 Month slicer for dynamic MTD & YTD analysis
🎯 Target vs Actual comparison with visual indicators
📉 Previous Year comparison for maturity tracking
🔼🔽 Green/Red performance icons for instant insights
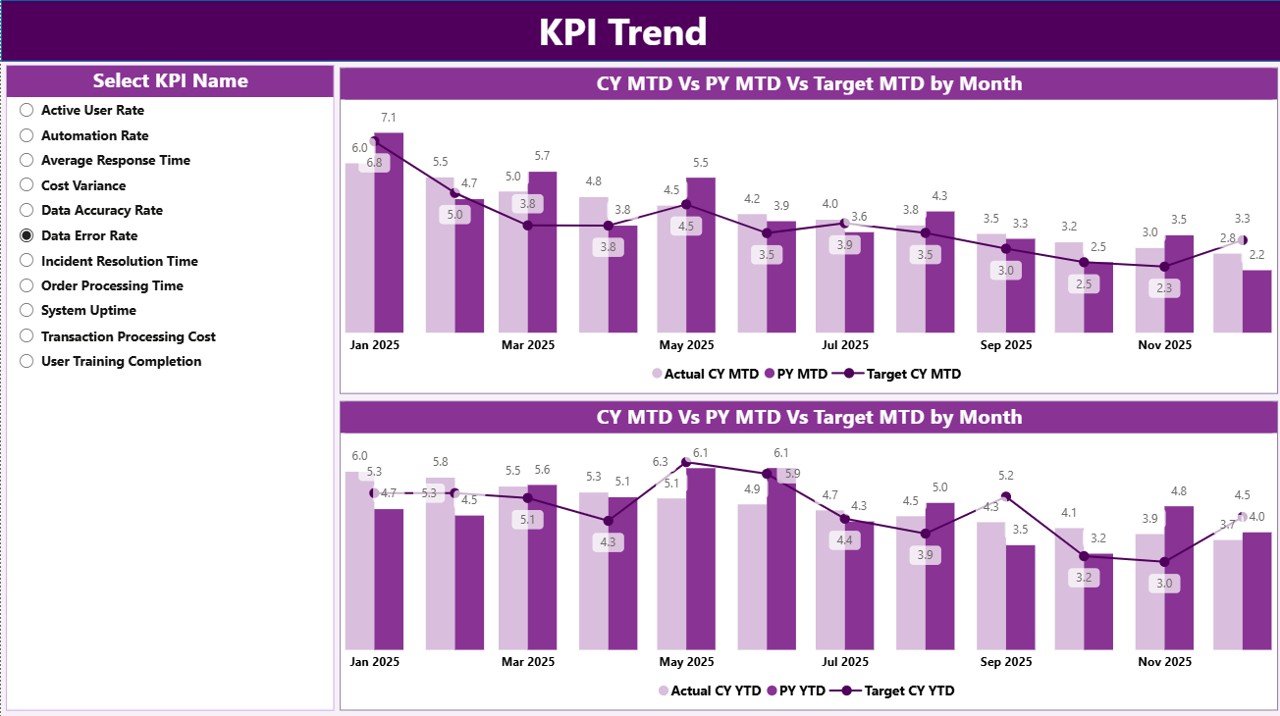
📈 MTD & YTD trend analysis with combo charts
📘 Drill-through KPI definition page for clarity
⚙️ Excel-based data input – no Power BI data entry required
This dashboard turns ERP data into decision-ready intelligence.
📂 What’s Inside the ERP Systems KPI Dashboard in Power BI
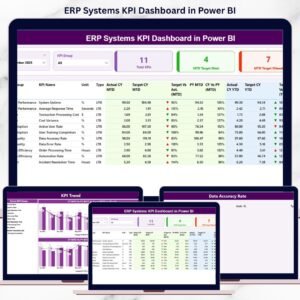
📊 Summary Page – ERP Performance Control Center
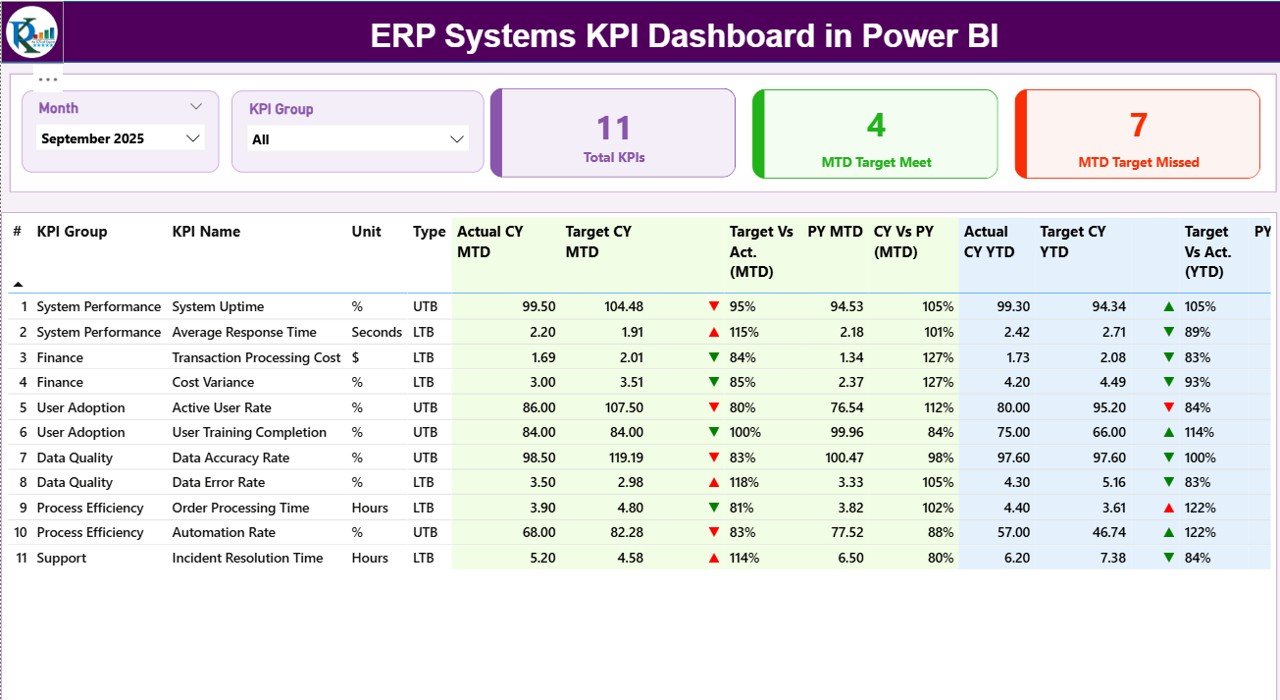
The Summary Page is the main landing page of the dashboard.
What You See Instantly:
Month slicer to change reporting period
KPI Group slicer to filter by department or module
3 KPI cards:
Total KPIs Count
MTD Target Met Count
MTD Target Missed Count
Detailed KPI Table Includes:
KPI Number
KPI Group
KPI Name
Unit
KPI Type (UTB / LTB)
MTD Performance Columns:
Actual CY MTD
Target CY MTD
Status Icon (▲ / ▼)
Target vs Actual %
Previous Year MTD
CY vs PY %
YTD Performance Columns:
Actual CY YTD
Target CY YTD
Status Icon (▲ / ▼)
Target vs Actual %
Previous Year YTD
CY vs PY %
Because everything appears in one table, ERP performance becomes instantly visible.
📈 KPI Trend Page – Performance Over Time
The KPI Trend Page focuses on trend analysis instead of snapshots.
How It Works:
Select a KPI using the KPI Name slicer
View two combo charts:
MTD: Actual vs Target vs Previous Year
YTD: Actual vs Target vs Previous Year
This page helps leadership spot patterns, seasonality, and performance drift early.
📘 KPI Definition Page – KPI Transparency
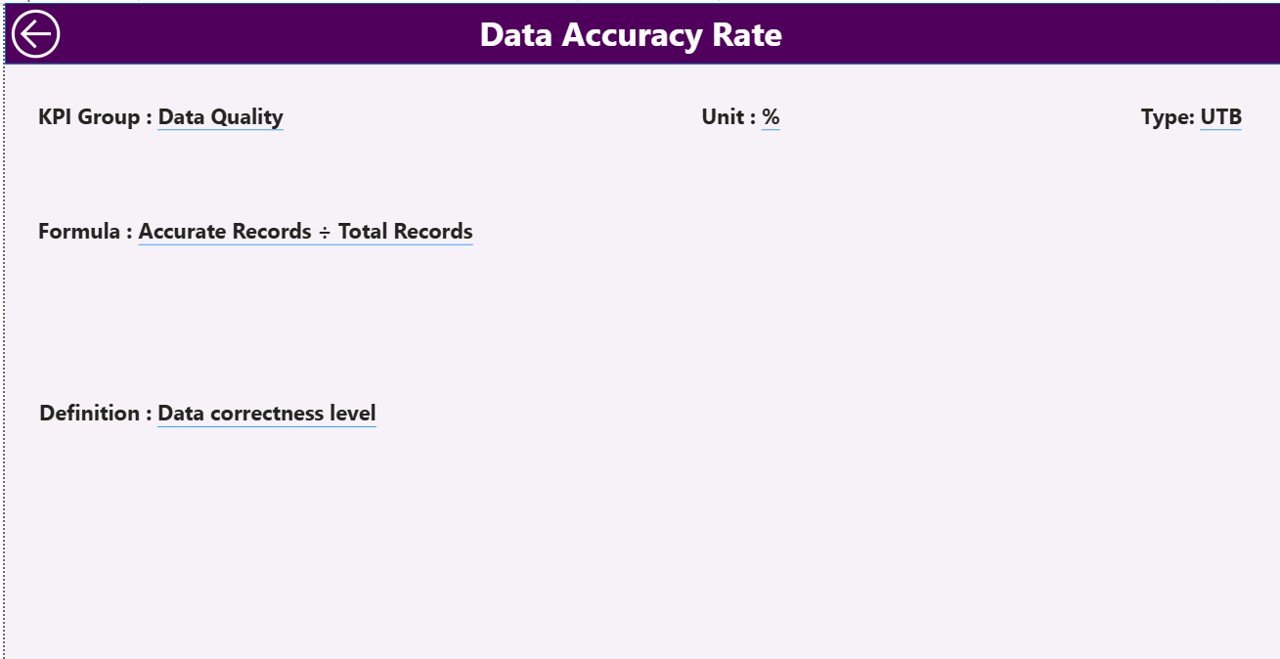
The KPI Definition Page is a drill-through reference page.
It Displays:
KPI Formula
KPI Definition
KPI Unit
KPI Type (UTB / LTB)
Users can drill through from the Summary Page and return easily using the Back button. This ensures clarity and governance across teams.
🛠️ How to Use the ERP Systems KPI Dashboard
✅ Update KPI values in Excel
✅ Refresh the Power BI dashboard
✅ Use slicers to analyze by month or KPI group
✅ Compare Actual vs Target and PY
✅ Review trends and take action
No complex modeling or Power BI expertise required.
👥 Who Can Benefit from This ERP Dashboard?
🏢 ERP Managers
💻 IT & Digital Transformation Teams
📊 Operations Managers
💰 Finance Controllers
📦 Supply Chain Heads
📈 Business Analysts
🧑💼 Senior Executives
Perfect for any organization running an ERP system.
### 👉 Click here to read the Detailed blog post
▶️ Visit our YouTube channel to learn step-by-step video tutorials
https://youtube.com/@PKAnExcelExpert