Environmental compliance is more than a regulatory requirement — it’s a strategic responsibility that impacts sustainability, reputation, and long-term success. The Environmental Compliance KPI Dashboard in Power BI is a ready-to-use, interactive tool that helps organizations monitor environmental performance, track compliance KPIs, and take proactive steps to reduce risks.
This dashboard transforms raw environmental data into actionable insights, enabling compliance officers, environmental managers, and executives to make informed, data-driven decisions. With built-in trend analysis, KPI definitions, and comparison views, it ensures your organization stays compliant while driving sustainability initiatives. 🌱📊
🔑 Key Features of the Environmental Compliance KPI Dashboard
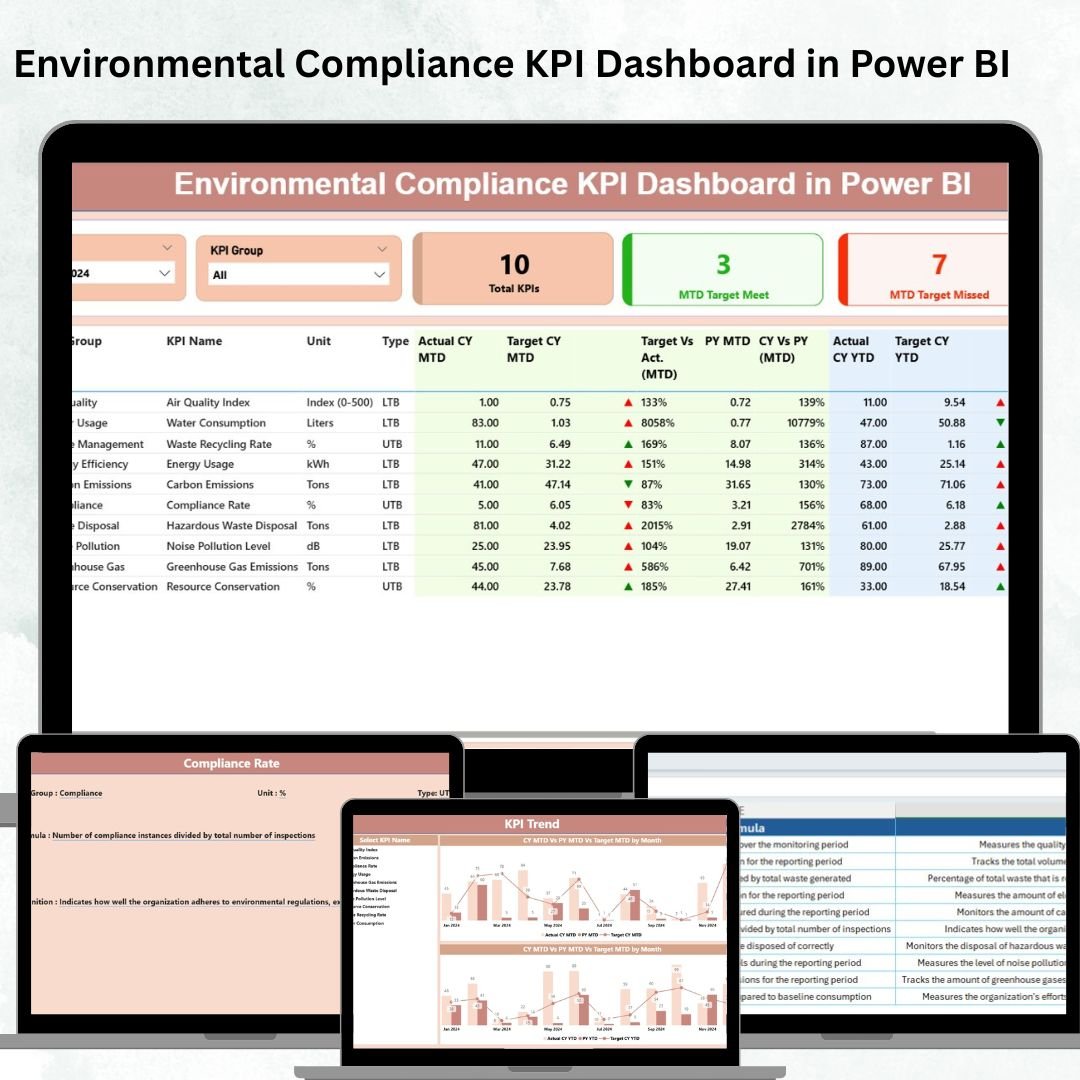
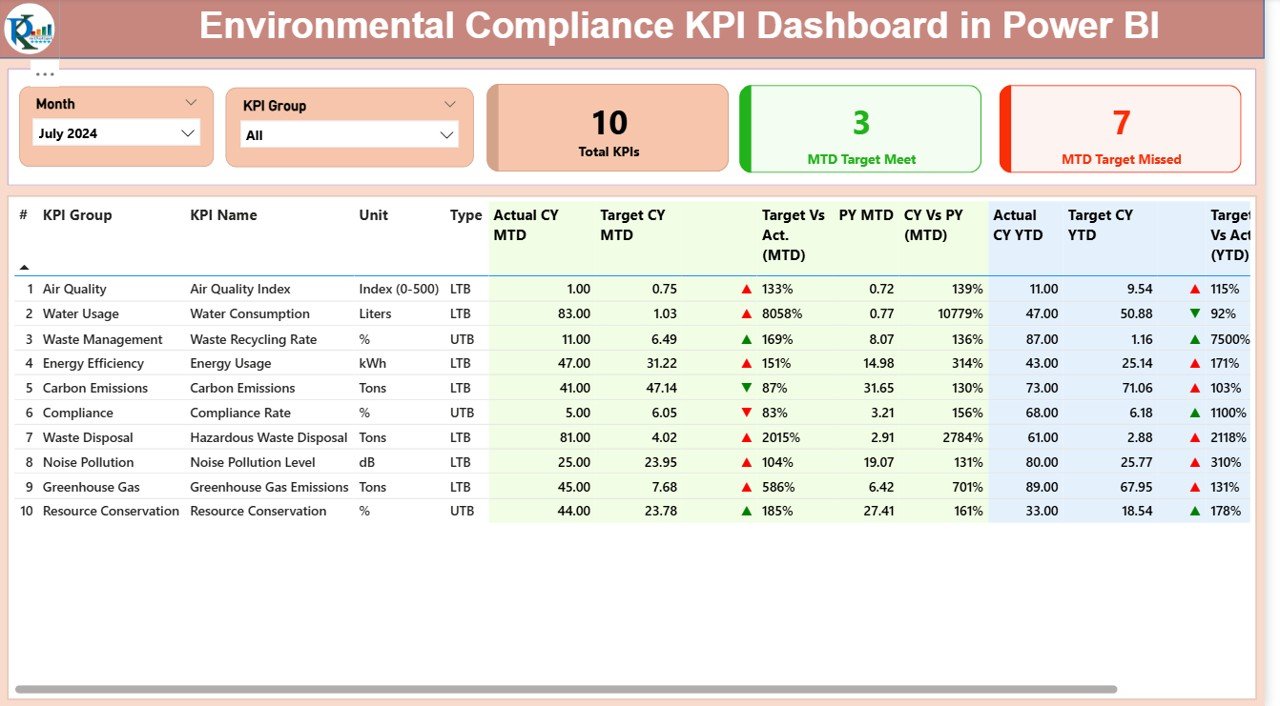
📋 Summary Page
-
KPI Cards for:
-
Total KPIs Count
-
MTD Target Met vs Missed
-
-
Detailed KPI Table including:
-
KPI Number, Group, Name, Unit, and Type (LTB/UTB)
-
Actual vs Target (MTD and YTD)
-
Previous Year comparisons
-
Conditional icons (red/green arrows) for quick performance evaluation
-
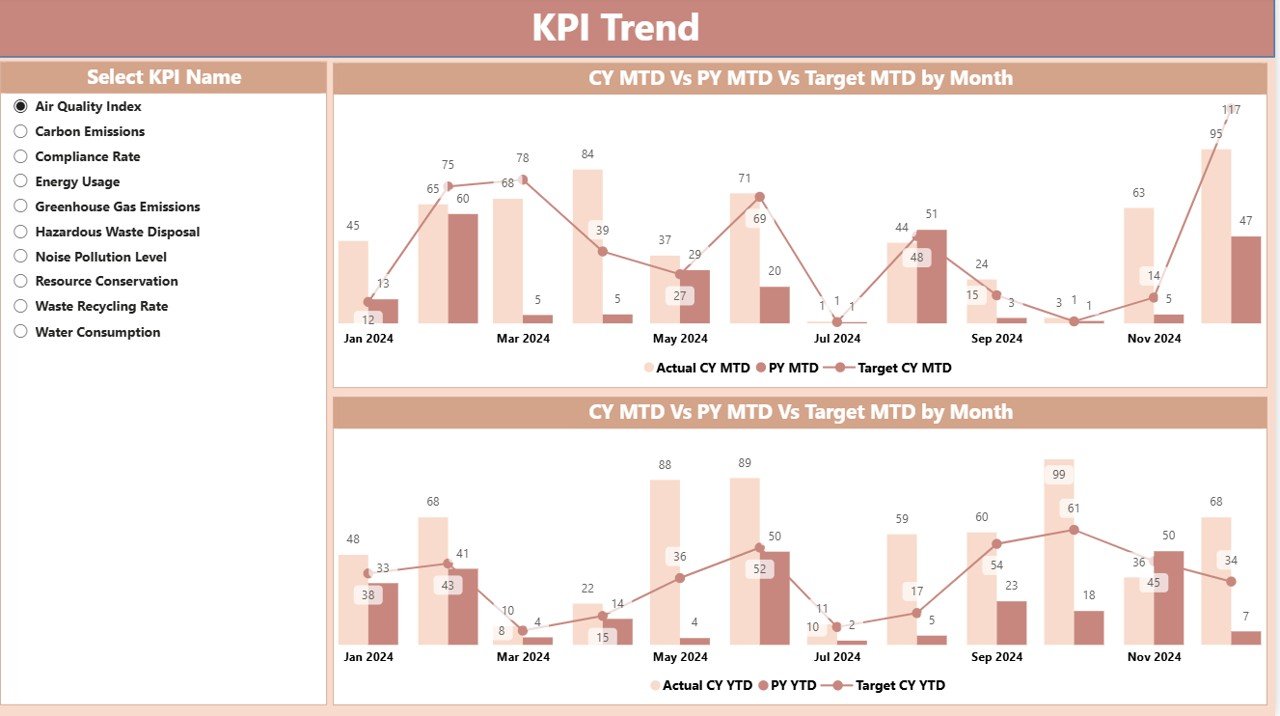
📈 KPI Trend Page
-
Combo charts showing MTD, YTD, Target, and Previous Year values
-
Slicer for selecting individual KPIs
-
Identify patterns, monitor improvements, and detect compliance gaps
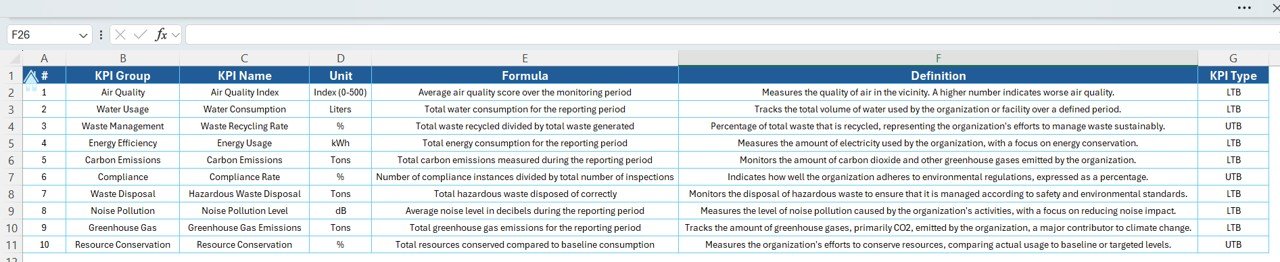
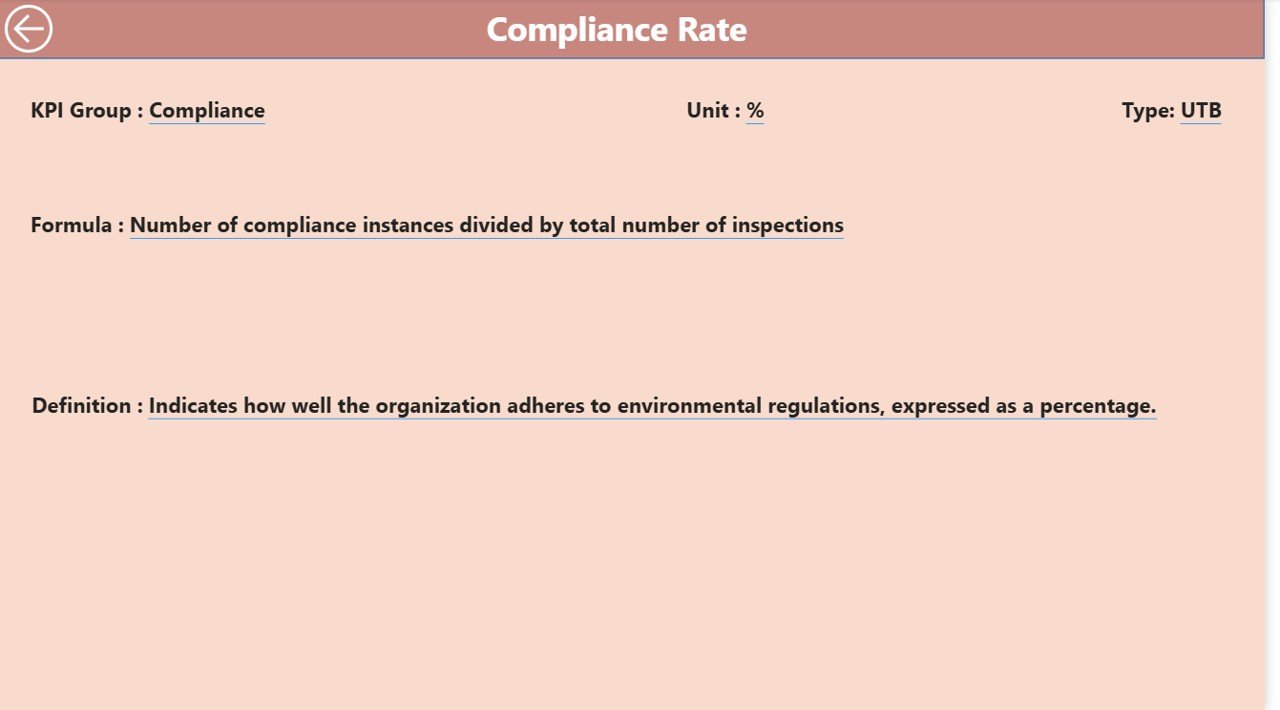
📖 KPI Definition Page
-
Drill-through page with KPI formula, definition, and type
-
Ensures consistency and clarity in KPI interpretation
-
Helps teams understand calculations behind each metric
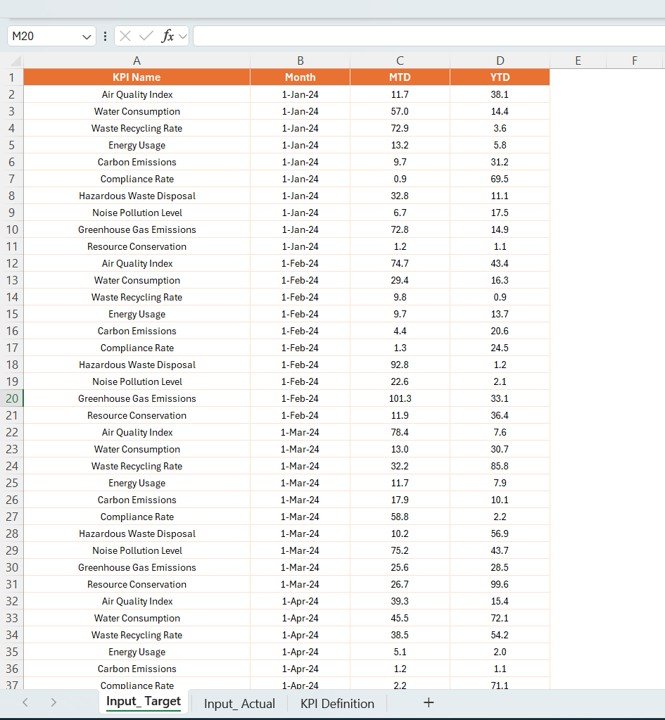
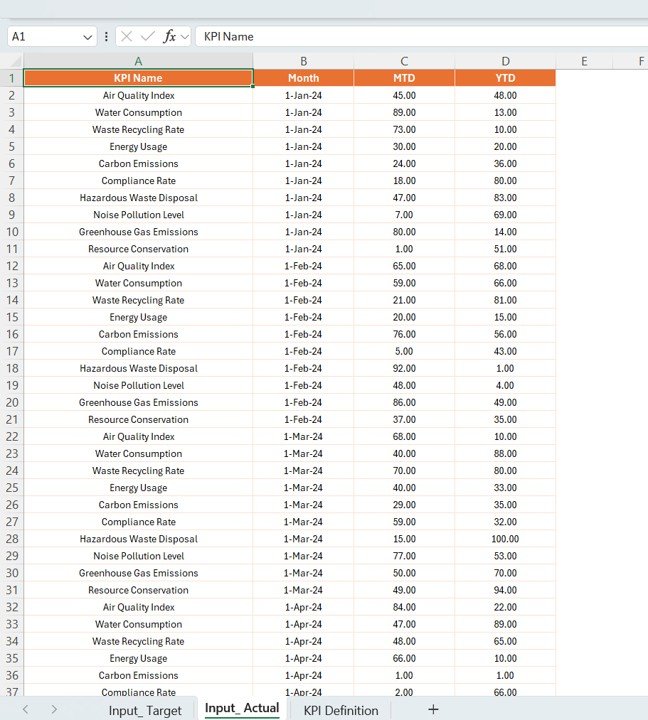
🗂️ Excel Data Source Integration
-
Input_Actual Sheet – Enter monthly and yearly actuals
-
Input_Target Sheet – Record target values for KPIs
-
KPI Definition Sheet – Maintain KPI details, formulas, and units
-
Automatic updates in Power BI with accurate, real-time data
📦 What’s Inside the Dashboard?
✅ Power BI File (.pbix) – Pre-built, fully interactive dashboard
✅ Summary Page – Quick overview of compliance performance
✅ KPI Trend Page – Visual analysis of performance over time
✅ KPI Definition Page – Detailed KPI references
✅ Excel Data Source Template – Pre-formatted sheets for input data
✅ Pre-Built Visuals – Conditional formatting, arrows, and charts for clarity
✅ Customizable Setup – Add/remove KPIs easily via Excel input
This is a plug-and-play compliance monitoring solution — just connect your data and start analyzing immediately. 🚀
🧑💼 Who Can Benefit from This Dashboard?
🎯 Compliance Officers – Ensure timely adherence to environmental regulations
🎯 Environmental Managers – Track emissions, waste, and energy KPIs
🎯 Executives – Gain clear visibility into compliance risks and performance
🎯 Sustainability Teams – Monitor progress toward environmental goals
🎯 Large Enterprises & SMEs – Scalable to handle both small and large datasets
🌟 Advantages of the Environmental Compliance KPI Dashboard
-
✅ Real-Time Monitoring – Track KPIs instantly in Power BI
-
✅ Target vs Actual Insights – Measure MTD and YTD performance
-
✅ Year-over-Year Comparison – Spot long-term improvements or declines
-
✅ Interactive Analysis – Drill down by KPI, department, or metric
-
✅ Risk Reduction – Identify non-compliance issues early
-
✅ Scalable & Customizable – Add KPIs and adjust as needed
🧪 Best Practices for Using This Dashboard
-
Update Data Monthly – Keep actuals and targets current in Excel
-
Focus on High-Risk KPIs – Prioritize emissions, waste, and compliance metrics
-
Leverage Conditional Formatting – Quickly identify underperforming KPIs
-
Use Trend Analysis – Compare historical performance with targets
-
Document KPI Definitions – Maintain consistency and reduce confusion
🎯 How This Dashboard Helps Organizations
-
Ensure regulatory compliance and avoid penalties
-
Support sustainability goals with transparent data
-
Improve decision-making with accurate KPI insights
-
Provide audit-ready reports for management and stakeholders
-
Track environmental performance trends over time
🔗 Click here to read the Detailed blog post
Watch the step-by-step video Demo:


Reviews
There are no reviews yet.