The Employee Satisfaction Survey Tracker in Excel captures structured employee survey responses across 8 purpose-built worksheets, with a password-protected Login Form, a VBA-powered Data Entry form (Add / Update / Delete), a Dashboard page with 4 slicers and 5 auto-refreshing charts, plus a dedicated User Management sheet. Replace the sample survey records and every KPI, chart, and filter updates in under 10 minutes.
🌍 Join 8,400+ teams in 40+ countries using NextGenTemplates to replace paid HR-survey SaaS with one-time-purchase Excel, Google Sheets Dashboards, Power BI, and HTML templates.
✅ Instant download · One-time payment · No subscription · No per-user fees · Lifetime access
Employee Satisfaction Survey Tracker in Excel — Login Form
🔑 Key Features of the Employee Satisfaction Survey Tracker in Excel
🔹 8 integrated worksheets — Login Form, Home Page, Dashboard, Data Sheet, List Sheet, Support Sheet, Settings Sheet, and User Management Sheet — all linked through VBA code so every new employee-satisfaction survey response flows automatically into the dashboard charts and slicers.
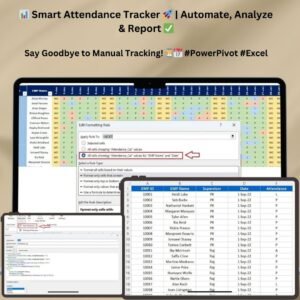
🔹 VBA-driven Data Entry form with three action buttons on the Data Sheet — Add New Record, Update Record, and Delete Record. Click any Survey ID and update or delete the row in two clicks; no manual sheet editing required.
🔹 Login-protected access with a dedicated User Management sheet where you assign usernames, passwords, and roles. Stops casual viewing of sensitive employee comments, satisfaction scores, and engagement ratings.
🔹 Interactive Dashboard with 4 slicers and 5 charts — slice survey responses by Department, Job Role, Survey Category, and Satisfaction Level. All 5 charts auto-refresh the moment you submit a new response through the form.
🔹 Dropdown-driven entry — the List Sheet feeds every combo box on the data entry form (Departments, Job Roles, Survey Categories, Satisfaction Levels, Tenure Bands). Add a new value to the List Sheet and it appears in the form immediately.
🔹 Hidden Support Sheet with pivot tables that power the dashboard charts — you never touch it. Hide it for end users so they only interact with the front-end pages.
🔹 Settings Sheet for organisation logo, contact details, and survey-cycle metadata (survey name, start date, target close date). Personalise the workbook in under 2 minutes.
🔹 Works in Excel 2016, 2019, 2021, and Microsoft 365 on Windows. VBA macros required — Mac compatibility is limited because of UserForm rendering differences.
📦 What’s Inside the Employee Satisfaction Survey Tracker in Excel
The workbook contains 8 sheets organised in the order users navigate them:
Home Page — central navigation hub
🔹 1. Login Form — entry-point password screen. Validates against the User Management sheet before opening the workbook.
🔹 2. Home Page — central navigation with one-click buttons to every sheet. The first thing users see after logging in.
Dashboard with 4 slicers and 5 auto-refresh charts
🔹 3. Dashboard — KPI summary plus 4 slicers (Department, Job Role, Survey Category, Satisfaction Level) and 5 charts visualising response volume, average satisfaction score, satisfaction distribution, category-wise score mix, and department-wise satisfaction breakdown.
Data Sheet — Add / Update / Delete buttons drive the VBA UserForm
🔹 4. Data Sheet — the master record table with Add New Record, Update Record, and Delete Record buttons that launch the VBA Data Entry form for employee satisfaction survey responses.
List Sheet — feeds every combo box in the form
🔹 5. List Sheet — single source of truth for every dropdown value used inside the Data Entry form combo boxes (Departments, Job Roles, Survey Categories, Satisfaction Levels, Tenure Bands).
Support Sheet — hidden pivot tables that drive the charts
🔹 6. Support Sheet — hidden pivot tables that drive the dashboard charts. No user interaction needed.
Settings Sheet — branding and survey-cycle metadata
🔹 7. Settings Sheet — branding, contact details, and survey-cycle metadata (survey name, start date, close date).
User Management Sheet — usernames, passwords, and roles
🔹 8. User Management Sheet — define users, passwords, and access roles. Add or remove users without touching VBA code.
📊 Employee Satisfaction Survey Tracker vs. Google Sheets Equivalent vs. Paid HR Survey SaaS — Where This Fits
| Feature | Employee Satisfaction Survey Tracker in Excel | Google Sheets equivalent | Paid SaaS (e.g., Culture Amp / Lattice / Qualtrics EX) |
|---|---|---|---|
| Cost | $6.99 one-time ✅ | $6.99 one-time | $5–$15 per employee per year ($1,500–$15,000/yr at 300 employees) |
| Platform | Microsoft Excel (offline, works without internet) ✅ | Google Sheets (browser-only) | Cloud SaaS — vendor lock-in |
| Setup time | Under 10 minutes ✅ | Under 10 minutes | 4–12 weeks (vendor onboarding + survey design + integrations) |
| VBA Data Entry form (Add / Update / Delete) | Yes — built-in UserForm ✅ | Apps Script form simulation | Yes (web survey) |
| Login + role-based access | Yes — User Management sheet ✅ | Sheet protection only | Yes (SSO / SOC 2) |
| Slicer-driven dashboard | 4 slicers, 5 charts, auto-refresh ✅ | Pivot filter views | Pre-built dashboards |
| Customisable survey fields | Fully editable — own your code ✅ | Fully editable | Vendor-controlled question types |
| Year-1 cost at 300 employees | $6.99 ✅ | $6.99 | $1,500 – $15,000 |
| Mobile data entry | Excel mobile (limited) | Yes (browser + mobile app) ✅ | Yes (native app) |
For HR managers and People-Ops leads who want a slicer-driven employee-satisfaction survey workflow without a per-employee subscription, the Employee Satisfaction Survey Tracker in Excel sits in the sweet spot — VBA login, Add/Update/Delete UserForm, and an interactive dashboard for the price of a single SaaS day pass.
👥 Who This Template Is For — and Who It’s Not For
✅ This template is built for:
- HR managers at 30–500 person companies running quarterly or annual employee satisfaction surveys
- People-Ops leads consolidating engagement-pulse responses from departments and shift locations into one workbook
- Founders and HR-Ops teams who want a $6.99 alternative to a $1,500–$15,000/year HR-survey SaaS subscription
- Internal communications and DEI teams logging satisfaction trends by job role, tenure band, and department
- Office and operations managers running short eNPS or pulse-survey cycles where data must stay offline on a Windows laptop
❌ This template is NOT for:
- Enterprise teams that require SOC 2 compliance, SSO, or audit-trail logs across 5,000+ respondents
- Fully anonymous-only surveys with cryptographic guarantees — passwords are stored in a sheet, not an enterprise vault
- Mac-only HR teams — the VBA UserForm features depend on Windows Excel
- Teams who need a mobile-first respondent experience where employees submit feedback from their phones via a public link
⚙️ How to Use the Employee Satisfaction Survey Tracker in Excel
- Download and unzip the file, then open the .xlsm workbook in Microsoft Excel and click “Enable Macros” when prompted.
- Set up users on the User Management sheet — add usernames, passwords, and roles for each HR or admin user who will access the tracker.
- Customise dropdowns on the List Sheet — enter your own Departments, Job Roles, Survey Categories, Satisfaction Levels, and Tenure Bands.
- Brand the Settings sheet with your organisation name, survey-cycle name, and survey start / close dates.
- Log in through the Login Form to reach the Home Page, then open the Data Sheet and click “Add New Record” to enter the first survey response.
- Track and analyse — open the Dashboard, slice by Department or Job Role, and review the 5 charts that update in real time as new responses arrive.
💼 Real-World Use Cases
Anjali leads HR at a 180-person IT services firm in Pune. She runs a quarterly satisfaction survey using the Employee Satisfaction Survey Tracker in Excel, logs every response through the Add Record form, and slices the dashboard by Department to spot which engineering pods are flagging burnout. She presents a 5-chart summary to the leadership team every quarter — without paying $9,000/year for a Culture Amp licence.
Daniel runs People-Ops at a 60-person renewable-energy startup in Madrid. He uses the tracker to capture short eNPS pulse responses every six weeks, slices by Job Role to compare satisfaction between field technicians and office staff, and uses the User Management sheet to give the country managers read-only dashboard access. The Settings sheet stores the active survey cycle, so the dashboard always shows current-cycle responses.
Mei-Lin is the HR-Ops manager at a 240-person fintech in Singapore. She uses the User Management sheet to give the DEI committee read-only access while keeping edit rights with HR. Tagging each response by Tenure Band lets her produce a “new-hires vs tenured employees” comparison chart in under a minute for the next leadership review.
❓ Frequently Asked Questions
What sheets are included in the Employee Satisfaction Survey Tracker in Excel?
The Employee Satisfaction Survey Tracker in Excel includes 8 sheets — Login Form, Home Page, Dashboard, Data Sheet, List Sheet, Support Sheet, Settings Sheet, and User Management Sheet — all wired together through VBA so adding a survey response updates the dashboard automatically.
How does the VBA Data Entry form work in this tracker?
Three buttons on the Data Sheet — Add, Update, Delete — open the same UserForm. Add inserts a new survey response; Update prefills the form when you click an existing Survey ID; Delete confirms before removing the row. No manual data entry on the sheet itself.
How long does setup take for the Employee Satisfaction Survey Tracker?
Setup of the Employee Satisfaction Survey Tracker in Excel takes under 10 minutes — open the file, enable macros, edit the List Sheet dropdowns, configure users on the User Management sheet, and personalise the Settings sheet. The Dashboard works without any further configuration.
How does this compare to paid HR survey SaaS like Culture Amp or Lattice?
Paid employee-engagement SaaS typically costs $5–$15 per employee per year — about $1,500 to $15,000 per year for a 300-person company. The Employee Satisfaction Survey Tracker in Excel is $6.99 one-time with no recurring fees, no per-user pricing, and full ownership of your code and survey data.
Does the Employee Satisfaction Survey Tracker work on Mac?
The Employee Satisfaction Survey Tracker uses VBA UserForms which render reliably only in Excel for Windows (2016, 2019, 2021, Microsoft 365). Mac Excel does not fully support UserForm controls, so we recommend Windows. A Google Sheets equivalent works on any device including Mac.
Can I add custom satisfaction-survey fields and dropdowns to the tracker?
Yes. All combo-box values come from the List Sheet, so adding a new Department, Job Role, Survey Category, or Satisfaction Level takes one row. For new fields, edit the UserForm in the VBA editor — full source code is included and unprotected. Microsoft Learn has a useful intro to VBA UserForm customisation.
Is the Employee Satisfaction Survey Tracker a one-time purchase?
Yes. The Employee Satisfaction Survey Tracker in Excel is $6.99 one-time, instant download, no subscription, no per-user fees, and lifetime access. You also get free updates whenever the template is revised.
👤 About the Author
Built by PK — Microsoft Certified Professional with 15+ years of Excel, Google Sheets, and Power BI experience. Founder of NextGenTemplates, reaching 300K+ subscribers across YouTube channels (@PK-AnExcelExpert, @NextGenTemplates, @NeoTechNavigators). Every template is hand-built and tested before release.
🔗 Explore Related Templates
🔹 Product Feedback Tracker in Excel — sister template using the same VBA login + UserForm + slicer dashboard pattern, applied to customer product-feedback workflows.
🔹 Office Renovation Feedback Tracker in Excel — same VBA architecture for office-renovation feedback capture.
🔹 Employee Retirement Notification Tracker in Excel — HR-domain counterpart with the same Add / Update / Delete UserForm pattern.
🔹 Performance Appraisal Tracker in Excel — pair with this tracker to combine satisfaction scores with performance reviews.
🔹 Employee Engagement Dashboard in Power BI — Power BI counterpart for teams that prefer the Microsoft Fabric stack.
🔹 💎 Save 40% — Get all 10 HR templates in the HR & Workforce Analytics Bundle →
🔹 Browse all Excel Tracker Templates and HR & Payroll Templates on NextGenTemplates.
📖 Click here to read the Detailed Blog Post
🎥 Visit our YouTube channel for step-by-step video tutorials
👉 YouTube.com/@NextGenTemplates
Watch the step-by-step video tutorial:


Reviews
There are no reviews yet.