



In today’s cost-conscious education and corporate training environments, tracking spending efficiency is just as important as tracking learning outcomes. Whether you run a corporate L&D team, a university program, or a nonprofit training department, the Education and Learning Cost Efficiency KPI Dashboard in Excel offers a complete solution to monitor, analyze, and improve your education-related spending.
This ready-to-use Excel dashboard is designed to provide you with monthly and year-to-date (YTD) performance visibility using interactive visuals, drop-downs, and smart formulas—all built in Excel.
🧭 What’s Inside the Dashboard?
This dynamic Excel tool includes 7 professionally designed worksheets, giving you full control and insight into your cost-efficiency KPIs:
🏠 1. Home Sheet – Easy Navigation

Six smart buttons for one-click access to each worksheet.
Clean layout, no coding or advanced Excel skills required.
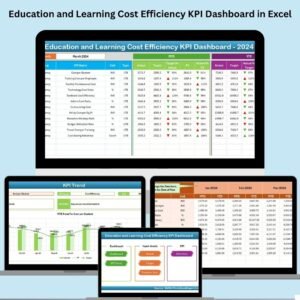
📊 2. Dashboard Sheet – Performance Snapshot
Select a Month (cell D3), and instantly view:
MTD and YTD Actuals
Comparison vs Targets
Comparison vs Previous Year
🎯 Built-in up/down arrows and conditional formatting highlight performance status at a glance.
📈 3. KPI Trend Sheet – Analyze Trends Over Time
Pick any KPI from a drop-down.
View:
KPI Group, Unit, Type (UTB or LTB), and Formula
MTD and YTD trend lines across months
This is where your data tells a story.
📥 4. Actual Numbers Input Sheet – Monthly Data Entry
Select the starting month once, and the rest of the year populates automatically.
Input MTD and YTD actuals for each KPI in an intuitive format.
🎯 5. Target Sheet – Set Smart Goals
Define monthly and yearly targets for each KPI.
Compare actuals with these to gauge performance.
📆 6. Previous Year Number Sheet – For Long-Term Comparison
Record historical values to enable powerful year-over-year analysis.
📖 7. KPI Definition Sheet – Team Alignment
Each KPI includes:
KPI Name & Group
Unit of measurement
Formula
Clear, concise definition
Ensures everyone interprets metrics the same way.
✅ Benefits of Using This Dashboard
✨ Transparency – See exactly where your learning budget is being used.
📊 Data-Driven Insights – Replace guesswork with reliable performance metrics.
🔍 Benchmarking – Compare progress against previous years and set meaningful targets.
📉 Cost Optimization – Identify overspending, underutilization, or opportunities for savings.
🧠 Decision Support – Present insights to leadership using visually engaging trend charts.
🔧 Real-Life Example
Let’s say your “Cost per Learner” for Jan 2024 is ₹100, while the target is ₹90. The dashboard immediately shows the variance with a down arrow. By June, if the cost drops to ₹85, a green up arrow appears—visually confirming your efficiency improvement.
🎓 Who Should Use This?
📘 Corporate Training Teams
🏫 Universities & Colleges
🎯 Learning & Development (L&D) Managers
💼 HR & Talent Development Teams
📊 Nonprofits & NGOs running skill programs
📘 Best Practices for Success
📅 Update data monthly – consistency drives accuracy.
🔁 Use historical data – benchmark and analyze long-term trends.
🧭 Set realistic targets – informed by historical numbers.
✅ Train your team – ensure uniform understanding of KPI meanings.
🎨 Leverage visuals – trend charts help tell your performance story.
📘 Why Excel?
Excel remains the most accessible and flexible tool:
Familiar to most users
No internet or software subscription needed
Built-in formulas, conditional formatting, and visuals
Easy to customize, scale, or export
📍 Conclusion
The Education and Learning Cost Efficiency KPI Dashboard in Excel is your ultimate tool to track spending, benchmark performance, and make informed decisions for any learning-focused initiative.
Whether you’re cutting costs, improving program ROI, or just ensuring budget utilization is on point—this dashboard will give you the visibility you need.
▶️ Visit our YouTube Channel for step-by-step video guides.
🔗 Click here to read the Detailed blog post
Watch the step-by-step video tutorial:
Compatibility and Requirements
- Works in Microsoft Excel desktop (Excel 2016 or later, or Microsoft 365).
- You pick the month and the KPI from dropdown lists. Microsoft explains dropdowns in Create a drop-down list.
Frequently Asked Questions
Which sheets are included?
Seven sheets: Home, Dashboard, KPI Trend, Actual Numbers Input, Target, Previous Year Number and KPI Definition.
How do I update the dashboard each month?
Enter your MTD and YTD actuals for each KPI in the Actual Numbers Input sheet and your goals in the Target sheet. Then select the month in cell D3 of the Dashboard sheet and the figures update.
Can I compare this year with last year?
Yes. Record last year’s values in the Previous Year Number sheet and the Dashboard shows them next to your actuals and targets.
How do I see the trend for a single KPI?
Open the KPI Trend sheet and choose the KPI from the dropdown. It shows the KPI group, unit, type (UTB or LTB), formula, and the MTD and YTD trend across months.
Is there a version that tracks learning performance instead of cost?
Yes. See the Education and Learning Performance KPI Dashboard in Excel.
Related Education Templates
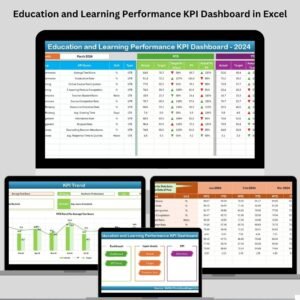
- Education and Learning Performance KPI Dashboard in Excel: the same layout for learning performance KPIs
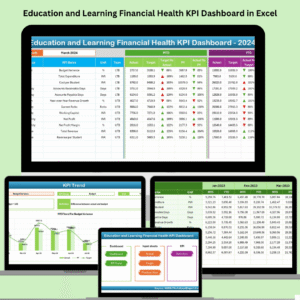
- Education and Learning Financial Health KPI Dashboard in Excel: a finance view for education programs
- Education and Learning Quality Assurance KPI Dashboard in Excel: quality KPIs for learning programs
- Learning & Development KPI Dashboard in Excel: KPIs for L&D teams
- Education Dashboard in Power BI: an education dashboard for Power BI
Browse all Excel education templates and Excel KPI dashboards.





Reviews
There are no reviews yet.