In the age of information, data isn’t just numbers—it’s your competitive edge. But raw data alone won’t move the needle. What truly drives success is how well your business monitors, measures, and acts on that data.
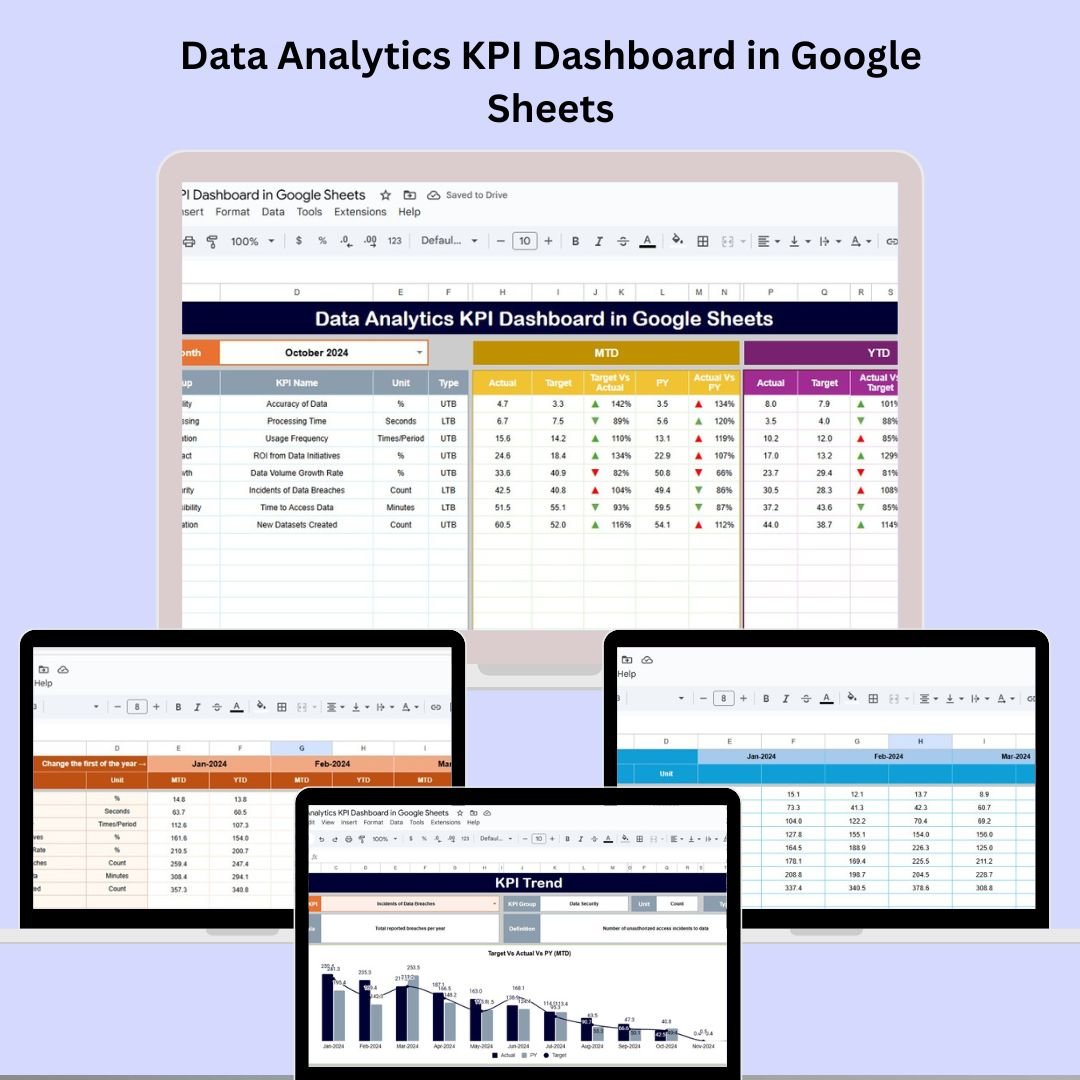
Introducing the Data Analytics KPI Dashboard in Google Sheets – a simple, powerful, and highly customizable tool designed to help you track KPIs, visualize performance trends, and make informed, data-driven decisions—without the need for expensive software or advanced tech skills.Data Analytics KPI Dashboard in Google Sheets
✨ Key Features of the Data Analytics KPI Dashboard
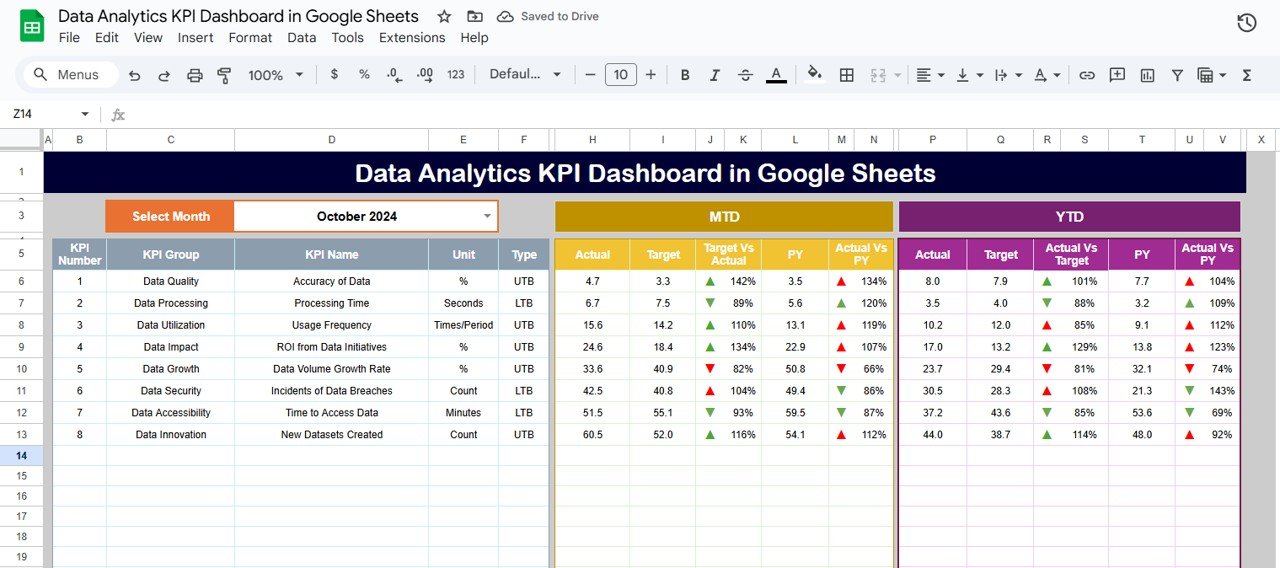
📈 1. Dashboard Sheet Tab
This is your real-time control panel.
-
🔄 Select a month from the dropdown in cell D3
-
📊 Instantly view MTD and YTD values for each KPI
-
⚖️ Compare Actuals vs. Targets vs. Previous Year
-
📉 📈 Conditional formatting with arrows shows positive/negative trends
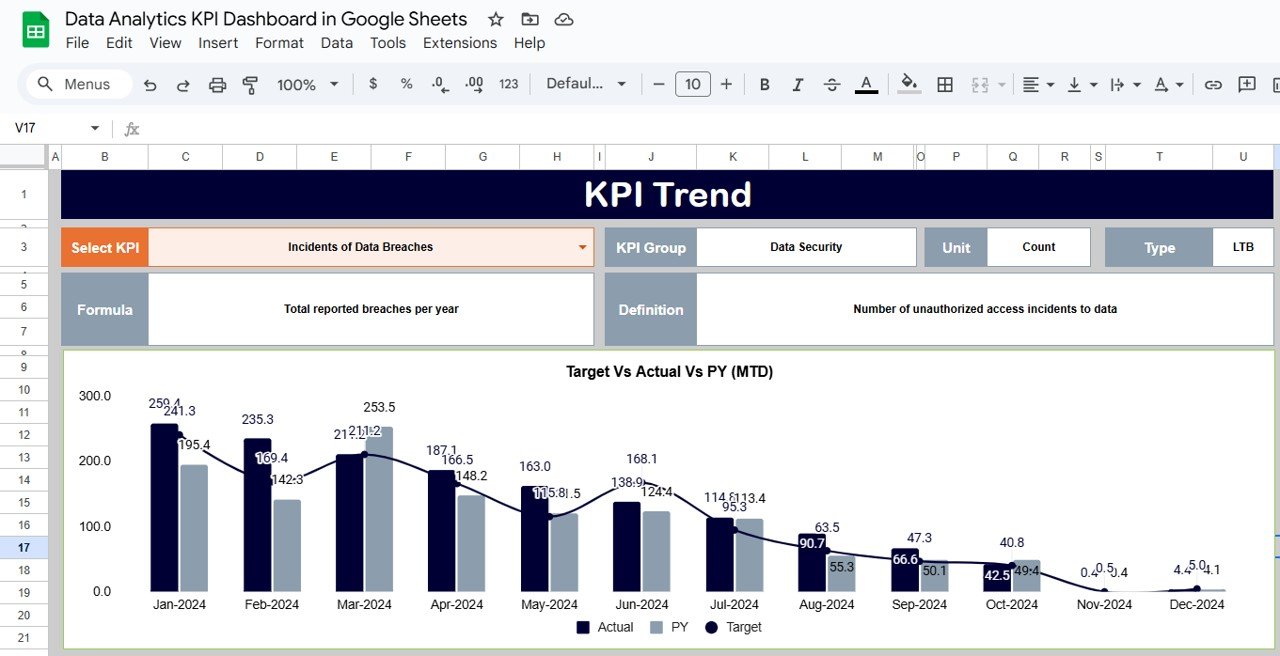
🔁 2. KPI Trend Sheet
A powerful reference tool for KPI clarity.
-
🔽 Dropdown in cell C3 to choose a KPI
-
📘 View KPI Group, Unit, Formula, Type (UTB/LTB), and Definition
-
🧠 Great for team alignment and training new analysts
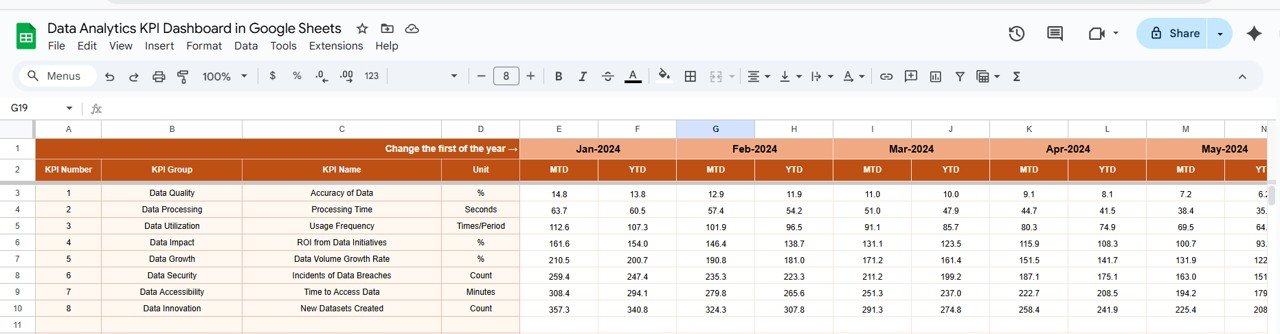
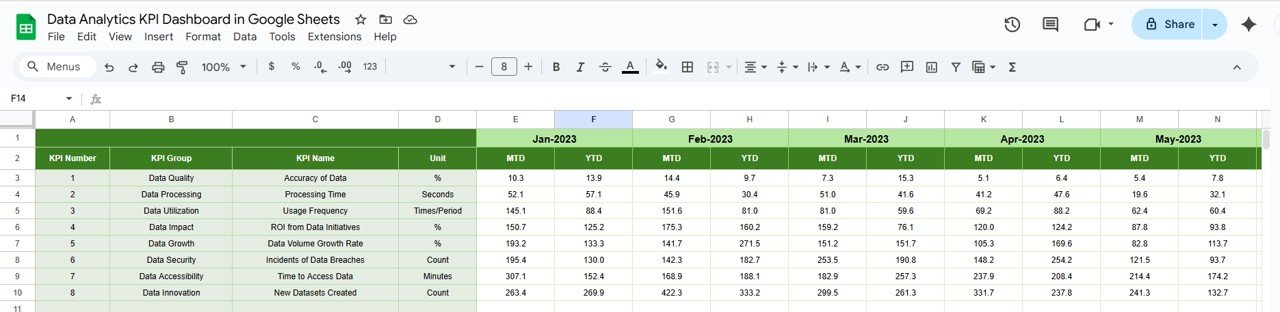
🧾 3. Actual Numbers Sheet
Input your monthly performance data easily.
-
📆 Use cell E1 to align data with the correct month
-
✅ Track MTD and YTD actuals in one view
-
📌 Keeps historical records organized and actionable
🎯 4. Target Sheet
Define your KPI goals here.
-
🧮 Enter monthly and yearly target values
-
📉 Instantly compare actual vs. target in the dashboard
-
🔧 Helps in setting clear, realistic benchmarks
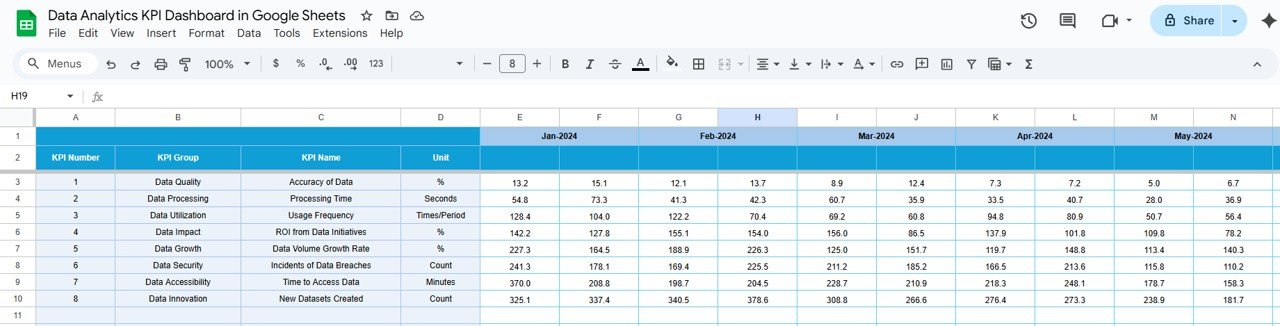
📅 5. Previous Year Numbers Sheet
Set up your YOY comparisons.
-
📊 Add last year’s MTD and YTD values
-
🔍 Spot trends, seasonality, and growth patterns
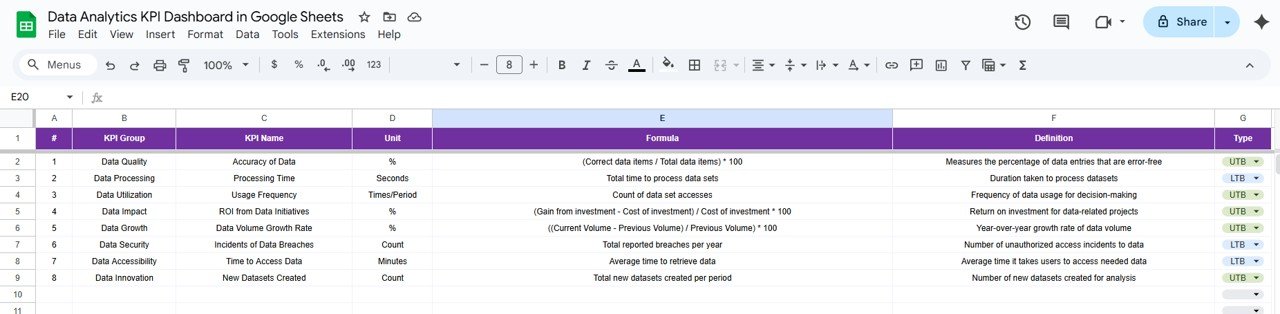
📚 6. KPI Definition Sheet
The core of your dashboard logic.
-
📋 Define KPI Group, Unit, Formula, Type (UTB/LTB), and Description
-
🔍 Ensures everyone understands what’s being tracked and why
-
🧠 Use it to onboard new users quickly
📊 What’s Inside the Data Analytics KPI Dashboard?
✅ 6 Preformatted Tabs
✅ Dynamic Dropdown Controls
✅ Up/Down Arrow Indicators
✅ Month & Year Selection
✅ Editable KPI Table
✅ Visual Dashboard Panels
✅ Formula-Based Aggregations
✅ 100% Cloud-Based
🧩 How to Use the Data Analytics KPI Dashboard
-
👉 Choose the month on the Dashboard tab
-
✍️ Enter actual MTD/YTD data in the Actual Numbers tab
-
🎯 Set performance goals in the Target tab
-
⏪ Input last year’s numbers in the Previous Year tab
-
📘 Use KPI Trend and Definition tabs to reference logic
-
📊 Monitor charts and data to drive smart decisions
👤 Who Can Benefit from This Dashboard?
-
🧑💻 Data Analysts – Trend monitoring & process optimization
-
📢 Marketing Teams – Campaign metrics & lead tracking
-
🗂️ Project Managers – Track delivery KPIs & risks
-
💼 Executives – Quick overview of business health
-
🚀 Startups – Lean performance tracking without extra cost
✅ Advantages of Using This Google Sheets Dashboard
-
🆓 No costly tools required – 100% free via Google Sheets
-
🤝 Real-time collaboration – Work with your team simultaneously
-
🔥 Visual data storytelling – Arrows and colors make trends obvious
-
📉 Track actual vs. target – Identify underperforming areas quickly
-
🔧 Fully customizable – Add/remove KPIs, change formats, or edit formulas
-
💼 Suitable for all departments – Use across finance, sales, HR, and more
🛠️ Best Practices for Success
-
📅 Hold monthly review meetings to assess data
-
✅ Validate entries to maintain accuracy
-
🎯 Focus on actionable KPIs that impact business decisions
-
🧠 Train your team on interpreting dashboard insights
-
💾 Back up the file weekly for safety
🚀 Opportunities for Enhancement
-
🔌 Connect to external databases like BigQuery or Analytics
-
📤 Automate updates via Apps Script or API
-
📊 Add sparklines or dynamic charts
-
🔒 Restrict editing with Google permissions
📘 Click here to read the Detailed blog post Data Analytics KPI Dashboard in Google Sheets
Watch the step-by-step video Demo:


Reviews
There are no reviews yet.