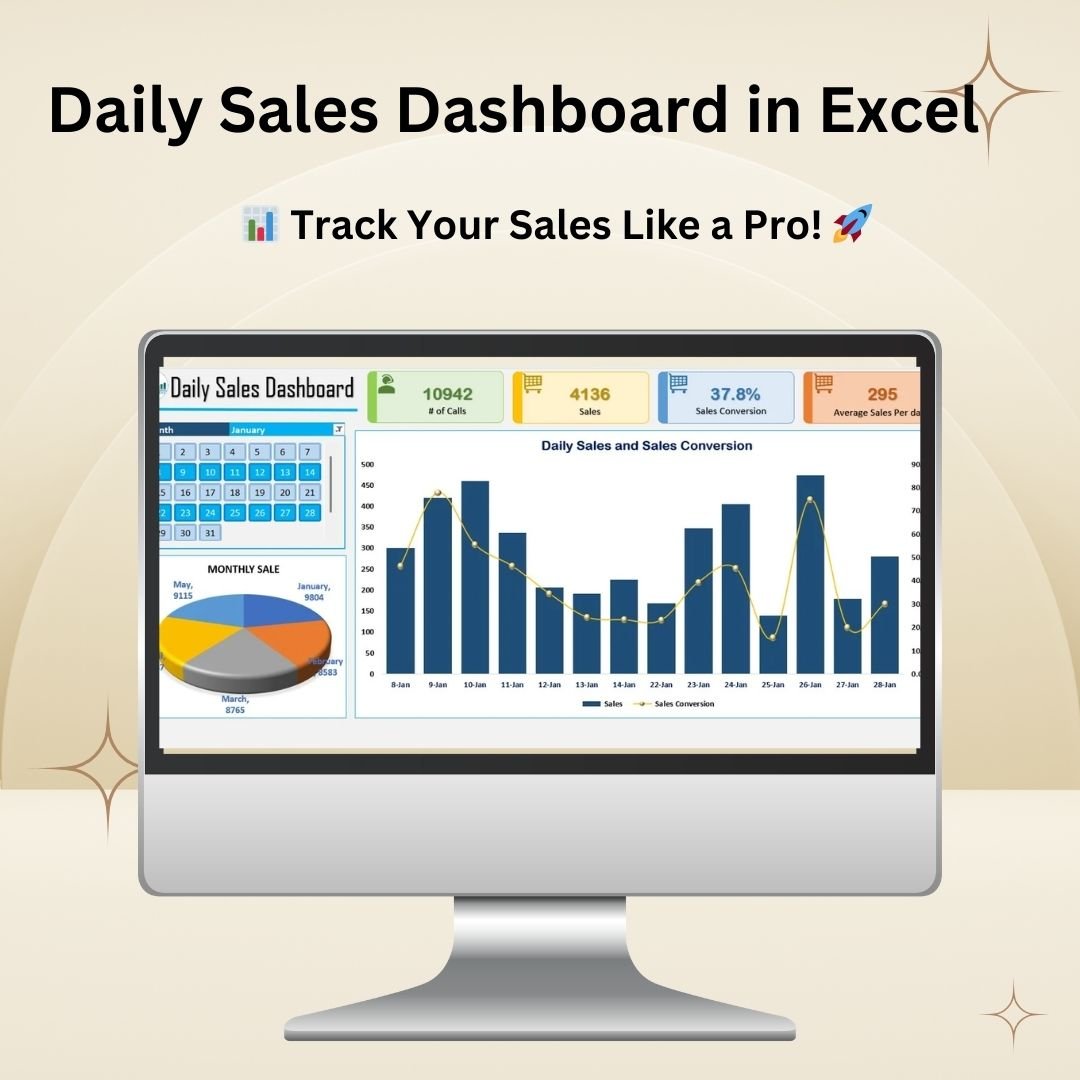

The Daily Sales Dashboard in Excel is a powerful tool designed to track and analyze daily sales performance. Whether you’re managing a sales team, monitoring telecalling efficiency, or optimizing sales strategies, this dashboard provides an intuitive and data-driven approach to understanding your sales trends.
With interactive visualizations and real-time data updates, this dashboard enables businesses to make informed decisions, increase conversions, and maximize revenue. It is ideal for sales managers, business owners, and marketing professionals looking for a structured way to track key sales metrics.
Key Features
✔ Comprehensive Sales Tracking
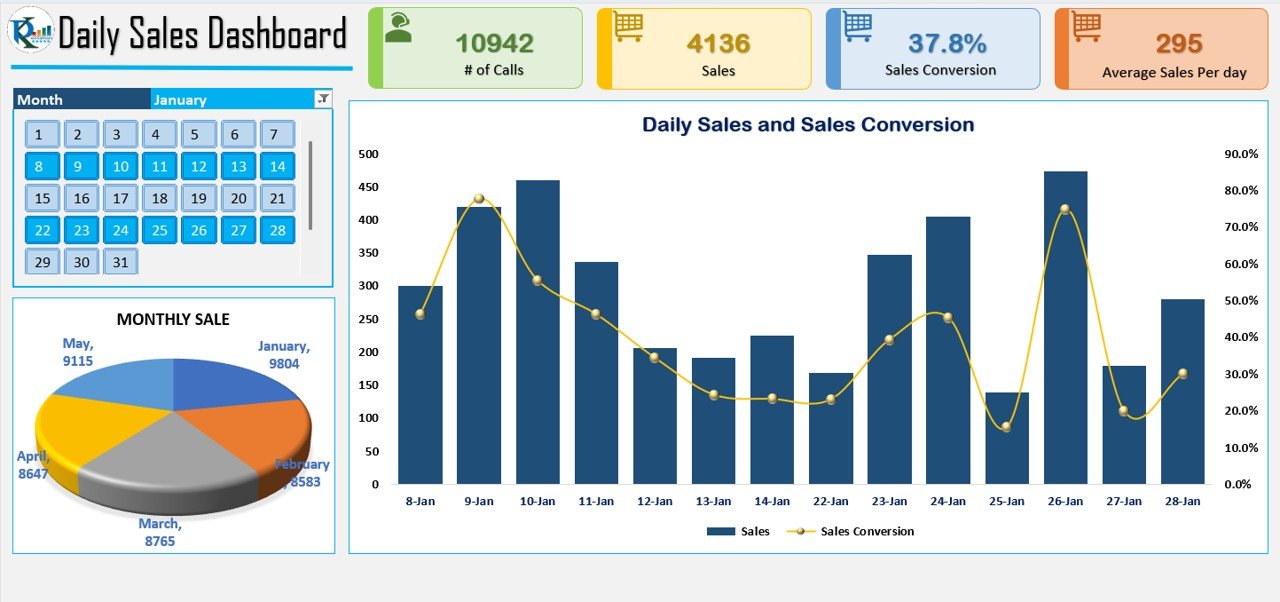
Monitor the number of daily calls, successful sales, and conversion rates in a structured format.
✔ Visual Representation of Sales Trends
Analyze sales performance over time with dynamic bar charts, pie charts, and trend lines.
✔ Sales Conversion Analysis
Understand the correlation between the number of calls made and the actual sales generated to improve sales strategies.
✔ Daily and Monthly Insights
Get a breakdown of daily and monthly sales trends to identify peak performance days and adjust strategies accordingly.
✔ Performance Monitoring
Track average sales per day, identify sales bottlenecks, and optimize efforts for better efficiency.
✔ Interactive Calendar View
Select specific dates to analyze performance trends for particular periods.
✔ Automated Calculations
Reduce manual effort with pre-built formulas that instantly calculate sales conversion percentages and average sales per day.
✔ User-Friendly Interface
Designed for ease of use, even for non-technical users, ensuring quick access to key sales data.
How It Works
- Input Daily Sales Data
- Enter the number of calls made and the corresponding sales figures.
- Automated Data Processing
- The dashboard automatically calculates sales conversions and averages.
- Visual Analysis
- Review interactive charts and graphs for deeper insights into sales trends.
- Optimize Sales Strategies
- Identify patterns, adjust efforts, and improve telecalling efficiency based on data insights.
Who Can Use This Dashboard?
🔹 Sales Managers & Business Owners
🔹 Telecalling & Customer Support Teams
🔹 Marketing Professionals & Analysts
🔹 Entrepreneurs & Small Businesses
This Daily Sales Dashboard simplifies sales tracking, provides real-time insights, and enhances decision-making. Download now to streamline your sales performance management! 🚀📊
Click here to read the detailed blog post:
Watch the step-by-step video tutorial:
Also check our Restaurant Management System V1.0 in Excel


Reviews
There are no reviews yet.