

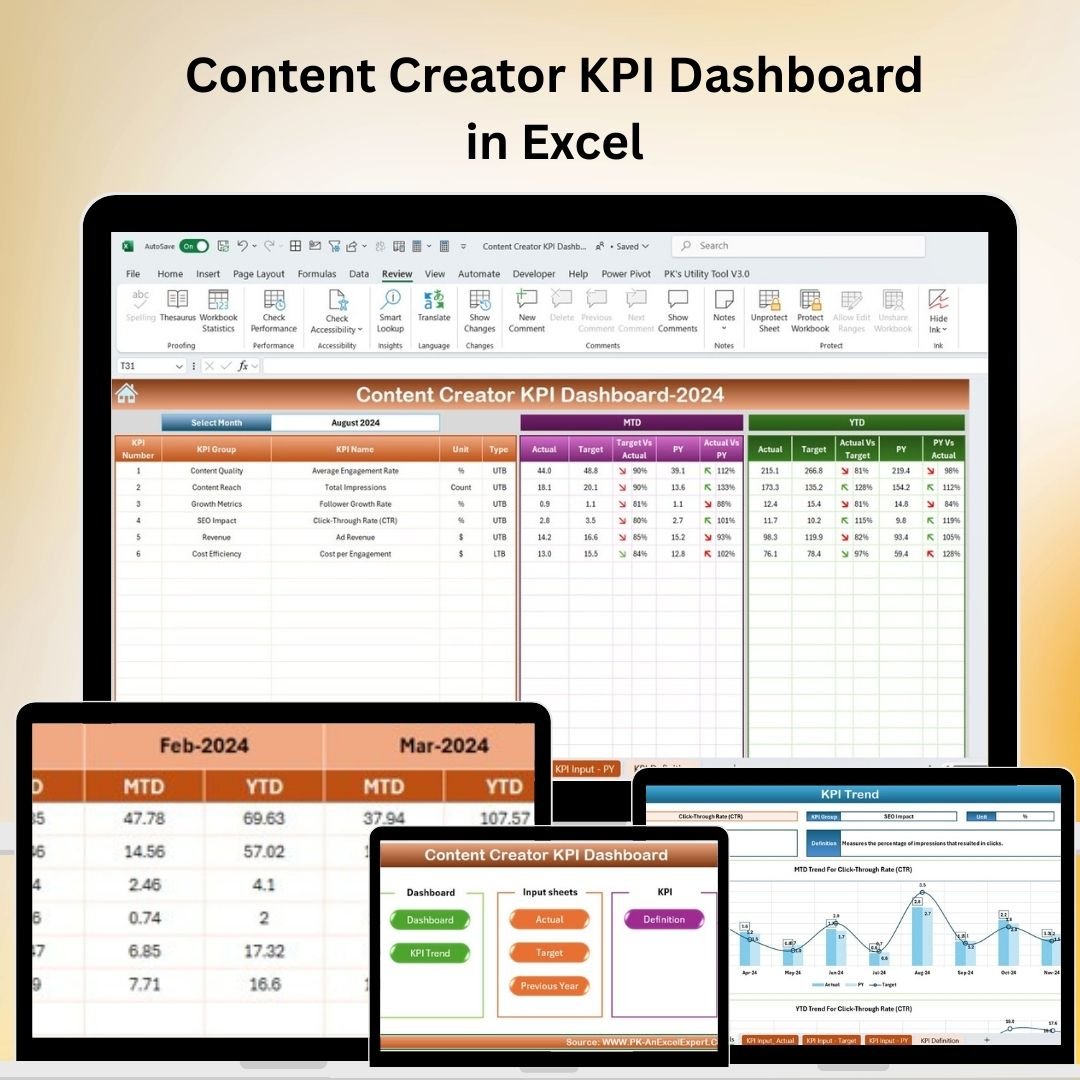
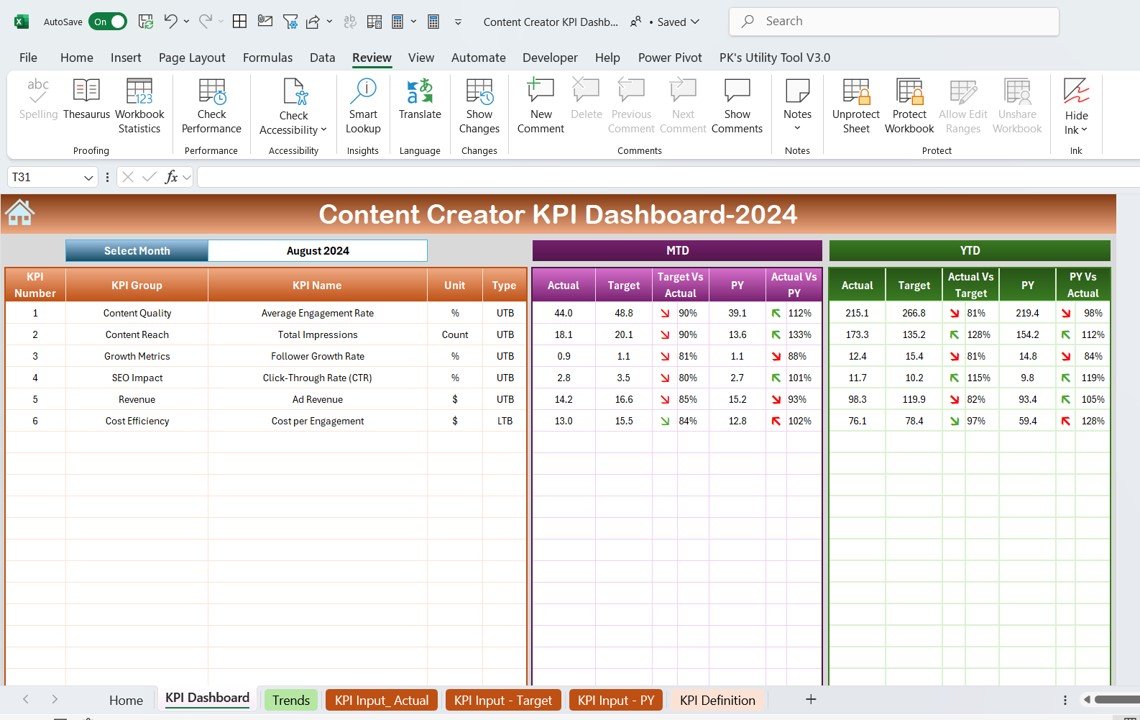


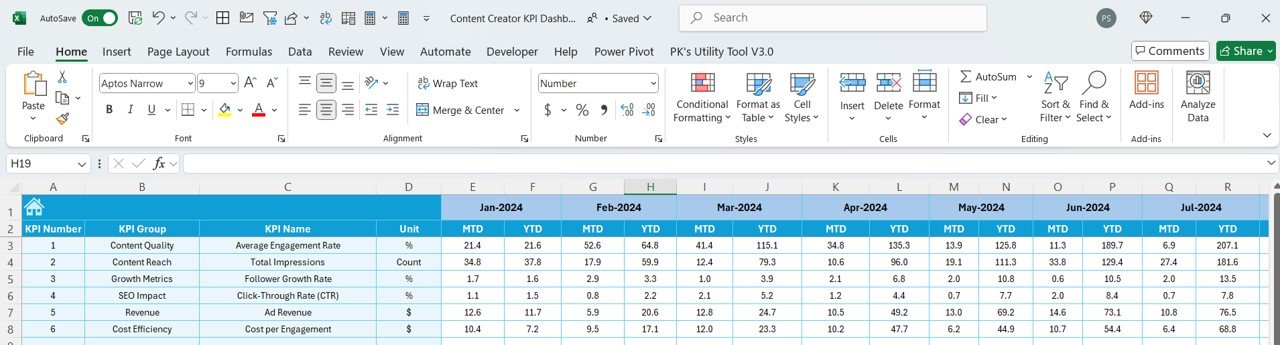
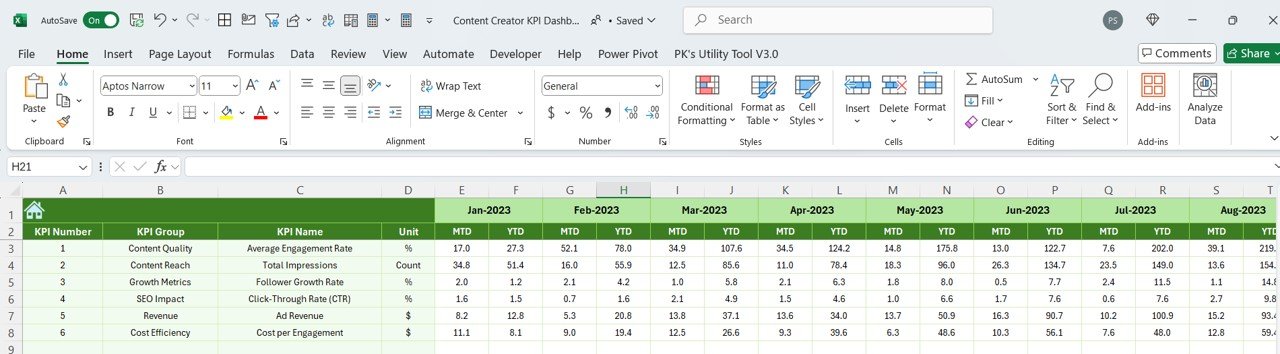
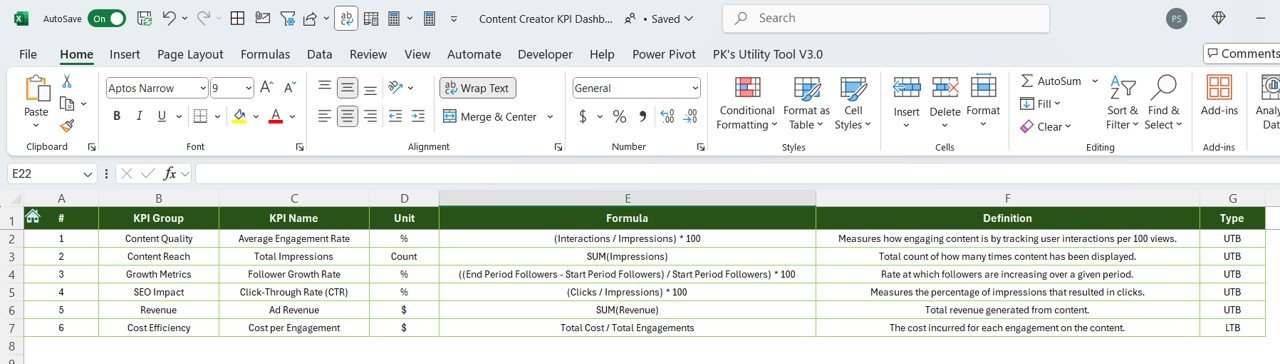

The Content Creator KPI Dashboard in Excel is an essential tool designed to help content creators, influencers, and digital marketing teams track their performance and optimize content strategies. This Excel-based dashboard provides valuable insights into key performance indicators (KPIs) such as engagement rates, follower growth, content views, and revenue generated from content, making it easier to monitor and improve your content creation efforts.
Whether you’re a YouTuber, blogger, social media influencer, or any other type of content creator, this dashboard offers the real-time tracking and analysis you need to make data-driven decisions. From measuring the impact of each post to tracking long-term growth trends, the dashboard helps you stay on top of all aspects of your content creation business.
Key Features of the Content Creator KPI Dashboard in Excel
📊 Engagement Tracking
Monitor the performance of your content by tracking engagement metrics like likes, comments, shares, and interactions. Analyze which types of posts are resonating with your audience and generating the most engagement.
📈 Follower & Subscriber Growth
Track the growth of your social media followers, subscribers, or email list. Monitor trends in your audience growth to help optimize your content strategy and expand your reach.
💸 Revenue Tracking
Monitor the revenue generated from different content sources, including ads, affiliate marketing, sponsorships, and product sales. Track which revenue streams are most profitable and align your content strategy accordingly.
⏱ Content Performance by Platform
Track the performance of your content across various platforms such as YouTube, Instagram, TikTok, or your blog. This feature allows you to compare the performance of different content types and identify the most effective platforms for your audience.
📅 Time-Based Analysis
Analyze the performance of your content over time—daily, weekly, or monthly. This time-based performance tracking helps you assess the effectiveness of content campaigns and measure long-term growth.
⚙️ Customizable KPIs & Metrics
Customize the dashboard to fit your specific content creation goals. Whether you’re tracking video views, website traffic, or social media clicks, tailor the dashboard to reflect your business objectives.
Why You’ll Love the Content Creator KPI Dashboard in Excel

✅ Track Engagement & Growth
Monitor key engagement metrics, audience growth, and content performance across various platforms in one place. Make informed decisions on what type of content to create next based on real-time data.
✅ Optimize Content Strategy
Identify which content types are most effective in driving engagement, growing your audience, and generating revenue. Use insights to refine your content creation strategy and improve results.
✅ Monitor Revenue Streams
Track revenue generated from different sources such as brand deals, affiliate links, and ads, so you can make decisions that maximize profitability.
✅ Easy-to-Use & Customizable
This Excel dashboard is easy to use and fully customizable to meet your specific needs as a content creator. Adjust KPIs and data tracking to suit your content goals and business model.
✅ Analyze Long-Term Trends
Monitor your content’s performance over time with time-based analysis. Track audience growth, engagement trends, and revenue growth to assess long-term success.
What’s Inside the Content Creator KPI Dashboard in Excel?
Engagement Tracking: Track likes, comments, shares, and other engagement metrics.
Follower & Subscriber Growth: Monitor growth across platforms like Instagram, YouTube, and email.
Revenue Tracking: Track income from various content sources, such as ads and affiliate marketing.
Platform Performance Analysis: Compare content performance across multiple platforms.
Time-Based Performance Analysis: Analyze engagement and growth over different time periods.
Customizable KPIs: Tailor the dashboard to track the specific metrics most important to you.
How to Use the Content Creator KPI Dashboard in Excel
1️⃣ Download the Template: Access the Content Creator KPI Dashboard in Excel instantly.
2️⃣ Input Your Content Data: Add your engagement, follower, revenue, and content performance data.
3️⃣ Track KPIs & Performance: Monitor key metrics such as engagement, follower growth, and revenue generation.
4️⃣ Analyze Time-Based Trends: Use time-based tracking to assess long-term content performance.
5️⃣ Optimize Your Strategy: Use the insights from the dashboard to refine your content strategy and grow your online presence.
Who Can Benefit from the Content Creator KPI Dashboard in Excel?
🔹 YouTubers & Vloggers
🔹 Social Media Influencers (Instagram, TikTok, Twitter)
🔹 Bloggers & Content Writers
🔹 Affiliate Marketers & Entrepreneurs
🔹 Digital Marketing Teams
🔹 E-commerce Brands Using Content Marketing
🔹 Content Creators in Various Niches (Gaming, Fitness, Fashion, etc.)
Optimize your content creation efforts with the Content Creator KPI Dashboard in Excel. Track engagement, monitor growth, analyze performance, and make data-driven decisions to succeed in the digital world.
Click here to read the Detailed blog post
Visit our YouTube channel to learn step-by-step video tutorials
Youtube.com/@PKAnExcelExpert






























Reviews
There are no reviews yet.