


Digital Curriculum Startups Dashboard in Power BI gives EdTech founders, curriculum operators, investor analysts, and education teams a ready-made Power BI report for tracking revenue, licenses, cost, renewal rate, net profit, active learners, module completion, delivery platforms, acquisition channels, and regional performance. The template includes 5 report pages, 5 executive KPI cards, 15+ chart views, and slicers for quick filtering. Join 8,400+ teams in 40+ countries using NextGenTemplates to replace recurring reporting builds with one-time purchase Excel, Google Sheets, Power BI, and HTML templates.
Instant download. One-time payment. No subscription. No per-user template fee. Lifetime access.
Key Features of Digital Curriculum Startups Dashboard in Power BI
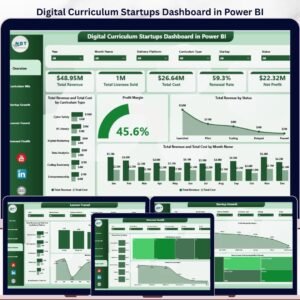
- 5 KPI cards: Total Revenue, Total Licenses Sold, Total Cost, Renewal Rate, and Net Profit.
- 5 report pages: Overview Page, Curriculum Mix, Startup Growth, Learner Funnel, and Renewal Health.
- Interactive slicers: Filter the dashboard quickly by available startup, curriculum, platform, region, month, quarter, channel, and status fields.
- Power BI visuals: Compare revenue, cost, margin, renewals, learners, completion, startup performance, and delivery patterns.
- Editable .pbix report: Customize visuals, fields, labels, measures, colors, and source connections in Power BI Desktop.
- Education startup focus: Built for digital curriculum businesses that need clearer reporting across commercial, learner, and renewal signals.
What’s Inside the Digital Curriculum Startups Dashboard in Power BI
1. Overview Page
The Overview Page gives leadership a high-level snapshot through Total Revenue, Total Licenses Sold, Total Cost, Renewal Rate, and Net Profit cards. It is built for founder updates, management meetings, investor reporting, and quick performance reviews.
Total Revenue and Total Cost by Curriculum Type compares commercial performance across curriculum categories, making it easier to spot content lines with stronger economics. Profit Margin shows profitability in percentage form so teams can review efficiency, not only revenue volume.
Total Revenue by Status breaks revenue across status groups, helping users understand how pipeline, active, renewed, or closed records affect results. Total Revenue and Total Cost by Month Name shows monthly movement so finance and operations teams can monitor cost pressure over time.

2. Curriculum Mix
The Curriculum Mix page helps users compare startup contribution, curriculum categories, and learner engagement. Total Revenue and Total Cost by Startup shows which startups are generating revenue and how much cost is required to support them.
Total Active Learners by Curriculum Type highlights which curriculum categories attract the most learner activity. Module Completion Rate by Curriculum Type compares completion strength across curriculum lines and helps product teams identify content that may need improvement.

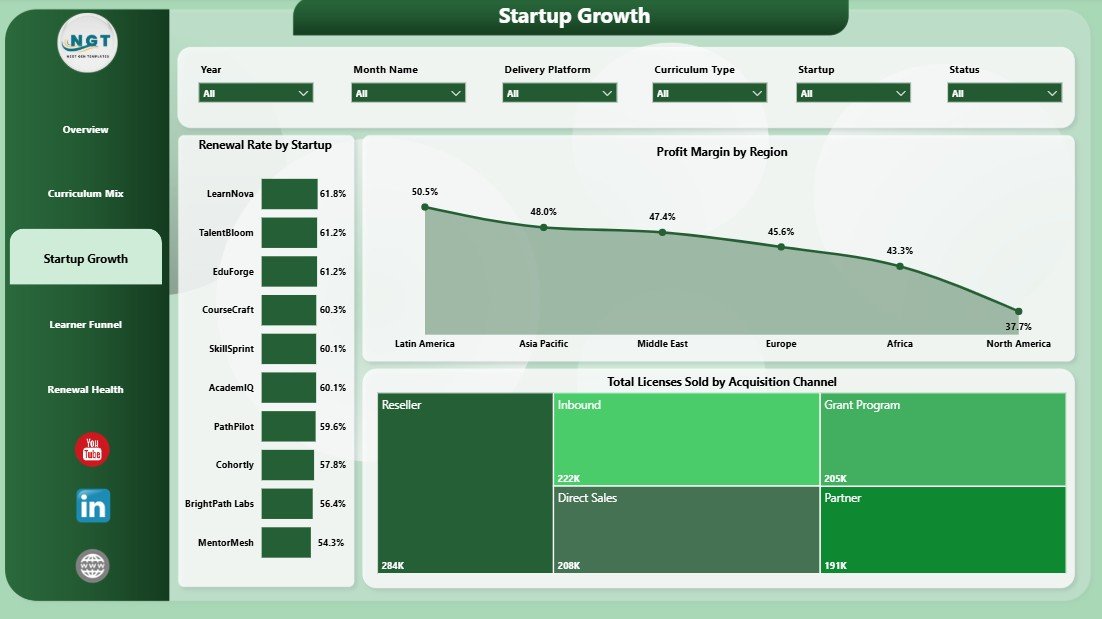
3. Startup Growth
The Startup Growth page focuses on renewal, profitability, and acquisition performance. Renewal Rate by Startup helps teams see which startups retain customers or learners more reliably.
Profit Margin by Region compares efficiency across regions and separates high-revenue areas from truly profitable ones. Total Licenses Sold by Acquisition Channel shows where licenses are coming from, helping teams evaluate marketing, partnerships, sales, and referral channels.
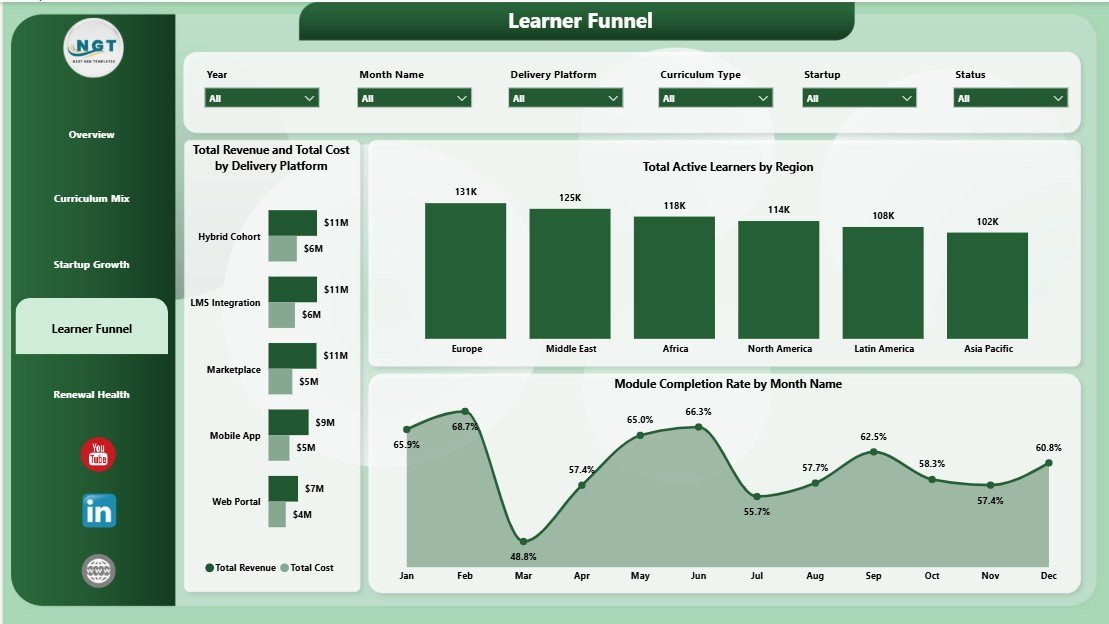
4. Learner Funnel
The Learner Funnel page connects delivery platforms, active learners, regions, and completion movement. Total Revenue and Total Cost by Delivery Platform compares the financial profile of each platform or delivery model.
Total Active Learners by Region shows where learner engagement is strongest geographically. Module Completion Rate by Month Name helps curriculum teams understand whether completion improves, weakens, or stays steady across the reporting period.

5. Renewal Health
The Renewal Health page is designed for retention, customer success, and finance review. Renewal Rate by Region shows which geographic markets renew more consistently and where churn risk may need attention.
Profit Margin by Quarter tracks profitability across the year and supports quarterly business reviews. The repeated Renewal Rate by Region view reinforces regional retention analysis for teams that want renewal health visible from more than one angle.

Digital Curriculum Startups Dashboard in Power BI vs. Tableau vs. Paid Education SaaS – Where This Fits
| Feature | This Power BI Dashboard | Tableau Alternative | Paid Education SaaS |
|---|---|---|---|
| Cost | $17.99 one-time | Separate license and build cost | Monthly or annual subscription |
| Platform | Power BI Desktop | Tableau Desktop or Cloud | Vendor-hosted platform |
| Setup time | Open .pbix and replace source data | Build model and visuals | Implementation and onboarding |
| Real-time team collaboration | Available after publishing to Power BI Service | Available through Tableau Cloud or Server | Usually included |
| Mobile access | Power BI mobile after publishing | Tableau mobile after publishing | Vendor app or browser |
| Customizable fields | Editable report and model | Editable with Tableau skills | Limited by vendor settings |
| Share with link | Possible through Power BI Service | Possible through Tableau Cloud | Login controlled |
| Year-1 cost at 5 users | $17.99 plus any Microsoft licensing | Often much higher after licenses | Often hundreds or thousands |
| Curriculum startup views | Built in across 5 pages | Must be designed | Usually generic unless configured |
Who This Template Is For – and Who It’s Not For
This template is for digital curriculum founders, EdTech startup operators, curriculum product managers, online learning platform teams, education investors, accelerators, customer success managers, and analysts who need a Power BI reporting layer for curriculum performance, revenue, cost, licenses, renewals, and learner engagement.
It is not a learning management system, CRM, payment processor, student information system, or live product analytics platform. It works best when your source data is prepared and ready to connect, refresh, or import into Power BI.
How to Use the Digital Curriculum Startups Dashboard in Power BI
- Download and unzip the file.
- Open the .pbix file in Power BI Desktop.
- Replace the sample source with your own curriculum startup data.
- Refresh the report and validate the KPI totals.
- Use slicers to review startup, region, curriculum, platform, channel, month, quarter, and status performance.
- Publish to Power BI Service only when your sharing permissions and data privacy rules are ready.
Real-World Use Cases
Ana, EdTech founder: Ana uses the Overview and Startup Growth pages before investor updates to explain revenue, licenses, cost, net profit, acquisition channels, and renewal health.
Rahul, curriculum product manager: Rahul reviews Curriculum Mix and Learner Funnel pages to compare active learners, module completion, and platform economics by curriculum type.
Maya, education portfolio analyst: Maya uses Renewal Health to compare renewal rate and profit margin across regions and quarters before preparing portfolio notes.
Frequently Asked Questions
What does this Power BI dashboard track?
It tracks revenue, licenses sold, cost, renewal rate, net profit, active learners, module completion rate, profit margin, curriculum type, startup, platform, region, acquisition channel, month, quarter, and status.
How many report pages are included?
The dashboard includes 5 pages: Overview Page, Curriculum Mix, Startup Growth, Learner Funnel, and Renewal Health.
Do I need Power BI Desktop?
Yes. Open the .pbix file in Power BI Desktop, update the data source, and refresh the visuals.
Can I customize the dashboard?
Yes. You can edit visuals, fields, measures, page layouts, colors, labels, and data connections inside Power BI Desktop.
Can this replace my LMS or CRM?
No. This is a reporting dashboard, not a learner management, CRM, billing, or content authoring system.
Can I publish it to Power BI Service?
Yes, if your Microsoft account and organizational permissions allow it. Check data privacy and sharing settings before publishing.
About the Author
Built by PK – Microsoft Certified Professional with 15+ years of Excel, Google Sheets, and Power BI experience. Founder of NextGenTemplates, reaching 300K+ subscribers across YouTube channels. Every template is hand-built and tested before release.
Explore Related Templates
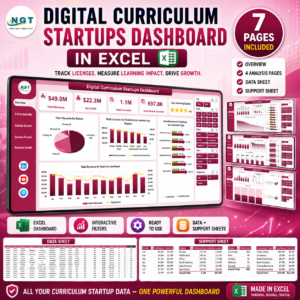
Related templates include Digital Curriculum Startups Dashboard in Excel, Career Mentorship Platforms Dashboard in Power BI, and Continuing Education Programs KPI Dashboard in Excel. You can also browse Power BI Templates and Power BI Dashboard Templates.
Download the Digital Curriculum Startups Dashboard in Power BI today and turn curriculum startup data into clear, refreshable Power BI reporting.
Last updated: June 2026


Reviews
There are no reviews yet.