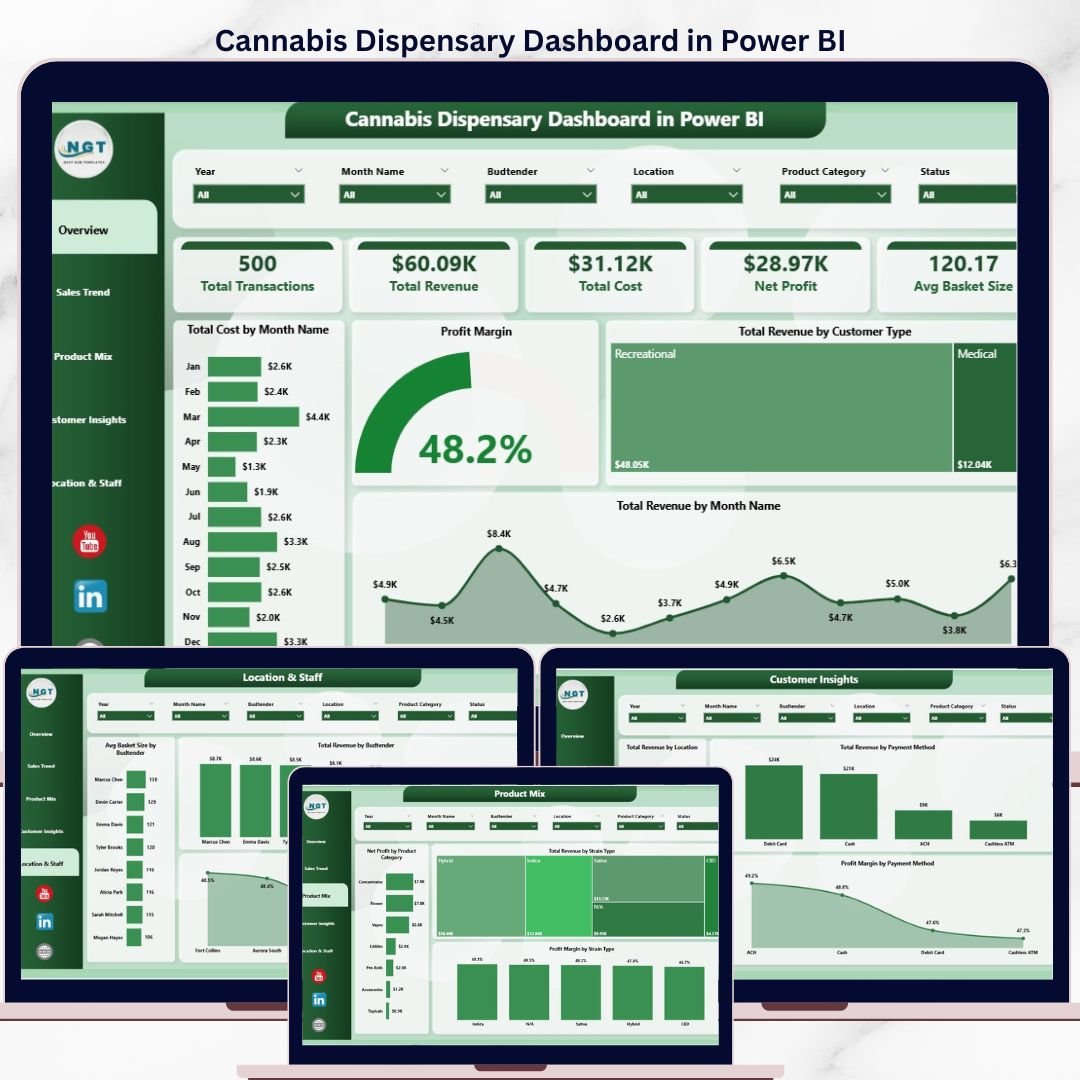
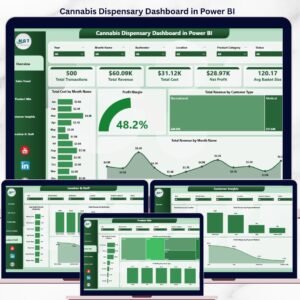
The Cannabis Dispensary Dashboard in Power BI tracks 5 high-impact KPIs (Total Transactions, Total Revenue, Total Cost, Net Profit, Avg Basket Size) across 5 interactive report pages, with 13 pre-built visuals and slicer-driven filters for date, location, strain type, and budtender. Setup takes under 10 minutes — connect your dispensary POS export to the .pbix file and every page refreshes automatically.
🌍 Join 8,400+ teams in 40+ countries using NextGenTemplates to replace expensive cannabis BI subscriptions with one-time-purchase Excel, Google Sheets, Power BI, and HTML templates.
✅ Instant download · One-time payment · No subscription · No per-user fees · Lifetime access
🔑 Key Features of the Cannabis Dispensary Dashboard in Power BI
📊 5 Interactive Report Pages – Overview, Sales Trend, Product Mix, Customer Insights, and Location & Staff — each with focused slicers and visuals tailored to dispensary decisions.
🌿 Strain-Level Profitability – Compare Total Revenue and Profit Margin across strain types (Indica, Sativa, Hybrid, CBD) to identify which categories drive the most margin per transaction.
👥 Budtender Performance Tracking – Avg Basket Size by Budtender and Total Revenue by Budtender visuals reveal which staff drive upsell behavior and where coaching can lift basket size.
💰 Net Profit by Month and Quarter – Built-in time intelligence shows revenue, cost, and profit trends so dispensary owners can plan inventory buys around peak weeks.
🏪 Multi-Location Comparison – Total Revenue by Location and Profit Margin by Location compare store-level performance side-by-side, useful for chains running 2-10 dispensaries.
💳 Payment Method Breakdown – See revenue and margin by Cash, Debit, ACH, or third-party processor — critical in a cash-heavy regulated industry where payment costs squeeze margins.
🔄 Slicer-Driven Filtering – Filter every visual by date range, customer type, location, payment method, or strain type with one click. Slicers persist across pages.
📥 Plug-and-Play Data Model – Replace the sample transactions table with your POS export (CSV or Excel) and refresh — no DAX rewriting needed.
📦 What’s Inside the Cannabis Dispensary Dashboard in Power BI
The .pbix file contains 5 fully-built report pages, each focused on a distinct dispensary decision area. Below is a page-by-page breakdown.
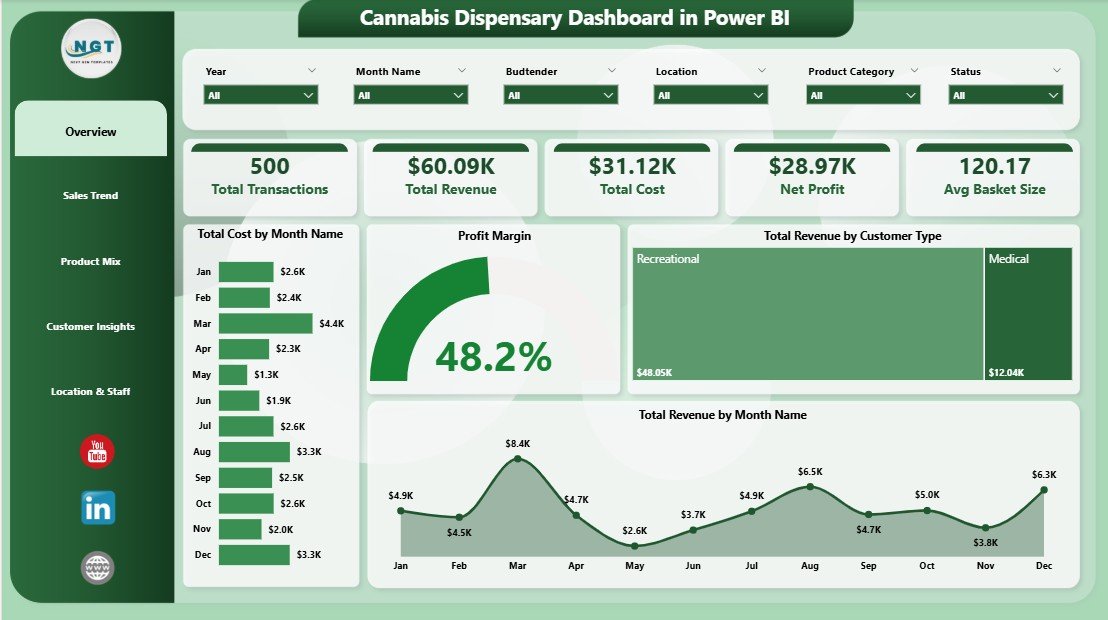
1. Overview Page
The Overview page is the executive summary. Five KPI cards at the top show Total Transactions, Total Revenue, Total Cost, Net Profit, and Avg Basket Size, with multiple slicers for date, location, customer type, and strain.
The page includes the following analyses:
📈 Total Cost by Month Name — A monthly cost trend so you can see when COGS spikes (often around 4/20 promotions or holiday inventory builds).
📊 Profit Margin — The headline margin gauge for the filtered period, the single number every dispensary owner watches first.
👥 Total Revenue by Customer Type — Revenue split between New, Returning, Medical, and Recreational customers to show which segment is fueling growth.
📅 Total Revenue by Month Name — Month-over-month revenue trend that pairs with the cost chart to give a quick visual on margin direction.
Cannabis Dispensary Dashboard in Power BI
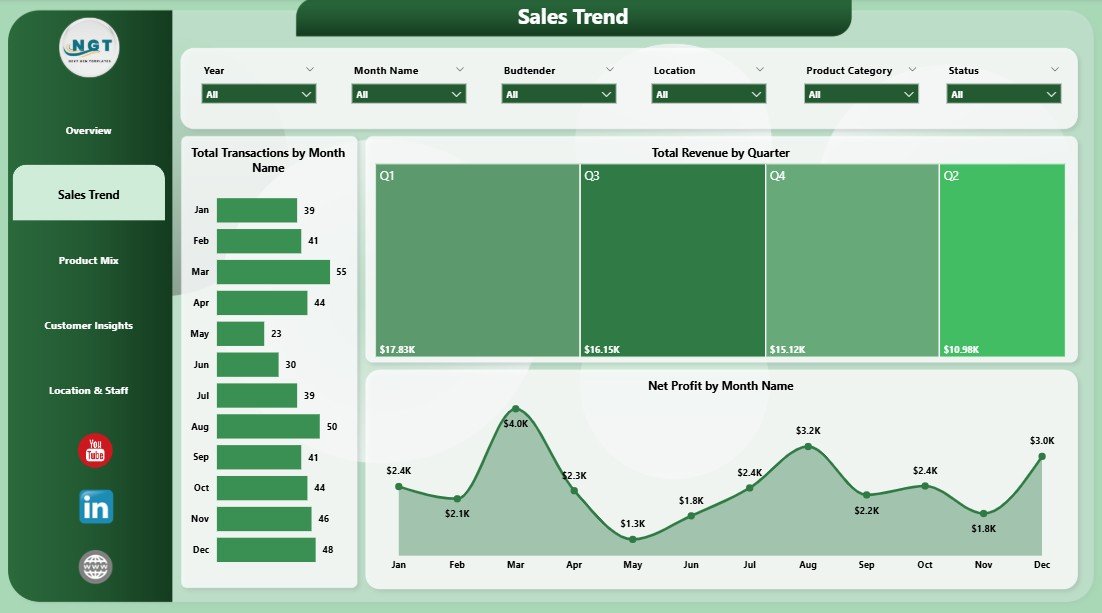
2. Sales Trend Page
This page is for finance and operations leads who need to spot momentum and seasonality.
📊 Total Transactions by Month Name — Volume trend that shows whether top-line growth is driven by more visits or higher basket size.
💵 Total Revenue by Quarter — Quarterly view that smooths out monthly noise and lines up cleanly with regulatory reporting cycles.
📉 Net Profit by Month Name — The bottom-line trend, useful for catching margin compression early.
Sales Trend
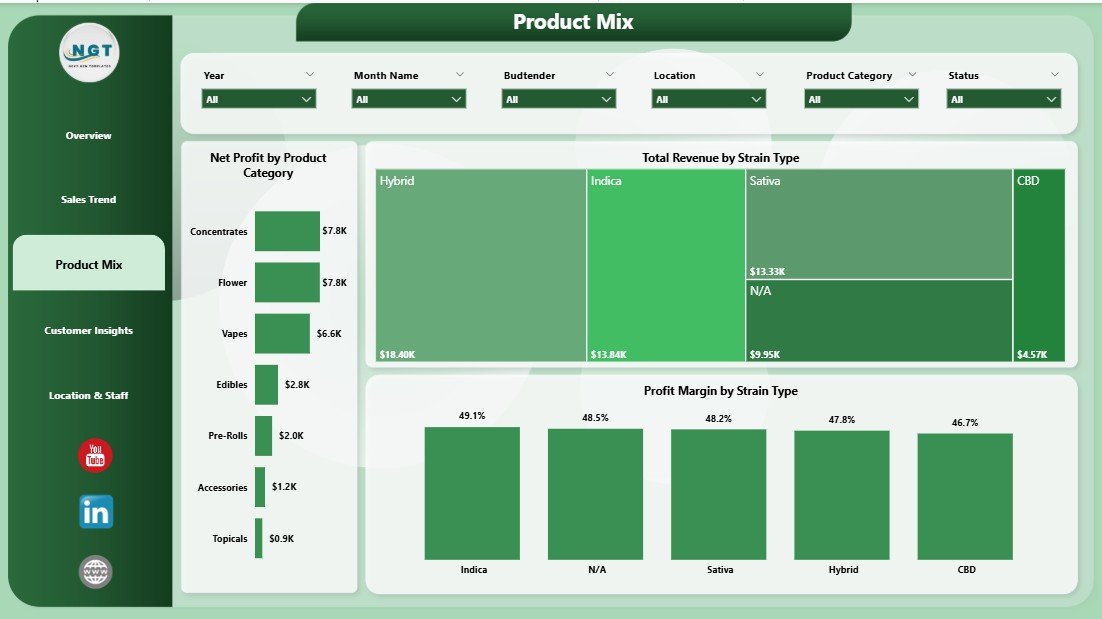
3. Product Mix Page
The Product Mix page is built for buyers and category managers deciding what to stock more of.
🌿 Net Profit by Product Category — Compares Flower, Edibles, Pre-Rolls, Concentrates, Vapes, and Accessories on bottom-line contribution rather than just revenue.
🌱 Total Revenue by Strain Type — Indica vs. Sativa vs. Hybrid vs. CBD revenue split so you can see how preferences shift across seasons.
📐 Profit Margin by Strain Type — Margin view of the same split, often surprising — high revenue strains are not always the highest margin.
Product Mix
4. Customer Insights Page
This page connects geography and payment behavior to the customer base.
🗺️ Total Revenue by Location — Store-by-store revenue ranking so multi-store operators can see which dispensary is pulling the most weight.
💳 Total Revenue by Payment Method — Cash vs. debit vs. ACH vs. cashless ATM split, important in a regulated industry where banking access is uneven.
📊 Profit Margin by Payment Method — Highlights which payment channels eat the most into margin once processing fees are included.
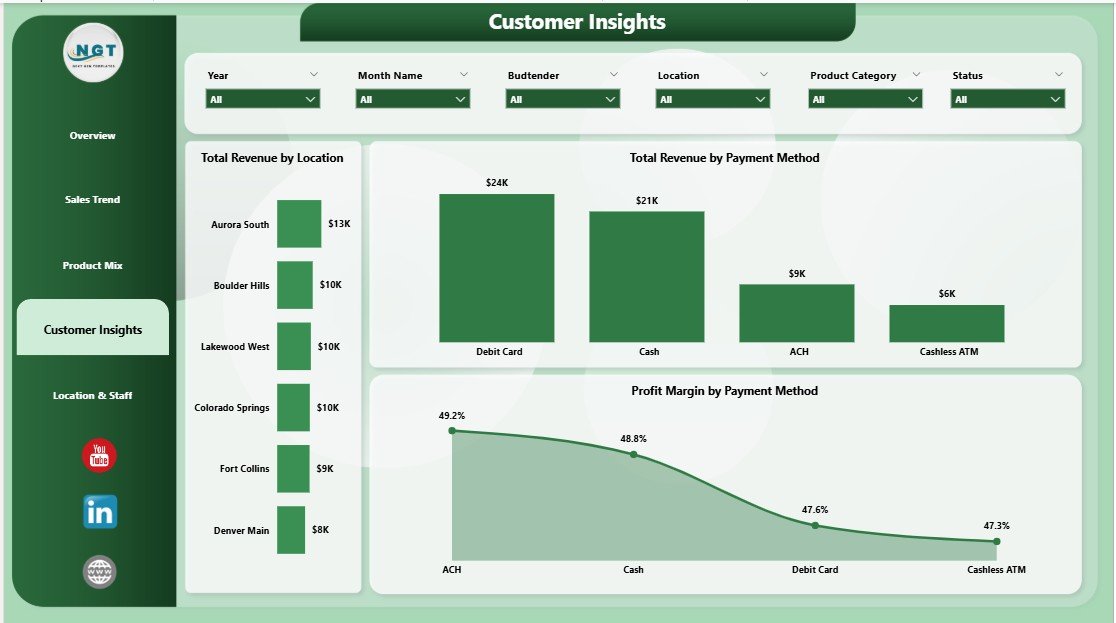
Customer Insights
5. Location & Staff Page
The final page is built for store managers and HR / training leads.
🛒 Avg Basket Size by Budtender — Identifies who consistently lifts ticket size through education and upsell — the people you want training new hires.
💼 Total Revenue by Budtender — Revenue contribution by staff, useful for performance reviews and incentive plans.
🏪 Profit Margin by Location — Margin comparison across stores that often reveals rent, staffing, or local pricing pressure invisible at the revenue level.
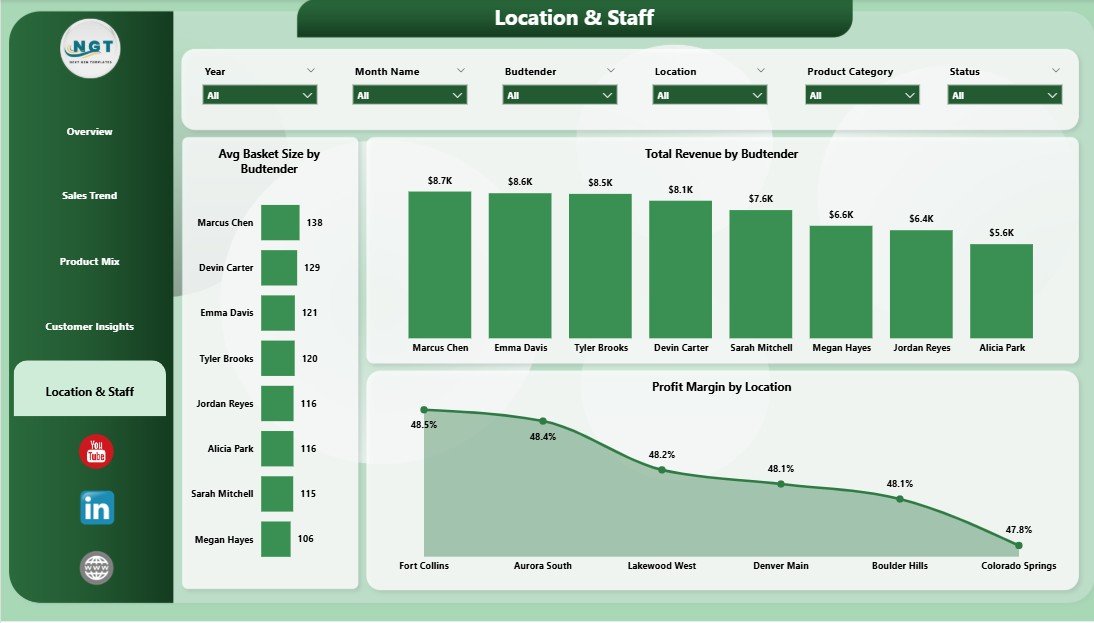
Location & Staff
📊 Cannabis Dispensary Dashboard in Power BI vs. Tableau / Qlik vs. Paid Cannabis BI Tools — Where This Fits
| Feature | Cannabis Dispensary Dashboard in Power BI | Tableau / Qlik Custom Build | Headset / Flowhub Analytics |
|---|---|---|---|
| Cost | $17.99 one-time | $70/user/month + build cost | $300-1,500/month per location |
| Platform | Power BI Desktop (free) | Tableau / Qlik Sense | Vendor-locked SaaS |
| Setup time | Under 10 minutes | 2-6 weeks dev | 1-2 weeks onboarding |
| Strain & budtender views | ✅ Pre-built | ❌ Build from scratch | ✅ But locked to vendor data |
| Customizable DAX & visuals | ✅ Full edit | ✅ Full edit | ❌ Vendor templates only |
| Works with any POS export | ✅ CSV/Excel | ✅ But needs ETL | ❌ Pre-integrated POS only |
| Mobile / Power BI Service | ✅ Publish to web/mobile | ✅ | ✅ |
| Year-1 cost at 5 users | $17.99 total | $4,200+ | $3,600-$18,000 |
For dispensary operators who want strain-level and budtender-level analytics without paying $300+ per month per store, the Cannabis Dispensary Dashboard in Power BI sits in the sweet spot.
👥 Who This Template Is For — and Who It’s Not For
✅ This template is built for:
- Single-store dispensary owners who export sales from Dutchie, Treez, Cova, or Flowhub and want analytics without the SaaS bill
- Multi-location cannabis chains running 2-10 stores who need a side-by-side location comparison
- Cannabis CFOs and bookkeepers preparing monthly P&L and IRC 280E-aware margin reports
- Cannabis consultants who want a polished, brandable client deliverable in Power BI
- Dispensary general managers running weekly performance reviews with budtender teams
❌ This template is NOT for:
- Operators who need real-time POS-integrated dashboards (this is refresh-based, not live-streaming)
- Cultivation-only or processor-only businesses — the data model is dispensary-side (transactions, basket, budtender)
- Teams without Power BI Desktop installed (it is a free download from Microsoft, but it is required)
- Enterprise MSOs needing METRC seed-to-sale traceability — that is a separate compliance system
⚙️ How to Use the Cannabis Dispensary Dashboard in Power BI
1️⃣ Install Power BI Desktop — Free download from Microsoft Learn. Windows 10/11 only.
2️⃣ Open the .pbix file — Double-click after unzipping the download.
3️⃣ Replace the sample data — In Transform Data, point the source to your POS export (CSV or Excel) and match column names.
4️⃣ Click Refresh — All 5 pages update automatically with your transactions.
5️⃣ Use slicers to filter — Click slicers on the Overview to filter every page by date, location, strain, or customer type.
6️⃣ Publish to Power BI Service (optional) — Sign in with a free Microsoft account and share read-only links with your team.
💼 Real-World Use Cases
Marcus owns a single-store dispensary in Denver. He uses the Cannabis Dispensary Dashboard in Power BI every Monday to review the previous week — Total Revenue by Day, Avg Basket Size by Budtender, and Profit Margin by Strain Type. He stopped paying $349/month for a third-party analytics SaaS after the first refresh worked.
Lena runs operations for a 4-store cannabis chain in Michigan. She uses the Profit Margin by Location and Total Revenue by Location visuals to run her weekly GM call. The slicer-based filter lets her drill into a single store without rebuilding the report, which used to take her analyst 90 minutes per week.
Devon is an independent cannabis consultant. He delivers this template to retail clients with their data already loaded, charges a setup fee, and uses the time he used to spend building Tableau dashboards on actual margin work. He has shipped the template to 6 clients in the past quarter.
❓ Frequently Asked Questions
What KPIs does the Cannabis Dispensary Dashboard in Power BI track?
The Cannabis Dispensary Dashboard in Power BI tracks 5 headline KPIs — Total Transactions, Total Revenue, Total Cost, Net Profit, and Avg Basket Size — plus 13 supporting visuals across strain type, customer type, location, payment method, and budtender. All metrics update automatically when you refresh the data source.
How does this compare to Headset or Flowhub Analytics?
Headset and Flowhub Analytics are vendor-locked SaaS subscriptions starting around $300 per month per location. The Cannabis Dispensary Dashboard in Power BI is a one-time $17.99 .pbix file that works with any POS export. You give up real-time streaming; you keep full DAX editability and avoid recurring fees.
How long does setup take?
Setup takes under 10 minutes for most users. You install Power BI Desktop (free), open the .pbix, point Transform Data at your POS export CSV, match the column names, and click Refresh. The Cannabis Dispensary Dashboard in Power BI ships with sample data so you can preview every page before connecting your own.
Will this work with Dutchie, Treez, Cova, or Flowhub data?
Yes — the Cannabis Dispensary Dashboard in Power BI accepts any flat CSV or Excel export with transaction-level data. As long as your POS lets you export sales by transaction with date, location, strain type, payment method, budtender, cost, and revenue columns, the model maps cleanly.
Can I customize the visuals or add new pages?
Yes — the file is a fully open .pbix with no locked elements. You can edit DAX measures, change colors, add new pages, swap visuals, and republish. The Cannabis Dispensary Dashboard in Power BI is a starting point, not a sealed product.
Do I need a Power BI Pro license?
No — Power BI Desktop is free and runs the entire Cannabis Dispensary Dashboard in Power BI locally. A Pro license ($14/user/month) is only required if you want to publish to Power BI Service and share interactive reports inside an organization.
Is this dashboard 280E-aware for cannabis tax reporting?
The Cannabis Dispensary Dashboard in Power BI separates Cost of Goods Sold from operating costs at the transaction level, which is the foundation for IRC 280E reporting. It is a management dashboard, not a tax filing — pair it with your CPA for actual return preparation.
👤 About the Author
Built by PK — Microsoft Certified Professional with 15+ years of Excel, Google Sheets, and Power BI experience. Founder of NextGenTemplates, reaching 300K+ subscribers across YouTube channels (@PK-AnExcelExpert, @NextGenTemplates, @NeoTechNavigators). Every template is hand-built and tested before release.
🔗 Explore Related Templates
🌿 Also available as: Cannabis Dispensary Dashboard in Excel — same KPIs, native pivot-table workflow.
📊 Browse more Power BI Dashboard Templates on NextGenTemplates.
🎯 Related Power BI dashboards you may like:
- Museum Dashboard in Power BI — visitor and revenue analytics for cultural venues.
- Oil and Gas Analysis Dashboard in Power BI — operational analytics for energy operators.
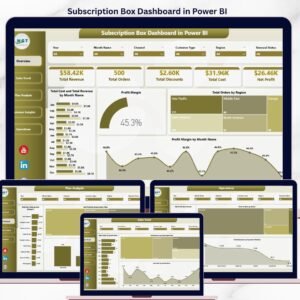
- Subscription Box Dashboard in Power BI — subscriber retention and MRR analytics.
- Yoga Wellness Studio Dashboard in Power BI — small-format retail wellness analytics.
📖 Click here to read the Detailed Blog Post
🎥 Visit our YouTube channel for step-by-step video tutorials
👉 YouTube.com/@NextGenTemplates
📅 Last updated: May 2026


Reviews
There are no reviews yet.