



The blockchain and cryptocurrency industry never sleeps. Prices fluctuate every second, transaction volumes shift rapidly, and network performance constantly evolves. However, tracking all this data using scattered spreadsheets or manual reports often leads to confusion, missed opportunities, and delayed decisions.
That is exactly why the Blockchain & Cryptocurrency KPI Scorecard in Excel is a must-have performance tracking tool for crypto professionals, analysts, and blockchain teams.
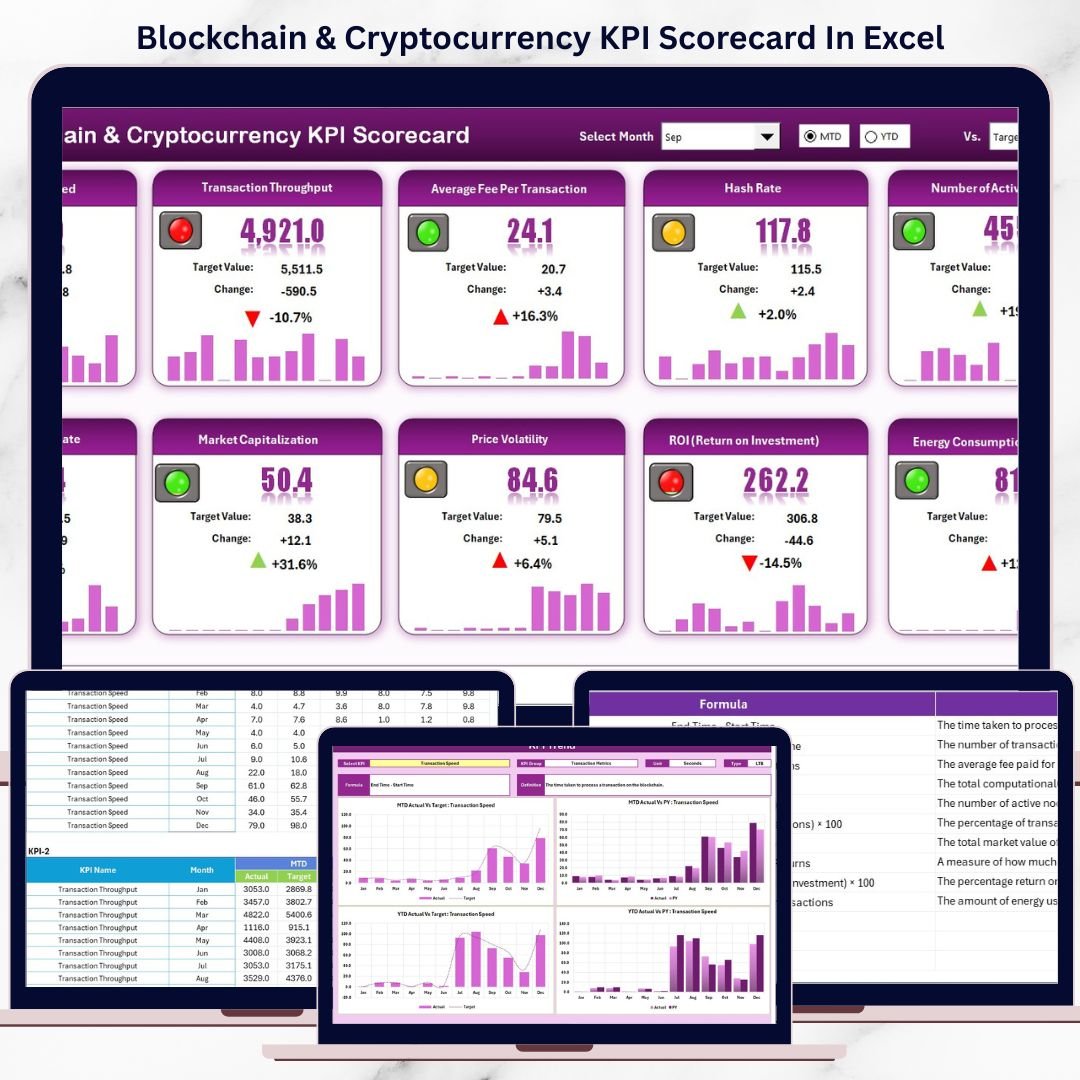
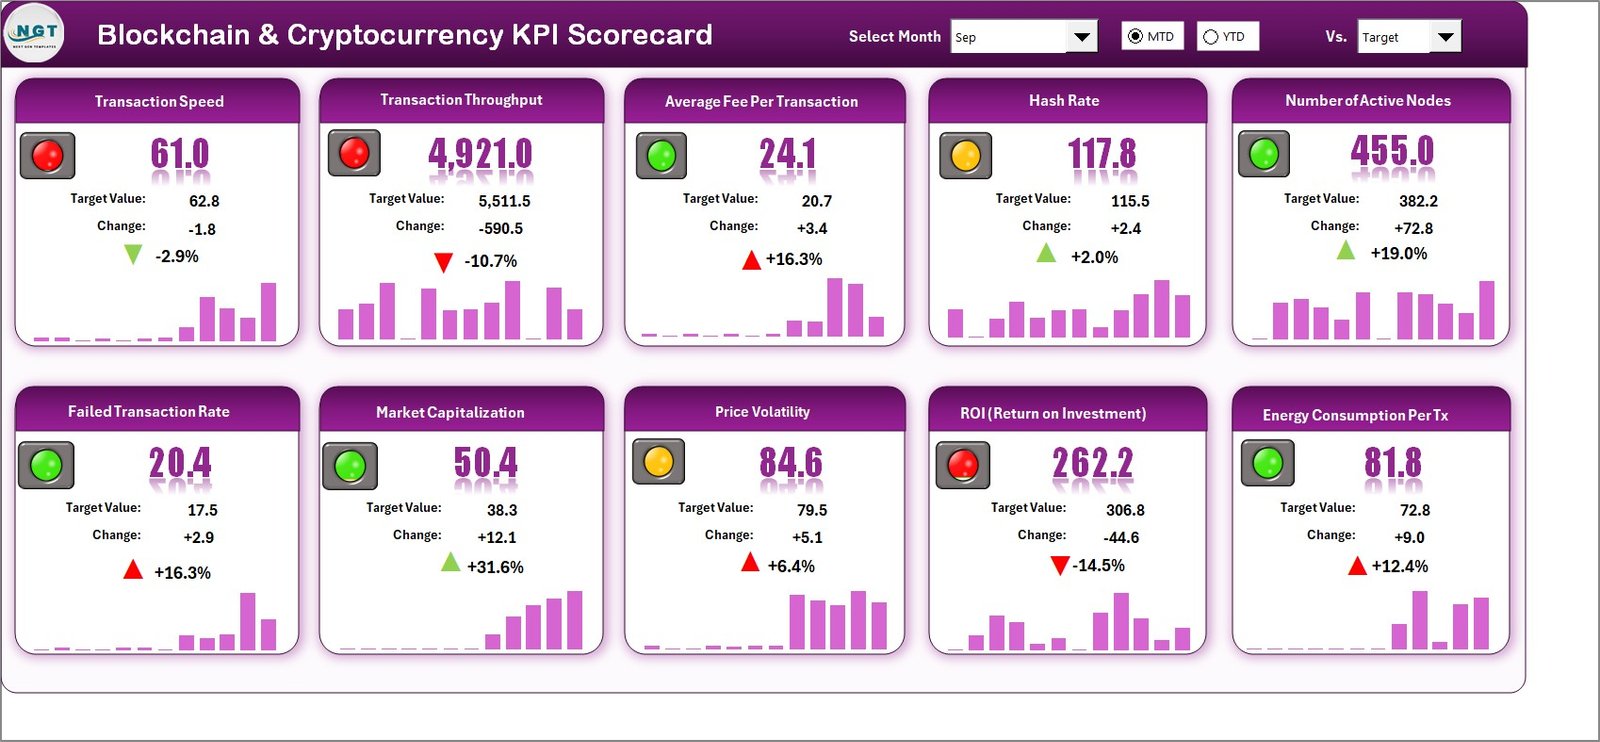
This ready-to-use Excel scorecard helps you monitor, analyze, and control key blockchain and cryptocurrency KPIs from one centralized dashboard. Instead of juggling multiple reports, you get a clean, structured, and visual scorecard that instantly shows how your KPIs are performing against targets.
## 🚀 Key Features of Blockchain & Cryptocurrency KPI Scorecard in Excel
✅ Centralized KPI Monitoring – Track all blockchain and crypto KPIs in one Excel file
📊 Actual vs Target Analysis – Instantly compare real performance with planned goals
📅 MTD & YTD Tracking – Measure Month-to-Date and Year-to-Date performance effortlessly
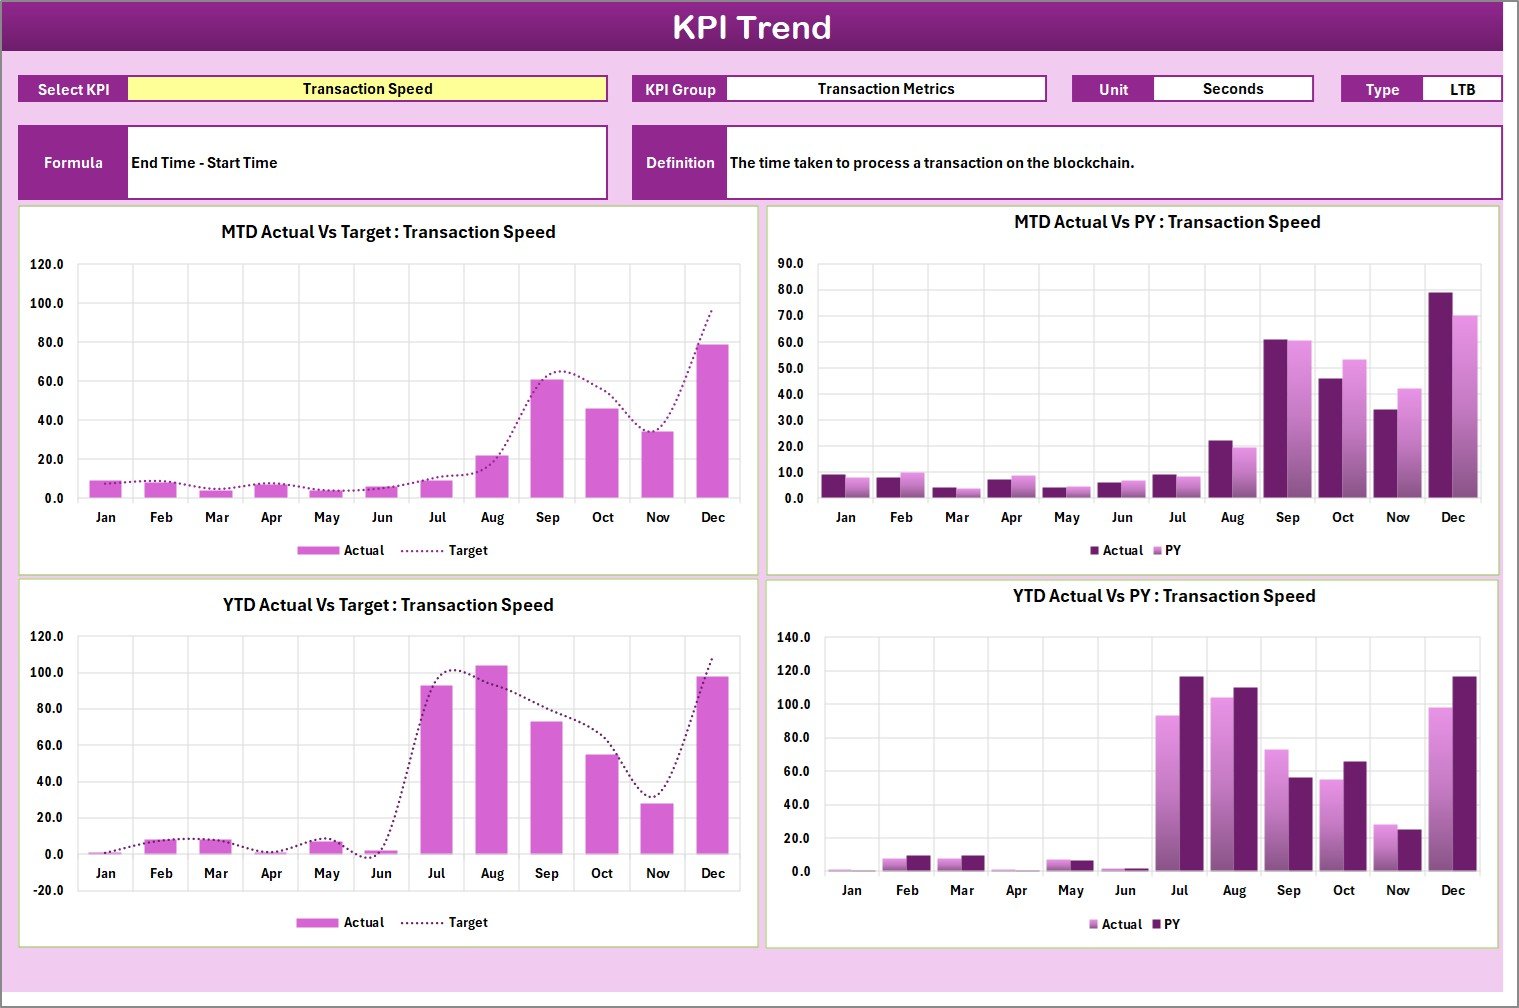
📈 Trend Analysis – Visualize KPI movement over time with dynamic charts
🎯 10 KPIs in One View – Monitor multiple KPIs without scrolling
🎨 Visual Indicators – Color-coded signals highlight good, average, or poor performance
🔽 Interactive Dropdowns – Change month, MTD, or YTD and auto-refresh all metrics
⚙️ Fully Customizable – Modify KPIs, targets, formulas, and units as needed
## 📦 What’s Inside the Blockchain & Cryptocurrency KPI Scorecard in Excel
This professionally designed Excel template includes 4 powerful worksheets, each serving a specific purpose:
📌 Scorecard Sheet
This is the main dashboard where you instantly see KPI performance. It shows KPI name, group, unit, type (UTB/LTB), Actual vs Target, and MTD/YTD performance using clear visual indicators.
📌 KPI Trend Sheet
Analyze performance trends by selecting a KPI from a dropdown. View MTD and YTD trend charts for Actual, Target, and Previous Year values to identify patterns and risks early.
📌 Input Data Sheet
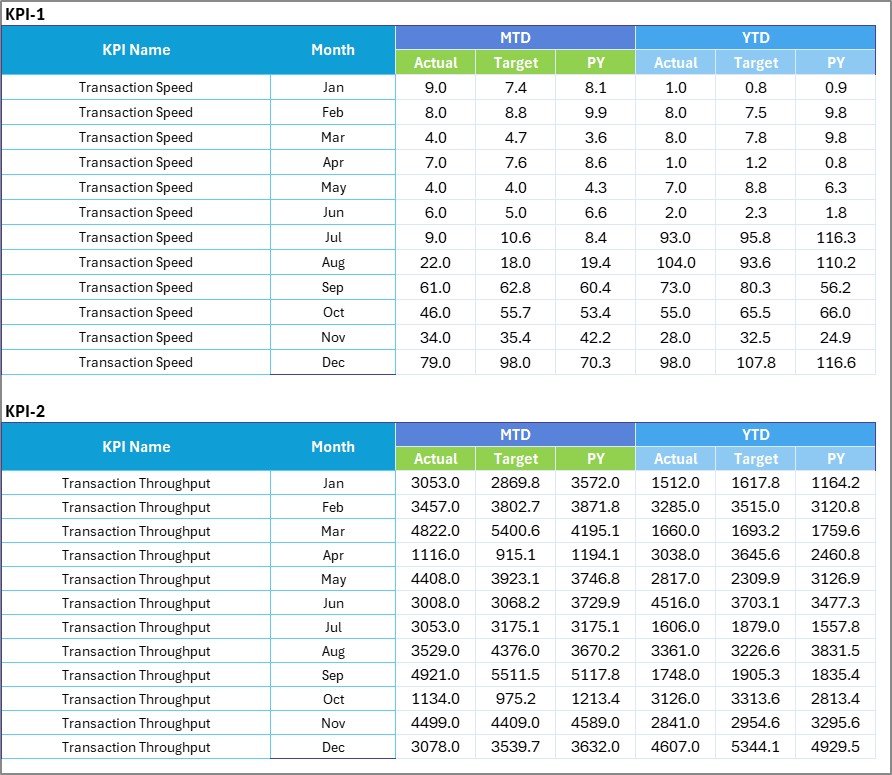
A clean and structured data entry sheet where you input monthly actuals, targets, and previous-year values. Updating data here automatically refreshes the entire scorecard.
📌 KPI Definition Sheet
Define each KPI clearly with name, group, unit, formula, and definition to ensure consistency and transparency across teams.
## 🛠️ How to Use the Blockchain & Cryptocurrency KPI Scorecard in Excel
Using this scorecard is simple and beginner-friendly:
1️⃣ Define your KPIs and targets in the KPI Definition Sheet
2️⃣ Enter monthly data in the Input Data Sheet
3️⃣ Select month, MTD, or YTD in the Scorecard Sheet
4️⃣ Review performance using visuals and indicators
5️⃣ Analyze trends in the KPI Trend Sheet
No advanced Excel skills required. Just enter data and start analyzing.
## 👥 Who Can Benefit from This Blockchain & Cryptocurrency KPI Scorecard
This KPI Scorecard is ideal for:
🚀 Blockchain Startups tracking network and operational KPIs
💱 Cryptocurrency Exchanges monitoring trading and liquidity metrics
📊 Crypto Analysts & Traders analyzing performance trends
🔗 DeFi Platform Teams tracking adoption and activity KPIs
⚡ Mining Operations monitoring hash rate and efficiency
📈 Investors & Portfolio Managers reviewing performance metrics
Whether you are a beginner or an advanced professional, this scorecard adapts to your needs.
Click here to read the Detailed Blog Post
Watch the step-by-step video tutorial:
Visit our YouTube channel to learn step-by-step video tutorials
Compatibility and Requirements
- Works in Microsoft Excel desktop (Excel 2016 or later, or Microsoft 365).
- You pick the month and switch between MTD and YTD with drop-down lists.
- Microsoft’s guide Create a drop-down list explains the Excel feature this file is built on.
Frequently Asked Questions
Which sheets are in the file?
Four: a Scorecard sheet, a KPI Trend sheet, an Input Data sheet and a KPI Definition sheet.
How many KPIs can I see at once?
The Scorecard sheet shows 10 KPIs in one view, so you do not need to scroll.
How do I switch between MTD and YTD?
Use the drop-downs on the Scorecard sheet to choose the month and MTD or YTD. All metrics update.
What do UTB and LTB mean?
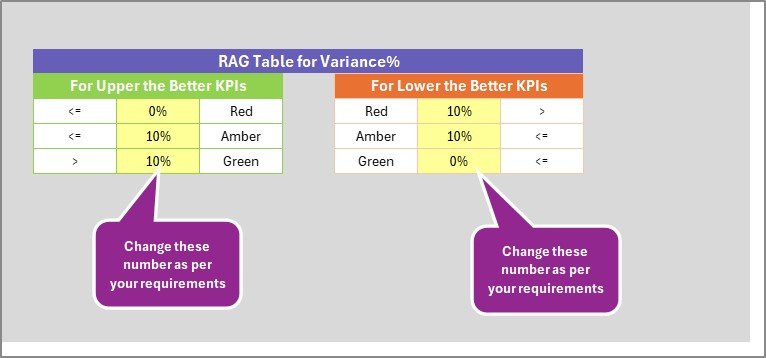
They mark the KPI type: UTB means upper the better and LTB means lower the better, so the color signals read correctly.
Can I change the KPIs and targets?
Yes. You can edit KPIs, targets, formulas and units in the KPI Definition and Input Data sheets.
Related Blockchain and Crypto Templates
- Blockchain and Cryptocurrency KPI Dashboard in Excel: a dashboard view of the same KPIs
- Blockchain and Cryptocurrency KPI Scorecard in Google Sheets: the Google Sheets edition
- Blockchain and Cryptocurrency KPI Dashboard in Power BI: the Power BI dashboard
- Blockchain and Cryptocurrency Dashboard in Excel: an analysis dashboard for crypto data
- KPI Scorecard Mega Pack: 12 premium Excel and Google Sheets scorecards in one bundle
Browse all Excel KPI dashboards or the Excel dashboards.

































Reviews
There are no reviews yet.