

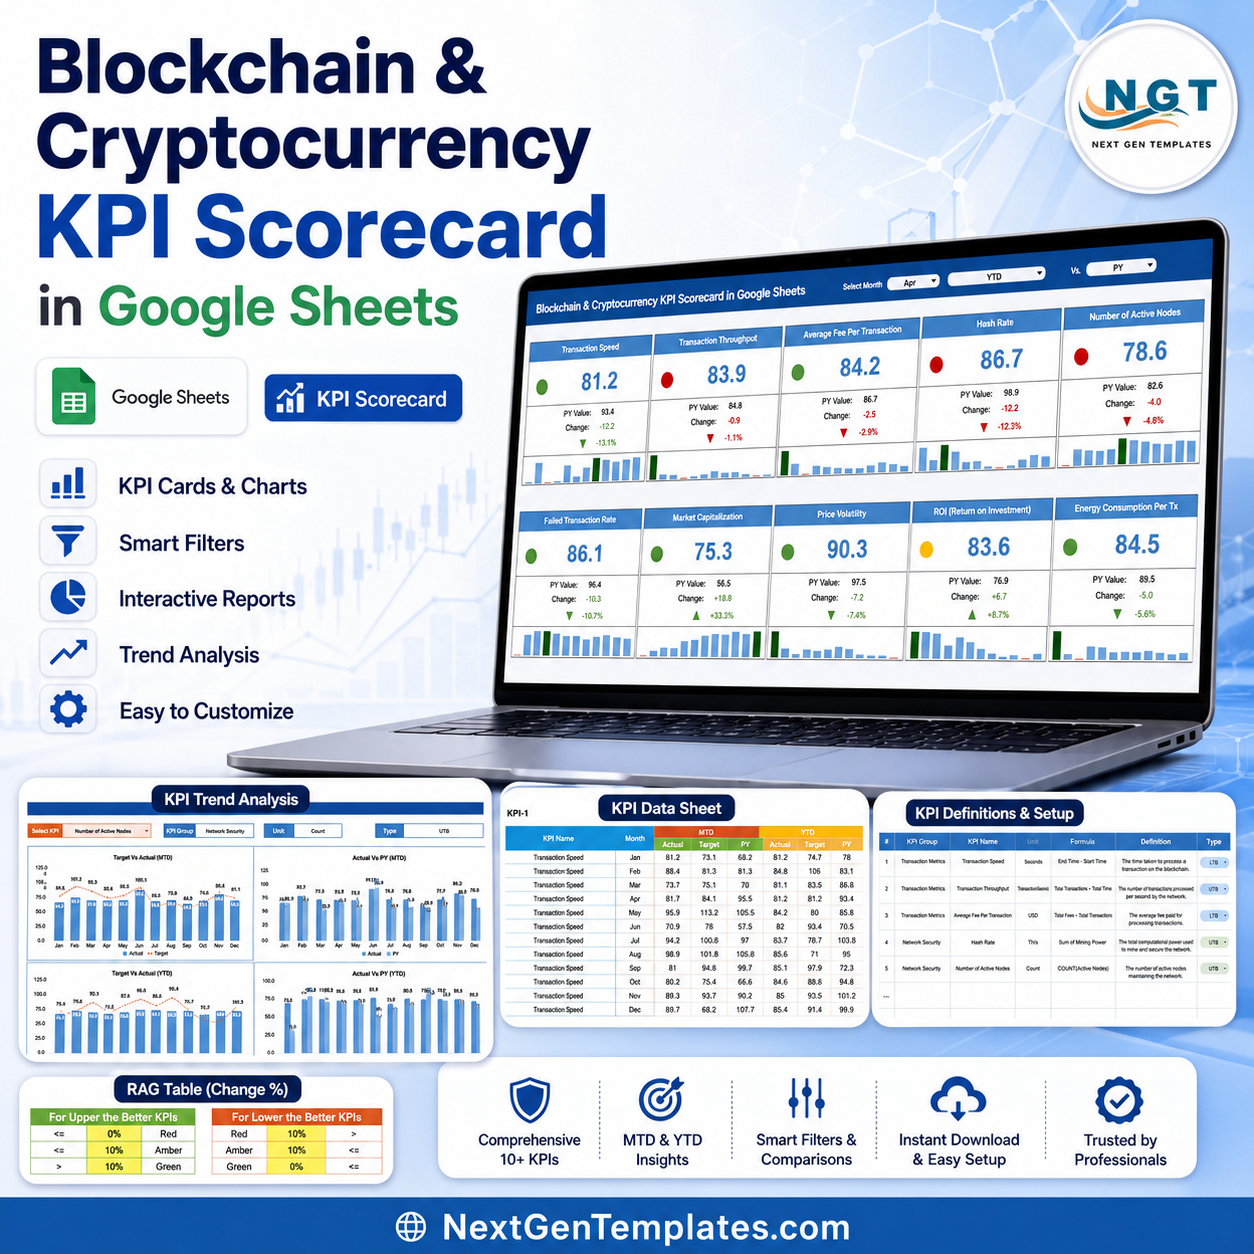
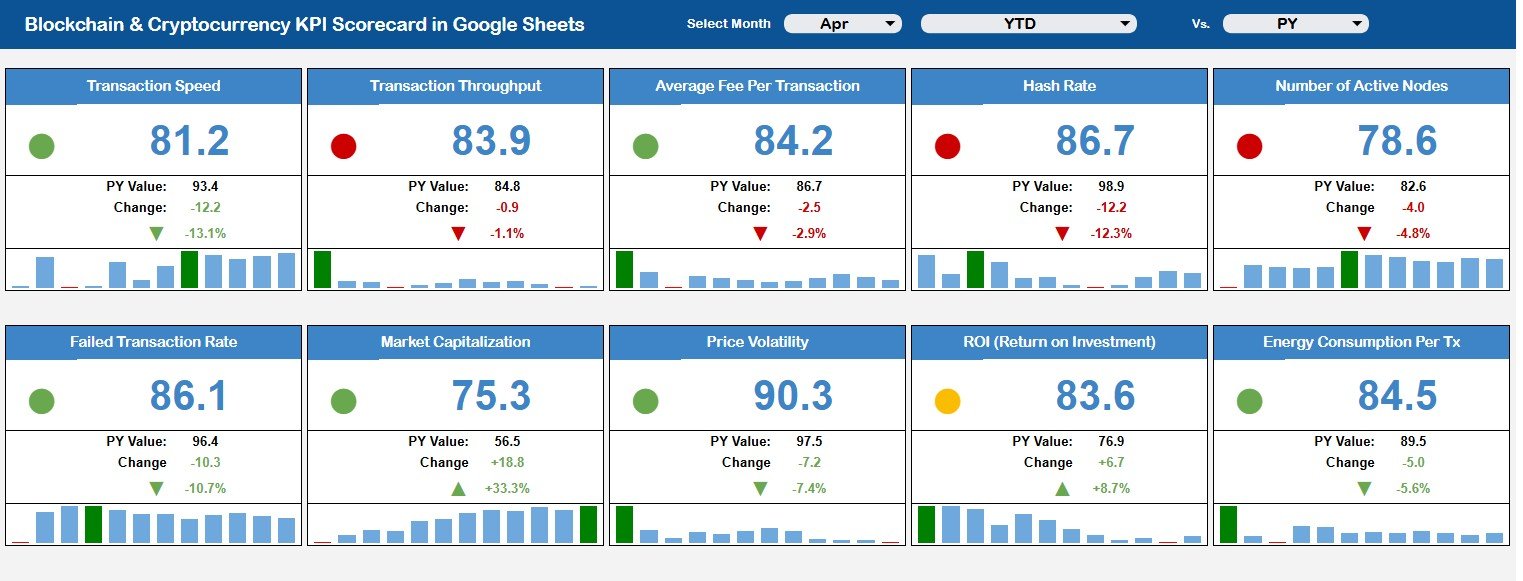
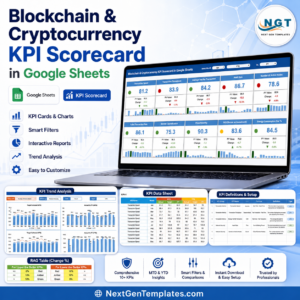
Blockchain and Cryptocurrency KPI Scorecard in Google Sheets gives crypto teams a 5-page KPI review system with 10 executive cards, 10 monthly charts, MTD and YTD comparisons, previous-year benchmarks, KPI definitions, and RAG threshold logic. Built for a one-time purchase instead of a recurring SaaS subscription, it helps analysts turn wallet, network, fee, volatility, and ROI numbers into a cleaner monthly scorecard. NextGenTemplates is used by 10,000+ professionals worldwide, and every template is hand-built and tested before release.
Key Features of Blockchain and Cryptocurrency KPI Scorecard in Google Sheets
- 5 worksheet tabs: Overview, KPI Trend, KPI Data Sheet, KPI Definition Sheet, and RAG Support Table.
- 10 KPI cards for transaction speed, throughput, fees, hash rate, nodes, failed transactions, market cap, volatility, ROI, and energy use.
- Monthly charts for every core blockchain and cryptocurrency KPI.
- MTD and YTD tracking with Actual, Target, and Previous Year values.
- Editable KPI formulas, groups, units, definitions, and KPI direction.
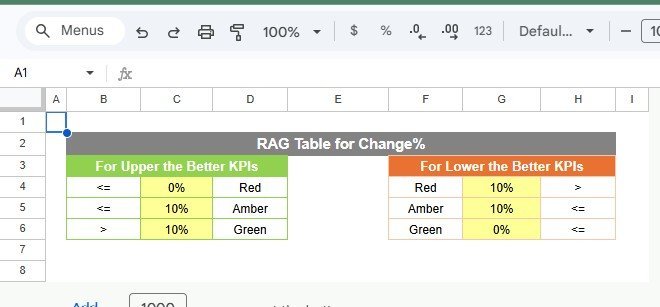
- RAG logic for Upper the Better and Lower the Better KPIs.
- Google Sheets format for browser access, Drive sharing, and team review.
- No macros, special BI license, or crypto analytics platform setup required.
What’s Inside the Blockchain and Cryptocurrency KPI Scorecard in Google Sheets
Overview Page
The Overview Page shows 10 high-level cards and monthly charts with slicers for fast review of blockchain performance, crypto market movement, fee behavior, network health, ROI, and energy efficiency.
Blockchain and Cryptocurrency KPI Scorecard in Google Sheets
KPI Trend
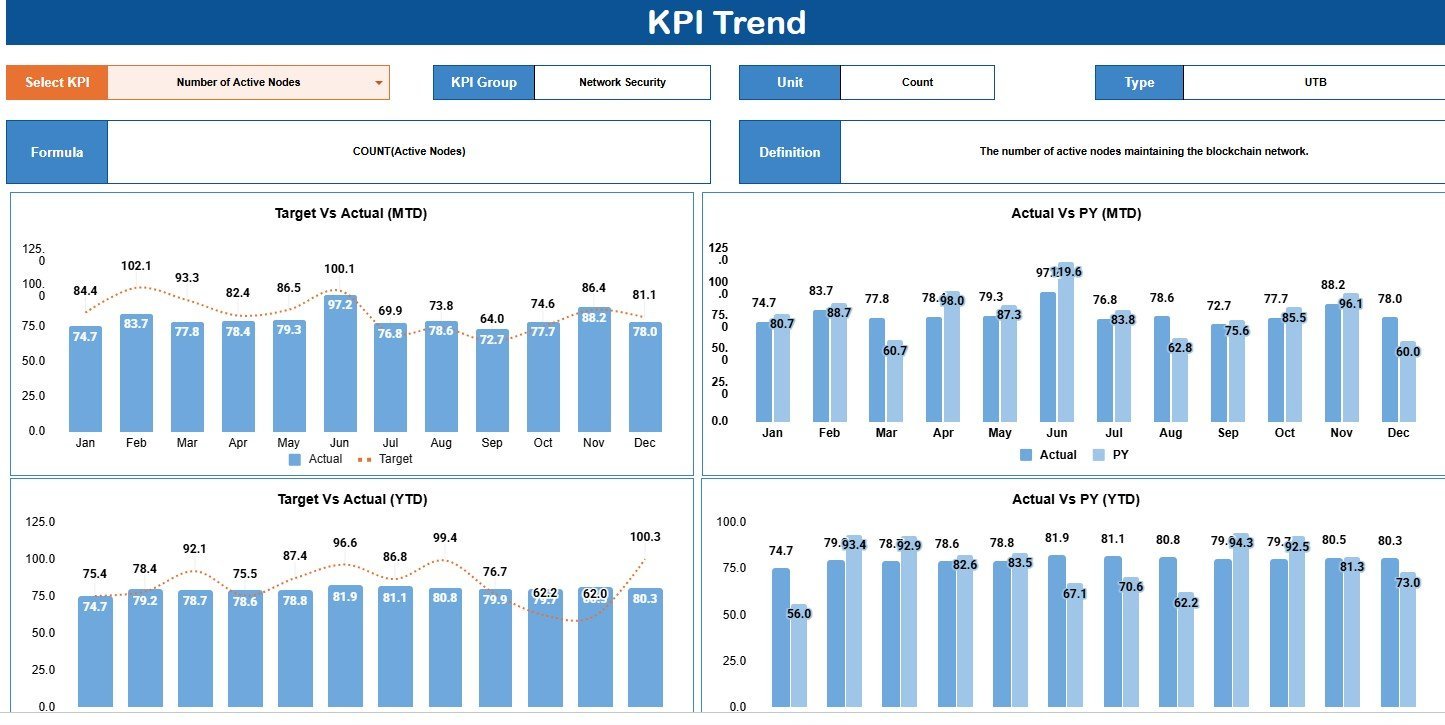
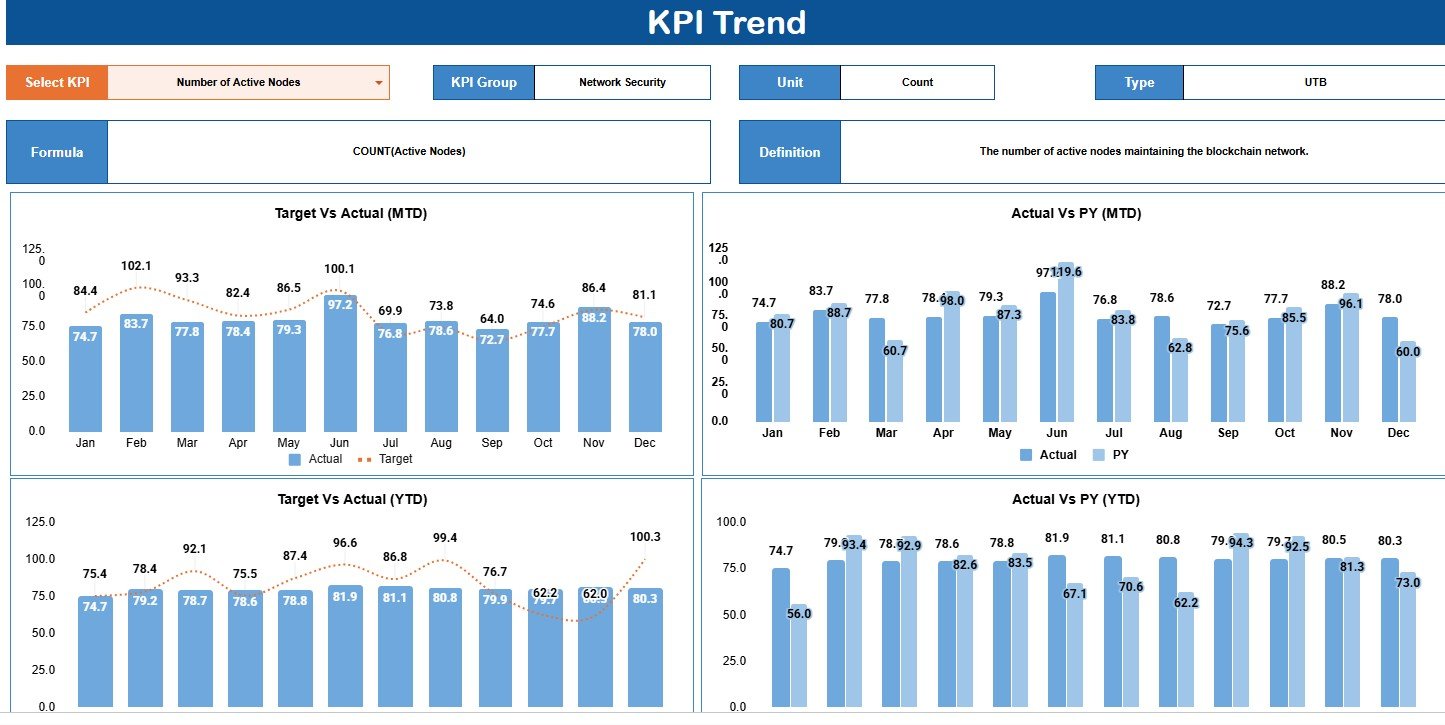
The KPI Trend tab compares Number of Active Nodes Target vs Actual MTD, Actual vs PY MTD, Target vs Actual YTD, and Actual vs PY YTD by month.
KPI Trend
KPI Data Sheet
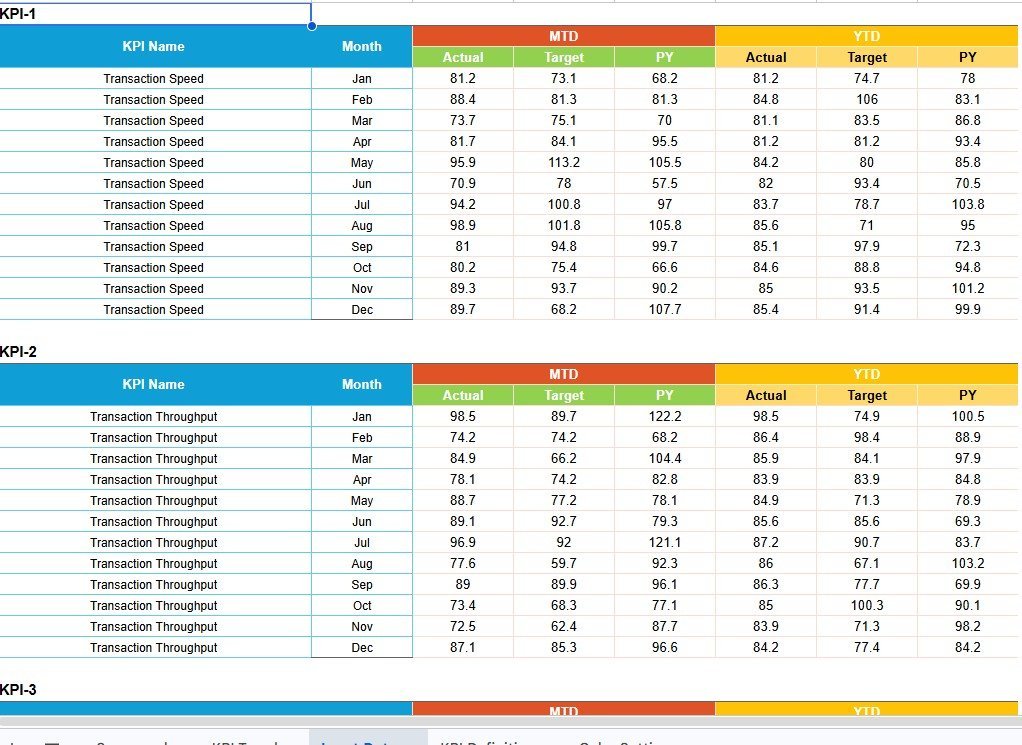
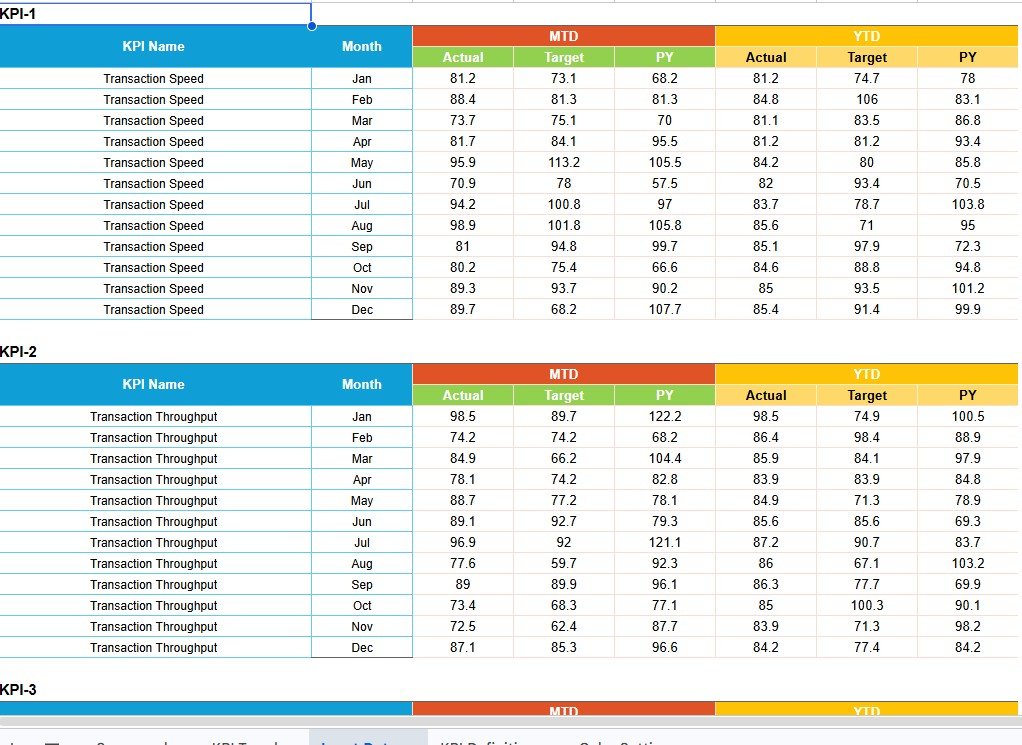
The KPI Data Sheet stores MTD Actual, MTD Target, MTD PY, YTD Actual, YTD Target, and YTD PY values by KPI Name and Month.
KPI Data Sheet
KPI Definition Sheet
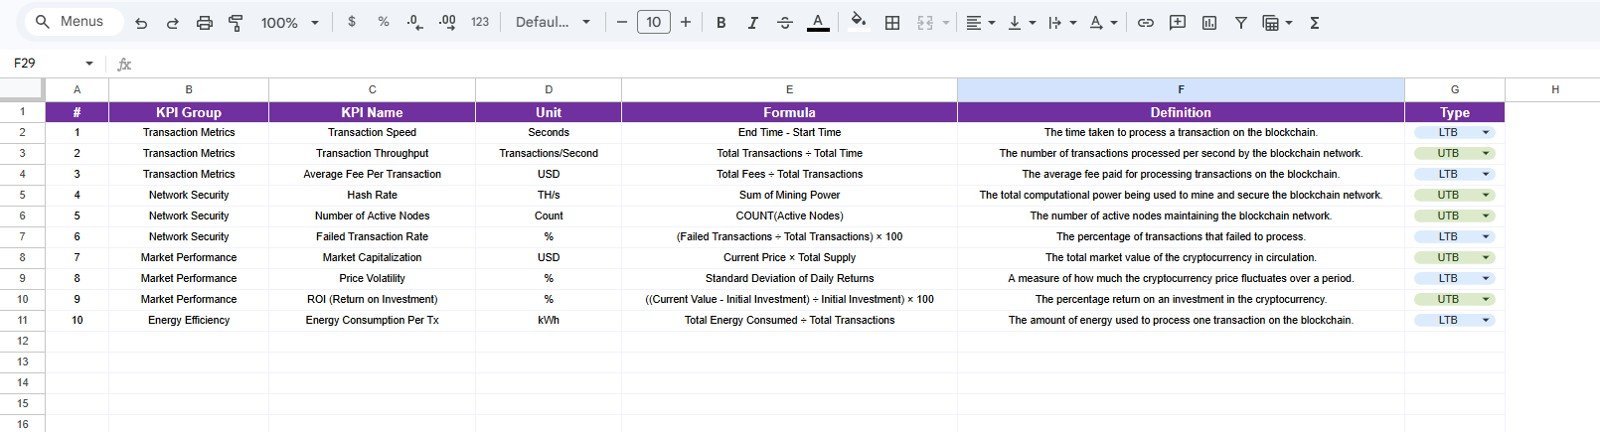
The KPI Definition Sheet documents each KPI Group, Unit, Formula, Definition, and Type so stakeholders use the same metric logic.
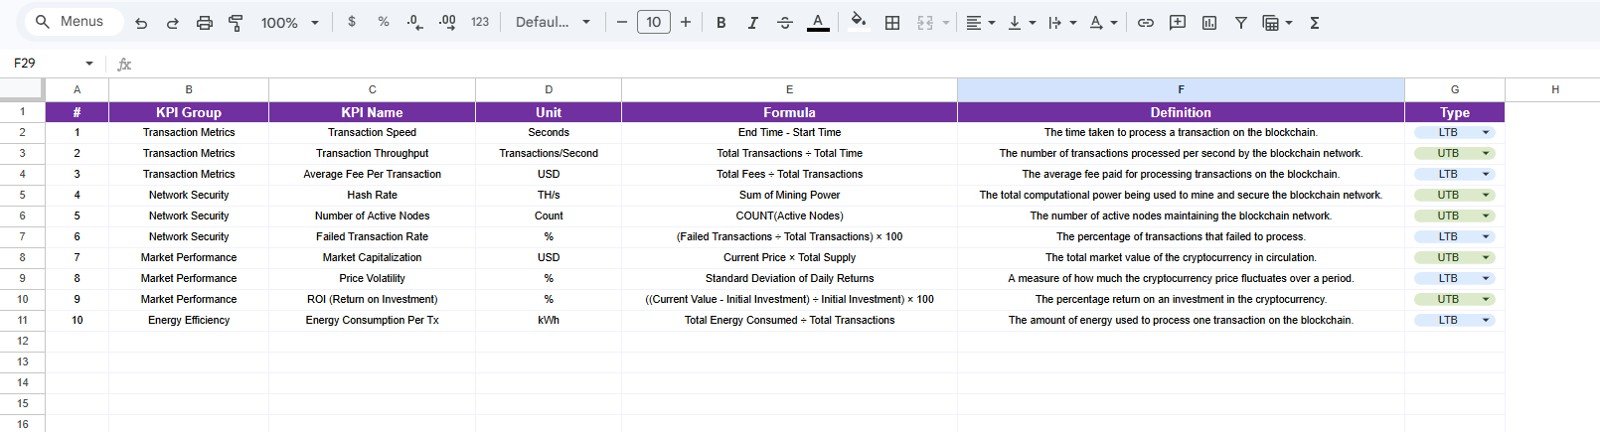
KPI Definition Sheet
RAG Support Table
The RAG Support Table defines red, amber, and green thresholds for both Upper the Better and Lower the Better KPI types.
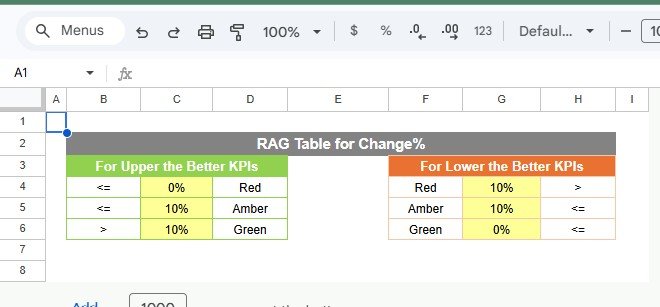
RAG Support Table
Blockchain and Cryptocurrency KPI Scorecard in Google Sheets vs. Microsoft Excel Dashboard vs. Paid CRM/SaaS – Where This Fits
| Feature | This Google Sheets KPI Scorecard | Microsoft Excel Dashboard | Paid CRM/SaaS |
|---|---|---|---|
| Cost | 12.99 sale price | Excel license plus workbook setup | Recurring subscription |
| Platform | Google Sheets | Excel desktop or Microsoft 365 | Vendor web app |
| Setup time | Copy the sheet and update KPI data | Download, edit, and share | Configure accounts and integrations |
| Real-time team collaboration | Native Google Sheets collaboration | Best with OneDrive or SharePoint | Usually included |
| Mobile access | Google Sheets mobile apps | Excel mobile apps | Depends on vendor |
| Customizable fields | KPI names, formulas, units, definitions, and thresholds | Editable workbook fields | Limited by plan or setup |
| Share with link | Yes, through Google Drive | Possible through cloud storage | Usually seat based |
| Year-1 cost at 5 users | 12.99 one-time, based on provided sale price | Depends on Microsoft access | Can rise with user seats |
| Blockchain KPI coverage | Speed, fees, nodes, hash rate, volatility, ROI, and energy metrics | Depends on workbook design | Often deeper but vendor-bound |
| Best fit | Manual monthly KPI review | Offline analysis | Automated live analytics |
Who This Template Is For – and Who It’s Not For
This template is for crypto analysts, Web3 founders, blockchain operations teams, finance leads, researchers, and consultants who already have KPI values and need a shared monthly scorecard in Google Sheets.
It is not for live exchange syncing, tax accounting, wallet automation, on-chain forensics, order-book analysis, or institutional custody reporting. Those needs call for a data connector, paid crypto analytics system, or custom pipeline.
How to Use the Blockchain and Cryptocurrency KPI Scorecard in Google Sheets
- Open the PDF guide and create your editable Google Sheets copy.
- Update KPI names, groups, units, formulas, definitions, and KPI type.
- Enter monthly Actual, Target, and Previous Year values.
- Adjust the RAG Support Table for your red, amber, and green rules.
- Review the Overview Page and use KPI Trend for deeper metric analysis.
Real-World Use Cases
Priya, Crypto Operations Analyst
Priya reviews transaction throughput, fees, failed transactions, and active nodes before weekly operations calls.
Marcus, Web3 Finance Lead
Marcus tracks market capitalization, volatility, and ROI against target and previous-year benchmarks.
Elena, Blockchain Infrastructure Founder
Elena monitors hash rate, active nodes, transaction speed, and energy consumption for board updates.
Frequently Asked Questions
Is this Blockchain and Cryptocurrency KPI Scorecard in Google Sheets ready to use?
Yes. Copy it into Google Drive and replace the sample KPI values with your own monthly data.
Can I change the KPI names?
Yes. You can edit KPI names, groups, units, formulas, definitions, and KPI type.
Does it track both MTD and YTD values?
Yes. It supports MTD Actual, MTD Target, MTD PY, YTD Actual, YTD Target, and YTD PY.
Can I use it for token, network, or wallet reporting?
Yes, as long as you can enter or paste the KPI values into the sheet.
Does it connect automatically to exchanges or wallets?
No. This is a KPI scorecard template, not a live blockchain data connector.
Can multiple people use it together?
Yes. You can share the file through Google Drive with view, comment, or edit access.
About the Author
Built by PK – Microsoft Certified Professional with 15+ years of Excel, Google Sheets, and Power BI experience. Founder of NextGenTemplates, reaching 300K+ subscribers across YouTube channels. Every template is hand-built and tested before release.
Explore Related Templates
For chart-led reporting, see the Blockchain & Cryptocurrency KPI Dashboard in Google Sheets. For broader blockchain reporting, review the Blockchain and Cryptocurrency Dashboard in Google Sheets. You may also like the Crypto Portfolio Dashboard in Google Sheets and Fintech Dashboard in Google Sheets. Browse the Google Sheets templates collection and Google Sheets KPI Dashboard category.
Ready to track blockchain KPIs with a cleaner monthly scorecard? Add the template, update your KPI data, and start reviewing transaction, network, financial, and sustainability metrics in one place.
Watch the step-by-step video Demo:
Last updated: August 15, 2026































Reviews
There are no reviews yet.