

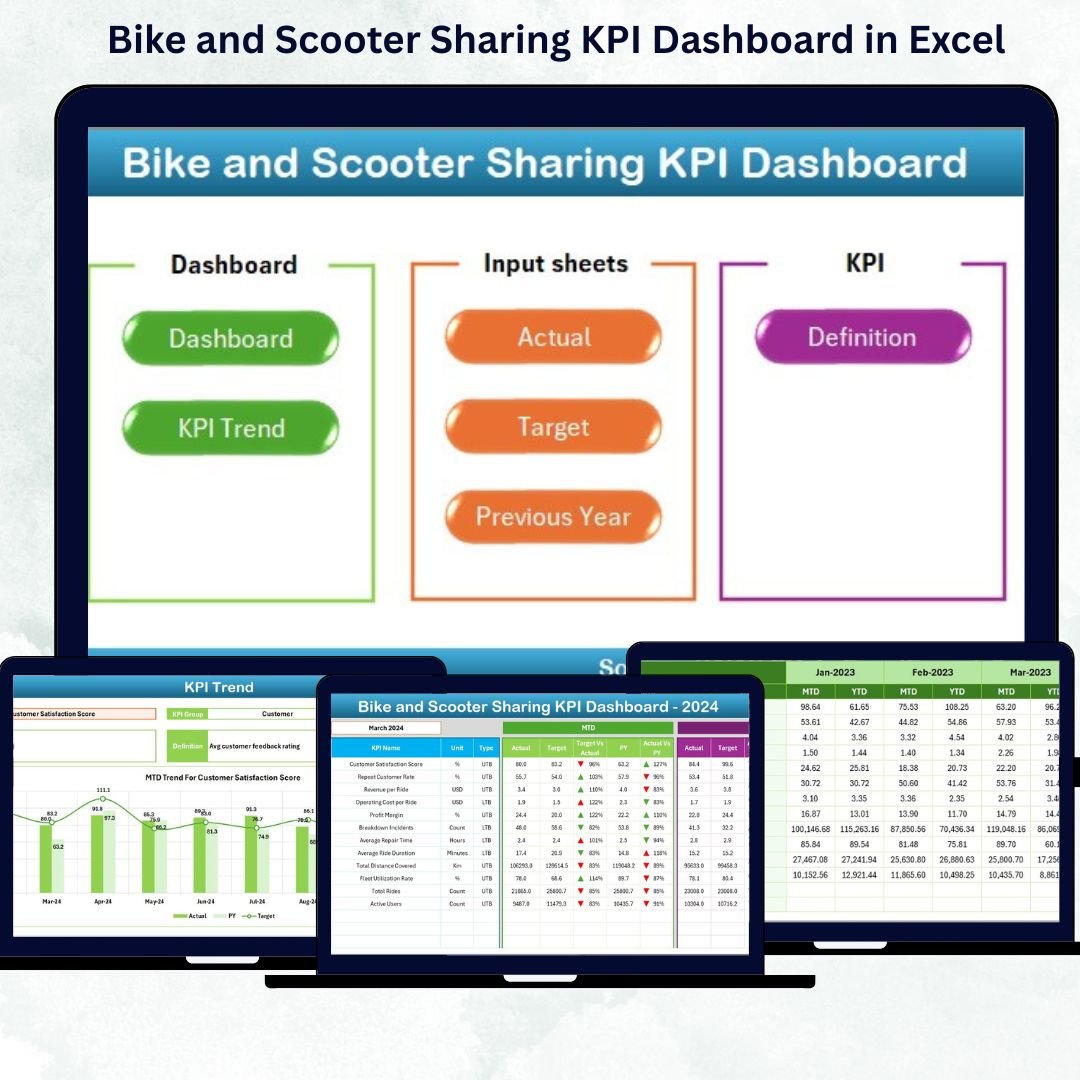


In the era of smart mobility and sustainable transport, managing bike and scooter sharing operations efficiently is vital for success. From user satisfaction and ride utilization to maintenance costs and downtime — every KPI tells a story about your fleet’s performance.
That’s where the Bike and Scooter Sharing KPI Dashboard in Excel becomes your ultimate performance companion. 🎯 This ready-to-use Excel dashboard simplifies performance tracking, trend analysis, and decision-making — all within the comfort of Microsoft Excel. No coding, no complex setup, just clear insights at your fingertips!
⚙️ Key Features of the Bike and Scooter Sharing KPI Dashboard in Excel
📊 Comprehensive KPI Monitoring – Track utilization rate, maintenance cost, revenue per ride, downtime %, and customer satisfaction — all in one place.
📆 Dynamic Month Selector (Cell D3) – Instantly switch between months to view updated metrics for MTD (Month-to-Date) and YTD (Year-to-Date).
📈 Target vs Actual vs Previous Year – Compare how your fleet is performing against business goals with conditional formatting using up/down arrows.
💡 Interactive Navigation Buttons – Move across pages effortlessly with the Home sheet buttons.
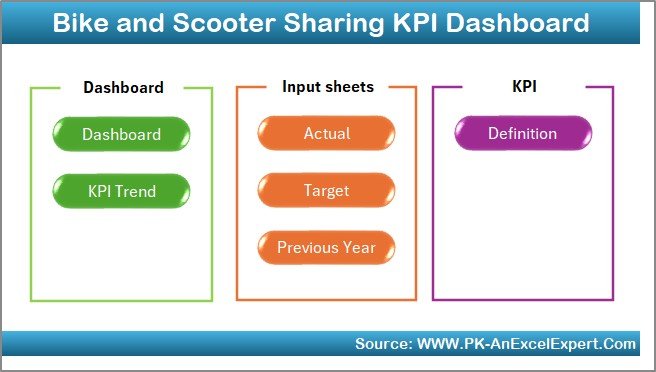
🧮 Seven Analytical Sheets – Each sheet is purpose-built for a specific analytical view — from input to visualization.
🧭 Customizable and Scalable – Easily adapt the dashboard to your organization’s KPIs, regions, or fleets.
🚦 Conditional Formatting – Green and red arrows make trends instantly visible for better decision-making.
🔒 No Add-ins or Macros – 100% Excel-based, lightweight, and compatible with both Windows and Mac.
📂 What’s Inside the Bike and Scooter Sharing KPI Dashboard in Excel
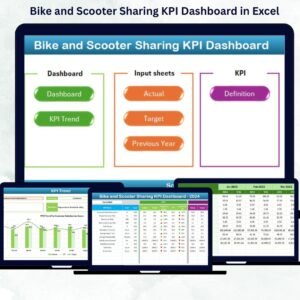
🛠️ 1. Home Sheet: The central navigation hub that lets you jump to any analytical sheet. You can also customize it with your logo and colors.
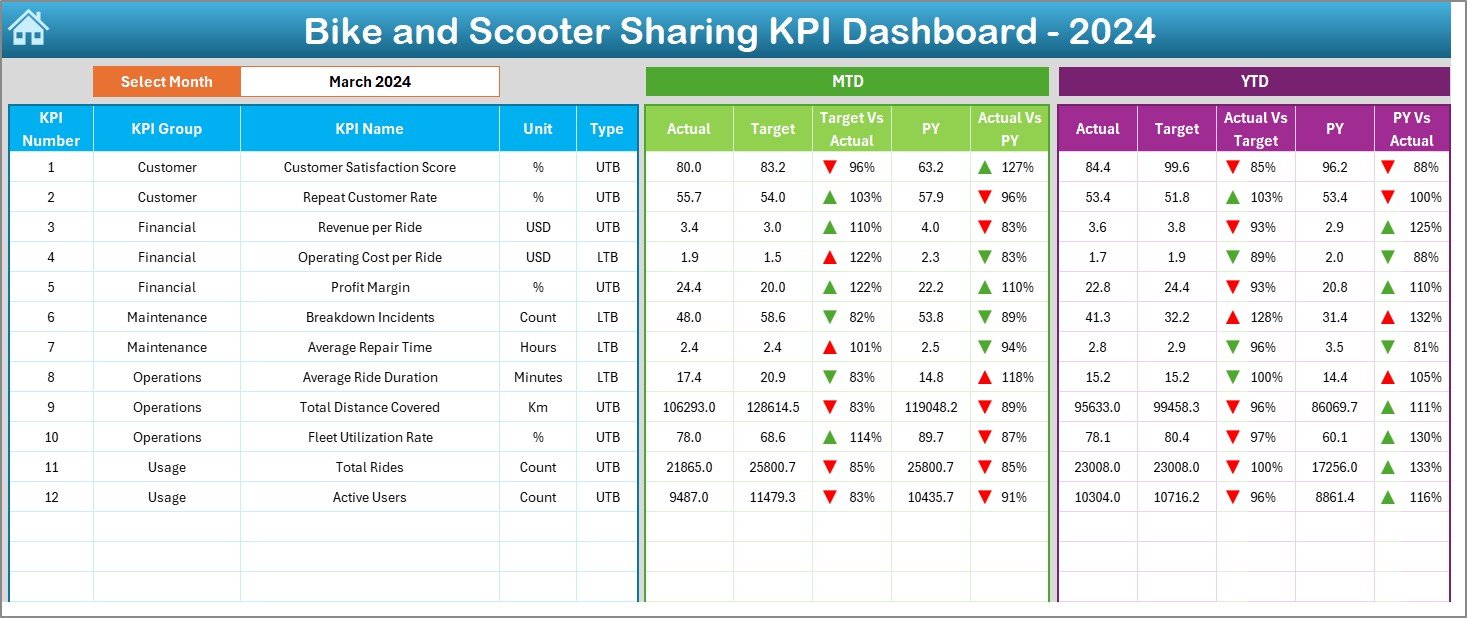
📊 2. Dashboard Sheet: The heart of your analysis — view all KPIs with dynamic month selection and visual comparisons of Actual, Target, and Previous Year data.
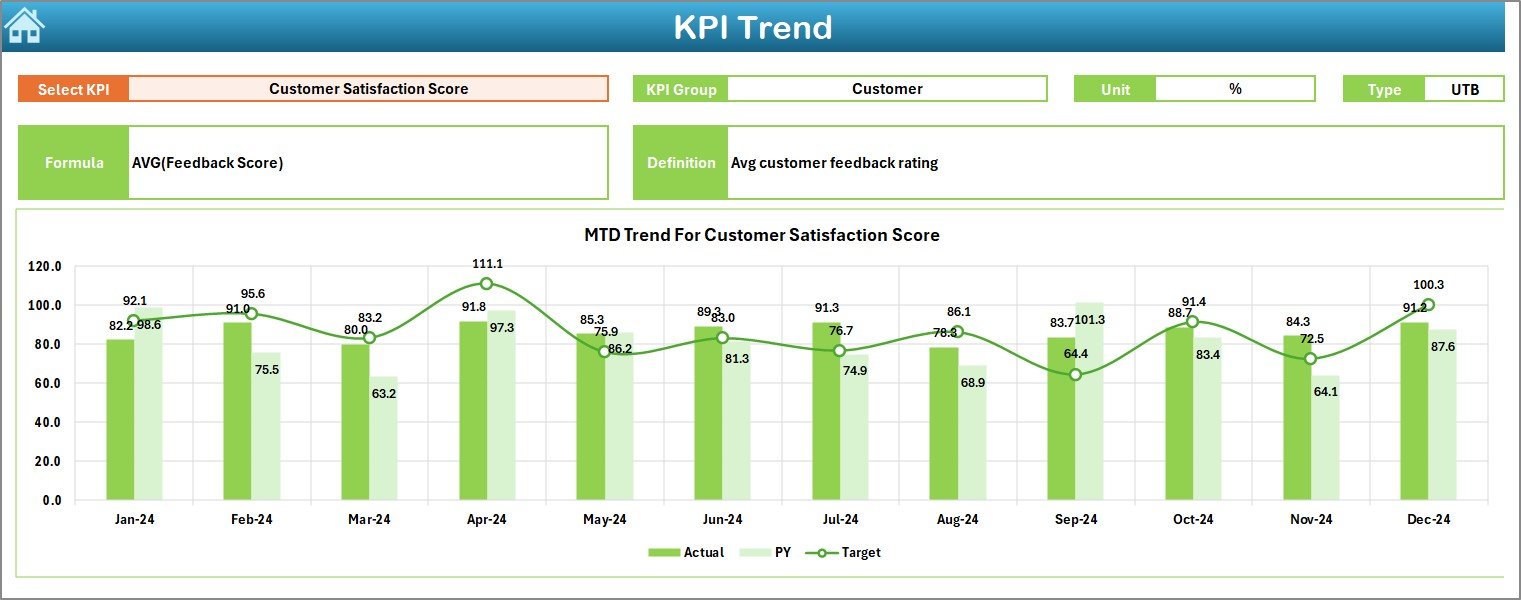
📈 3. KPI Trend Sheet: Choose any KPI from the dropdown (cell C3) to view its trend over time. Analyze MTD/YTD progress, formula, and performance patterns easily.
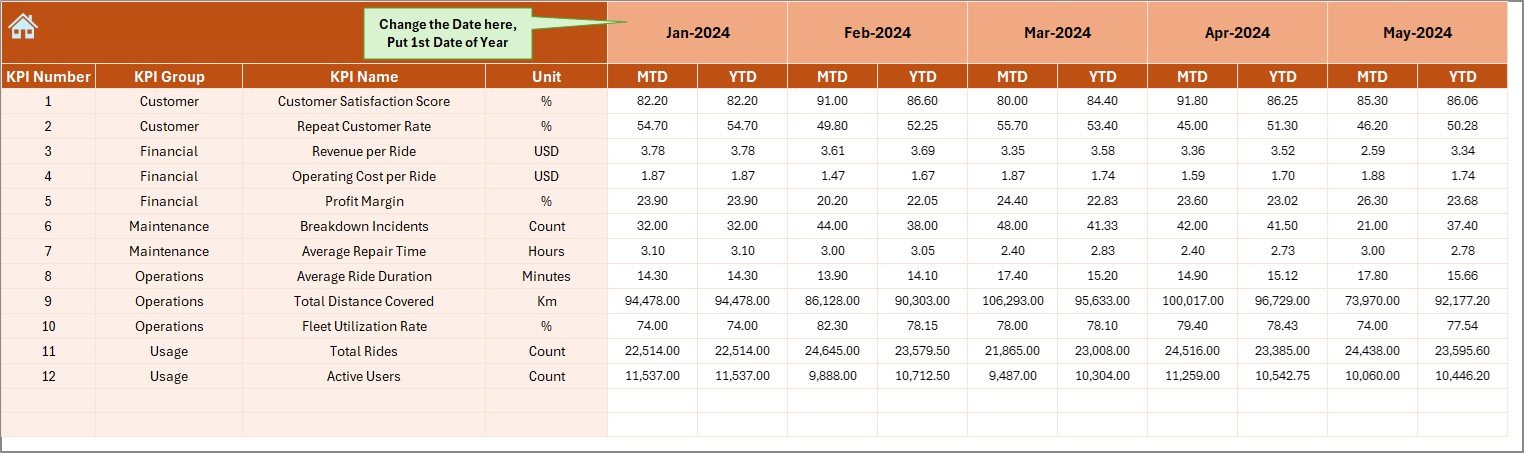
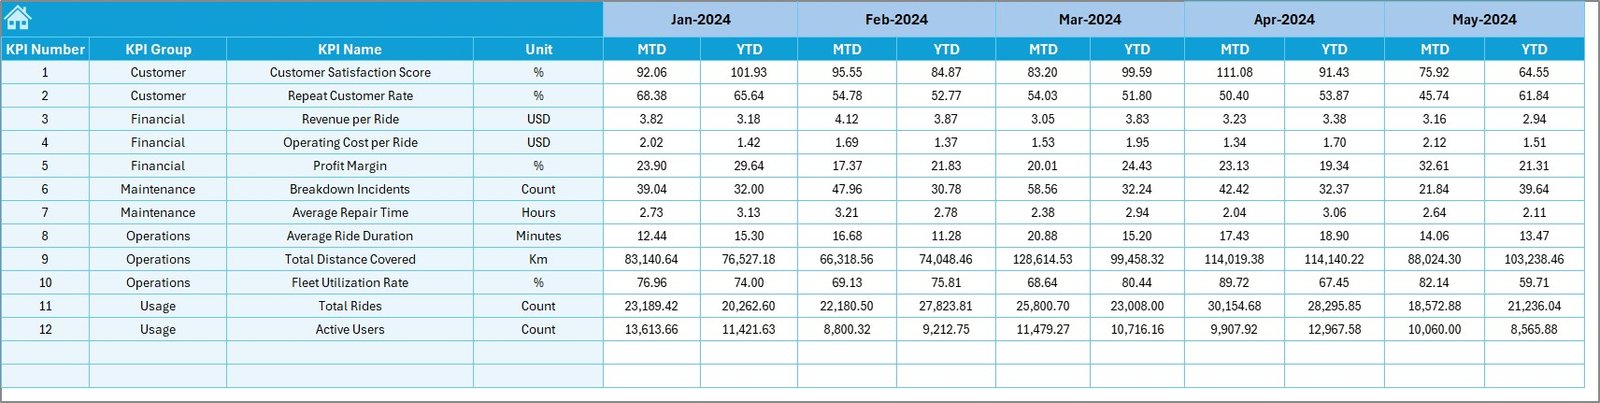
📋 4. Actual Numbers Input Sheet: Record your monthly MTD and YTD data here. This sheet drives real-time visuals in the dashboard automatically.
🎯 5. Target Sheet: Enter performance goals (MTD/YTD) to measure whether you’re on track or lagging behind.
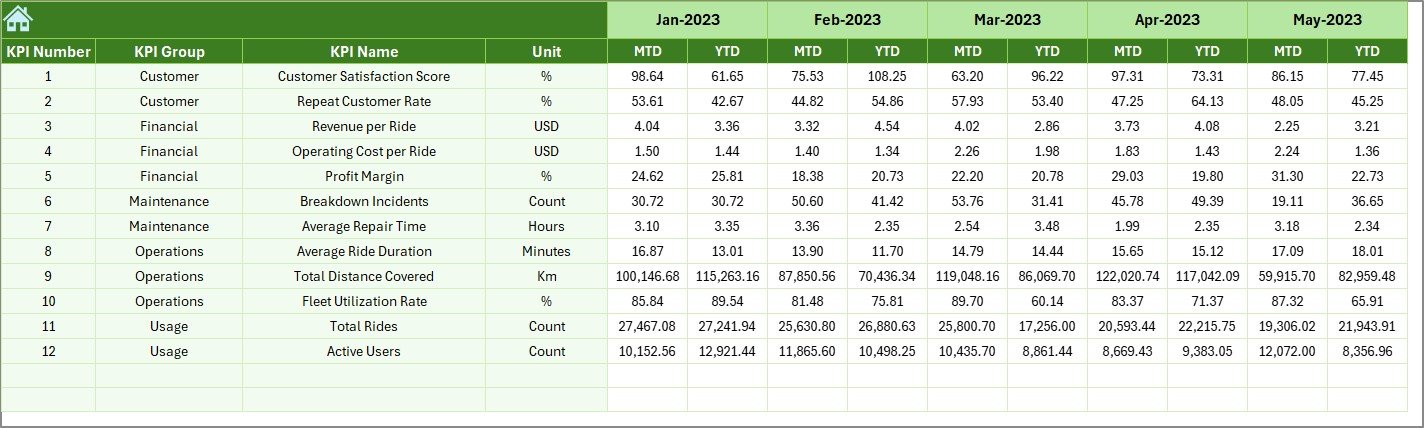
📉 6. Previous Year Sheet: Maintain last year’s data to benchmark growth and long-term progress.
📘 7. KPI Definition Sheet: A reference hub for all your KPIs — including definitions, units, formulas, and whether the KPI is LTB (Lower the Better) or UTB (Upper the Better).
This structure ensures your entire reporting process — from data entry to management presentation — runs seamlessly and efficiently.
🧭 How to Use the Bike and Scooter Sharing KPI Dashboard in Excel
1️⃣ Enter Actual Data – Input monthly metrics into the Actual Numbers Input sheet.
2️⃣ Add Targets – Fill in target KPIs for MTD/YTD in the Target sheet.
3️⃣ Include Previous Year Data – Enter last year’s results for benchmarking.
4️⃣ Choose KPI or Month – Use dropdowns and slicers to explore data dynamically.
5️⃣ View the Dashboard – Instantly visualize performance across time, KPI type, or department.
6️⃣ Analyze & Present – Use visuals in management meetings or export them as PDFs.
💡 Tip: Combine this Excel dashboard with Power Query or VBA to automate monthly updates for a more advanced setup.
👥 Who Can Benefit from This Dashboard
🏢 Operations Managers: Track fleet uptime, utilization, and maintenance efficiency.
💰 Finance Teams: Evaluate cost per ride, total revenue, and profitability metrics.
📣 Marketing Managers: Monitor customer satisfaction and growth rates for promotions.
🧭 Executives: Gain a bird’s-eye view of company-wide KPIs and decision insights.
🚲 City Planners & Analysts: Use data to assess service coverage, demand, and sustainability.
Whether you run a small urban fleet or a large-scale sharing network, this dashboard delivers precision, control, and clarity — empowering you to make smarter, faster, data-backed decisions.
🔗 Click here to read the Detailed blog post
📺 Visit our YouTube channel to learn step-by-step video tutorials
Watch the step-by-step video tutorial:
Compatibility and Requirements
- Works in Microsoft Excel desktop (Excel 2016 or later, or Microsoft 365).
- You pick the month from a dropdown on the Dashboard sheet. Microsoft explains dropdowns in Create a drop-down list.
Frequently Asked Questions
Which sheets are included?
Seven sheets: Home, Dashboard, KPI Trend, Actual Numbers Input, Target, Previous Year and KPI Definition.
How do I update the dashboard?
Enter your MTD and YTD figures in the Actual Numbers Input sheet and your goals in the Target sheet. Then select a month in cell D3 of the Dashboard sheet and it updates.
Can I compare this year with last year?
Yes. Add last year’s figures to the Previous Year sheet. The Dashboard shows Actual, Target and Previous Year side by side, with up and down arrows from conditional formatting.
How do I see the trend for one KPI?
Open the KPI Trend sheet and choose a KPI from the dropdown in cell C3. It shows the MTD and YTD trend, the formula and the performance pattern.
Does it need macros or add-ins?
No. The dashboard is built in Excel only and runs without add-ins or macros.
Is there a Power BI or other Excel version?
Yes. See the Bike and Scooter Sharing KPI Dashboard in Power BI and the Bike & Scooter Sharing Dashboard in Excel.
Related Mobility and KPI Templates
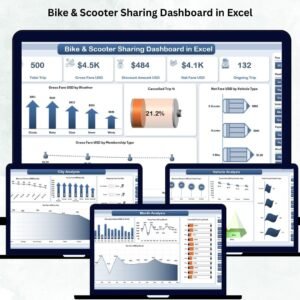
- Bike & Scooter Sharing Dashboard in Excel: another Excel dashboard for shared fleets
- Bike and Scooter Sharing KPI Dashboard in Power BI: the Power BI edition
- Ride-Sharing KPI Dashboard in Excel: KPIs for a ride-sharing service
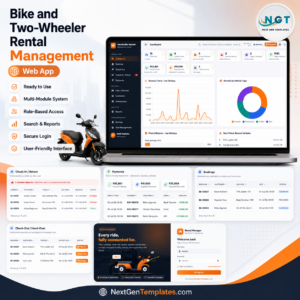
- Bike and Two-Wheeler Rental Management System Web App: a web app for managing rentals
- KPI Dashboard Library (Excel): 15 Excel KPI dashboards in one download
Browse all Excel KPI dashboards.























Reviews
There are no reviews yet.