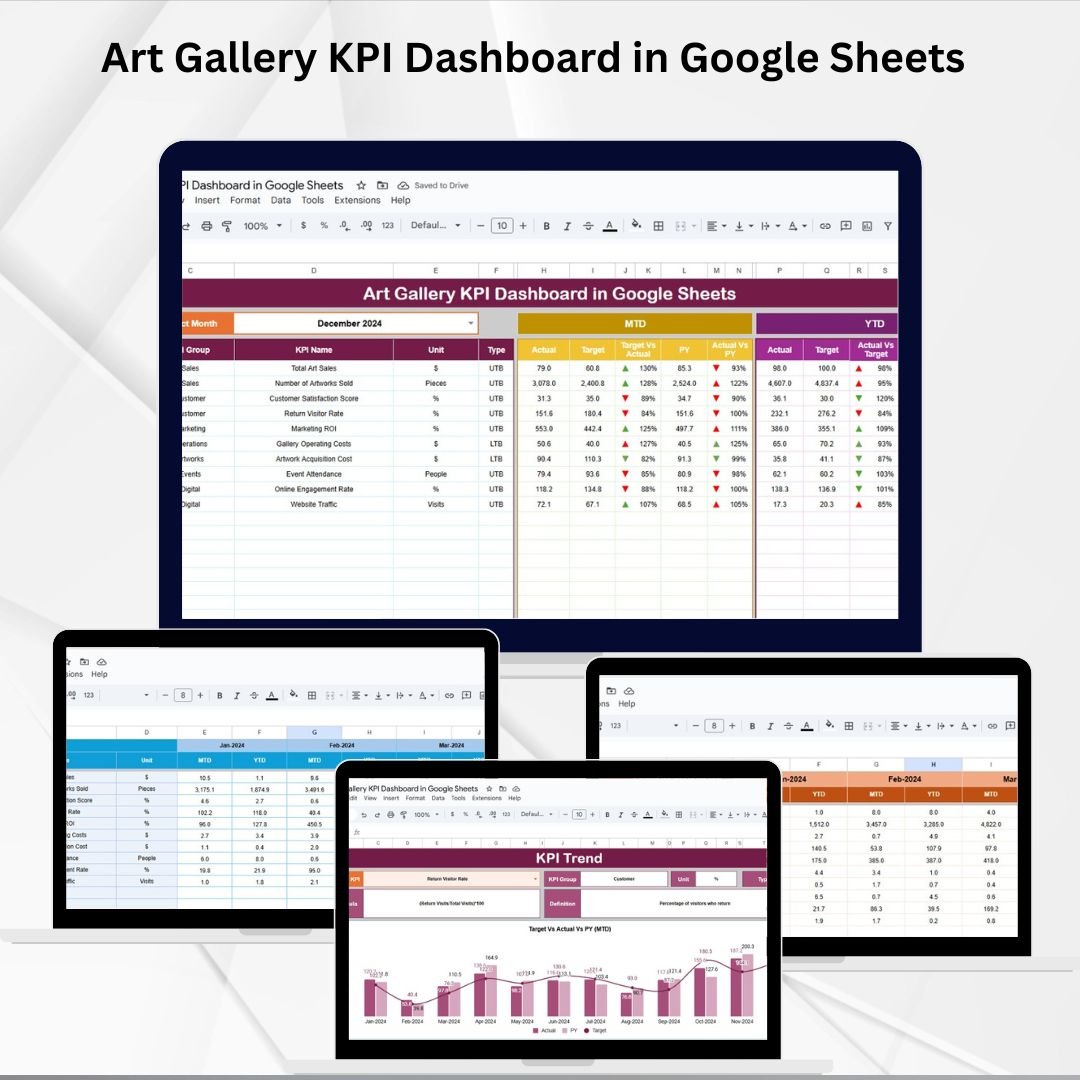
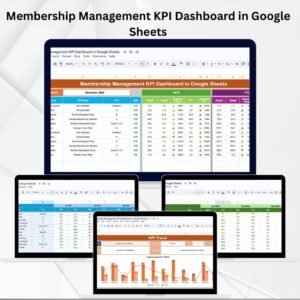
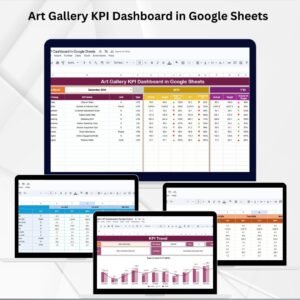
Running an art gallery requires balancing sales, exhibitions, artist management, and visitor engagement all at once. Without a structured system, it’s easy to lose sight of trends, miss opportunities, or struggle with underperforming areas. That’s why we created the Art Gallery KPI Dashboard in Google Sheets — a ready-to-use solution that consolidates all your key performance indicators (KPIs) in one place. 🎨📊
With this interactive dashboard, gallery managers, curators, and administrators can monitor Month-to-Date (MTD) and Year-to-Date (YTD) performance, compare results with targets and last year, and identify trends instantly. This template turns complex reporting into a clear, visual overview, empowering you to make informed decisions with ease.
🔑 Key Features of Art Gallery KPI Dashboard in Google Sheets
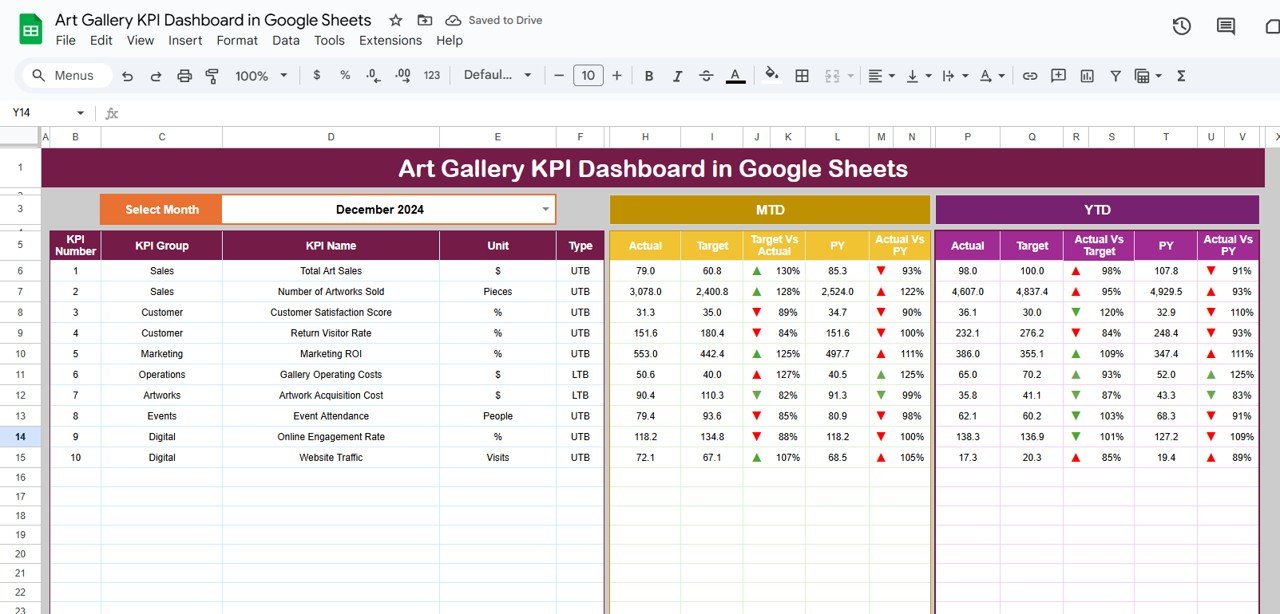
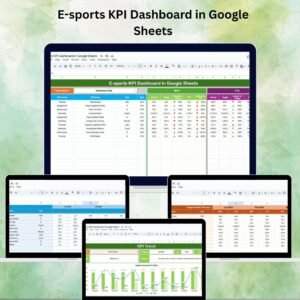
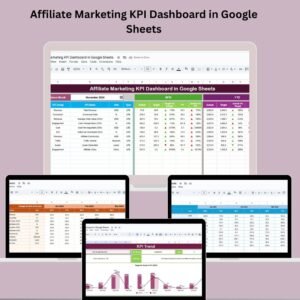
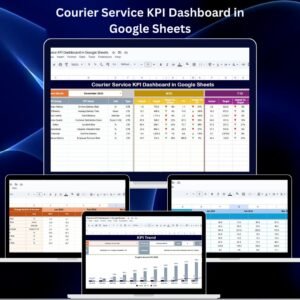
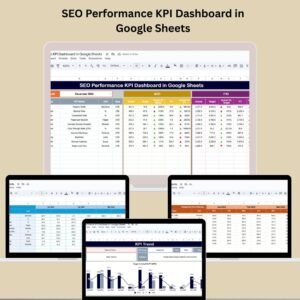
📋 Dashboard Sheet
-
Centralized KPI overview.
-
Month selection dropdown updates all data dynamically.
-
MTD and YTD Actuals, Targets, and Previous Year comparisons.
-
Conditional formatting with green/red arrows to quickly spot performance gaps.
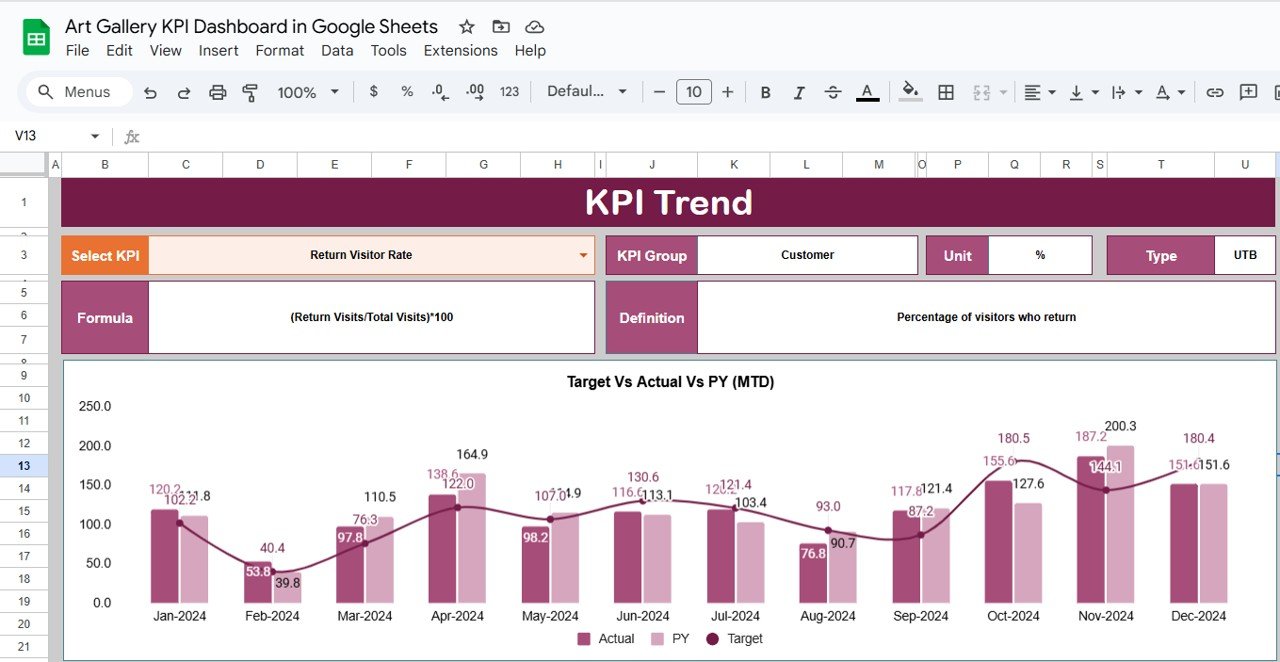
📈 KPI Trend Sheet
-
Select any KPI to analyze trends over time.
-
Displays KPI group, unit, type (Upper-the-Better or Lower-the-Better).
-
Shows formula and KPI definition for easy understanding.
-
Trend charts to visualize performance growth or decline.
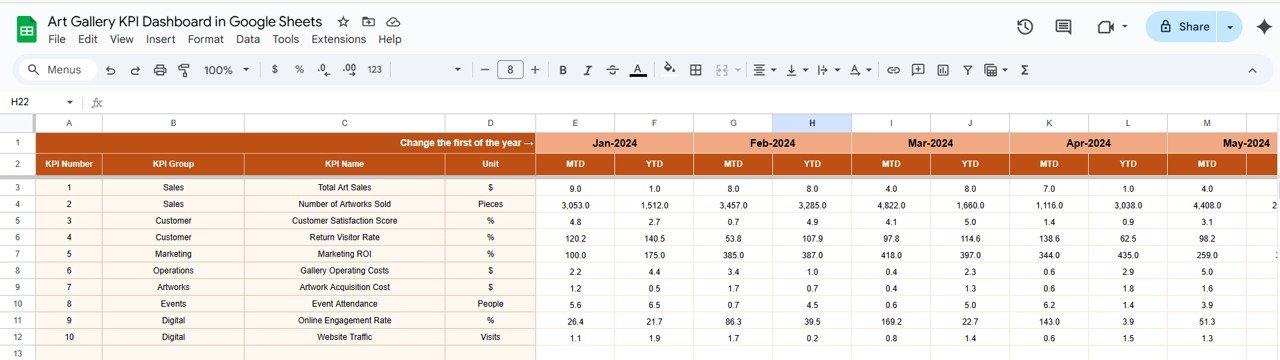
🧾 Actual Numbers Sheet
-
Enter monthly actual data.
-
Auto-calculates MTD and YTD values.
-
Simple structure for quick updates.
🎯 Target Sheet
-
Set monthly and yearly KPI targets.
-
Compare actual vs. planned performance.
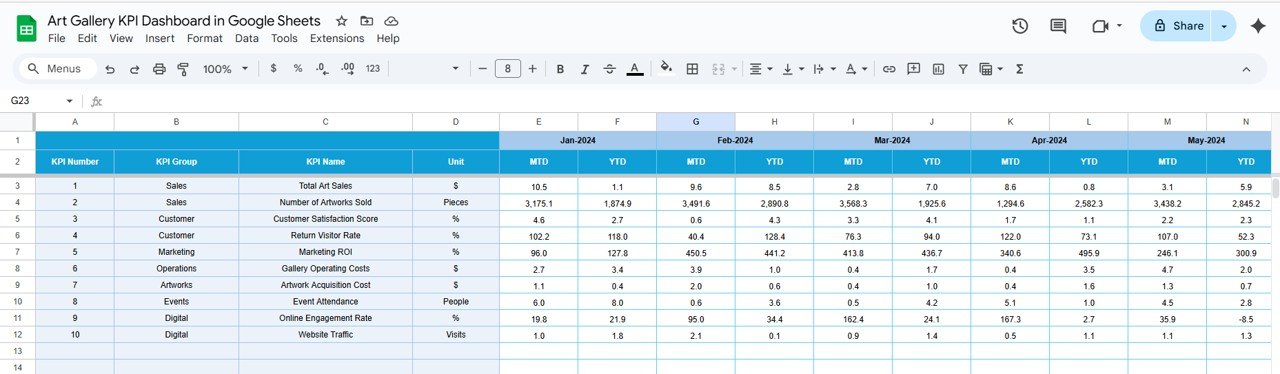
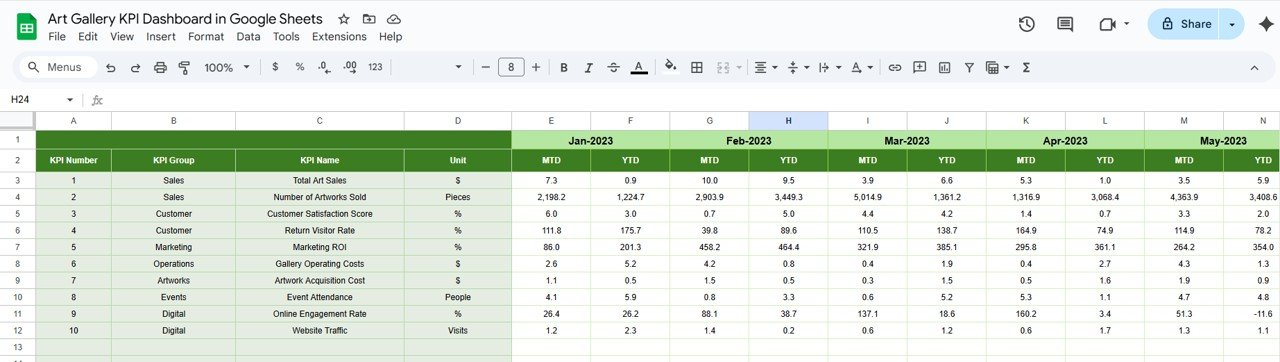
📊 Previous Year Numbers Sheet
-
Store last year’s data for historical comparisons.
-
Enables growth tracking and performance benchmarking.
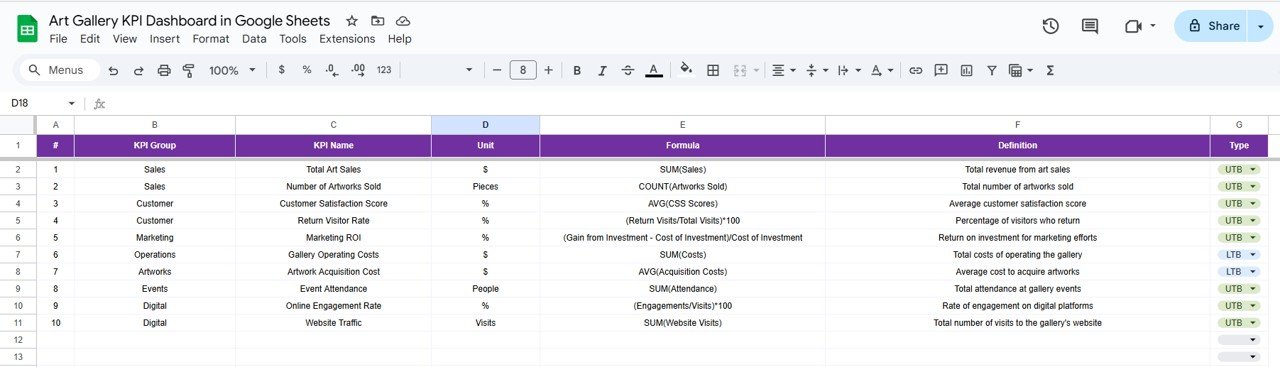
📘 KPI Definition Sheet
-
Clear documentation of all KPIs.
-
Includes KPI name, group, unit, formula, definition, and type.
📦 What’s Inside the Dashboard?
✅ Dashboard Tab – Overview of gallery performance
✅ KPI Trend Tab – Drill down into individual KPIs
✅ Actual Numbers Tab – Data entry for current year
✅ Target Tab – Monthly and annual goals
✅ Previous Year Tab – Store last year’s metrics
✅ KPI Definition Tab – Detailed reference for each KPI
✅ Pre-filled Sample Data – Understand usage instantly
Everything is built into a Google Sheets format, making it accessible, shareable, and easy to customize.
🎯 Who Can Benefit from This Dashboard?
👩🎨 Gallery Managers – Oversee daily and yearly gallery performance.
🖼️ Curators – Evaluate exhibitions and artist engagement.
📈 Finance Teams – Track sales revenue and budget utilization.
👥 Event Coordinators – Monitor visitor counts and attendance rates.
🏢 Art Institutions – Manage multiple galleries with clear reporting.
🧠 How to Use the Art Gallery KPI Dashboard
-
Enter monthly data in the Actual Numbers Sheet.
-
Add KPI targets in the Target Sheet.
-
Input previous year’s results in the Previous Year Tab.
-
Use the Dashboard Tab to monitor overall gallery performance.
-
Explore the KPI Trend Sheet for detailed analysis.
No coding or advanced software required — just Google Sheets. 🌍
🎨 Examples of KPIs to Track
-
Artwork Sales ($) – Revenue from art sold.
-
Visitor Count – Total visitors in a given month.
-
Exhibition Attendance Rate (%) – Attendance vs. capacity.
-
Average Sale per Visitor ($) – Revenue per visitor.
-
Artist Performance Score – Based on sales and engagement.
-
Budget Utilization (%) – Actual vs. planned spending.
Each KPI comes with its unit, formula, and type for clarity.
🚀 Advantages of Using This Dashboard
-
Real-Time Insights – Dynamic charts update as data is entered.
-
Target Tracking – Instantly compare actuals vs. goals.
-
Trend Analysis – Spot patterns with MTD, YTD, and year-over-year data.
-
Time-Saving – All data in one place, no manual reports needed.
-
Customizable – Add or remove KPIs to suit your gallery’s focus.
🔗 Click here to read the Detailed blog post
Watch the step-by-step video Demo:


Reviews
There are no reviews yet.