

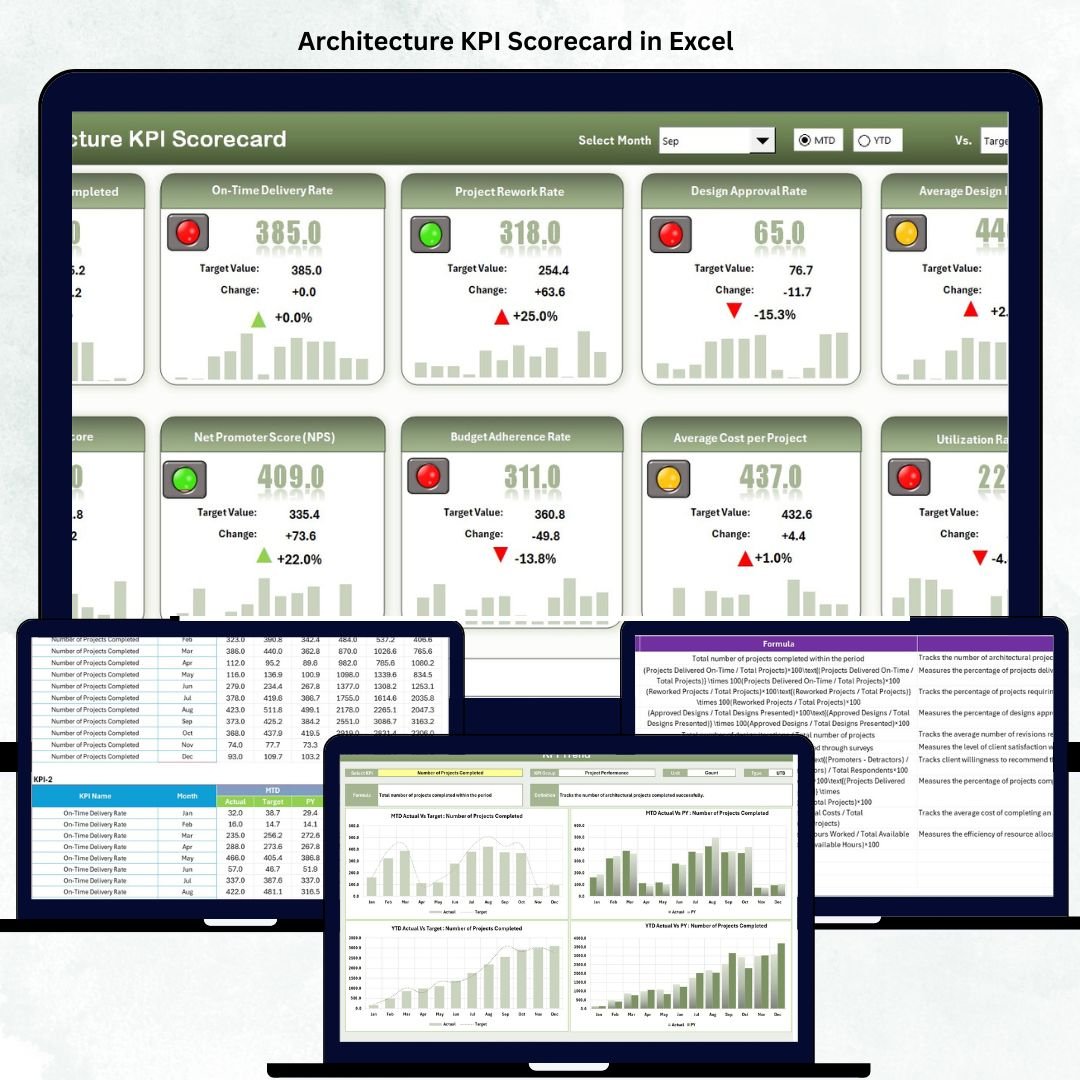

In the modern world of architecture, data-driven performance measurement is no longer optional — it’s essential. From tracking design efficiency and project timelines to monitoring profitability and client satisfaction, every architectural firm needs a clear, measurable way to assess its performance.
That’s where the Architecture KPI Scorecard in Excel from NextGenTemplates.com comes in — a ready-to-use, professional, and interactive Excel template designed to help architects, design studios, and project managers analyze performance through well-defined KPIs.
This Excel-based scorecard transforms raw project data into visual insights, enabling you to make informed decisions and optimize your architectural processes — without complex software or coding.
⚙️ Key Features of the Architecture KPI Scorecard in Excel
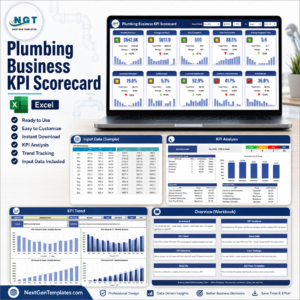
📊 4 Core Worksheets: Scorecard | KPI Trend | Input Data | KPI Definition
📅 MTD & YTD Analysis: Compare Month-to-Date and Year-to-Date performance.
🎯 Target vs Actual Tracking: Instantly measure results against set benchmarks.
📈 Visual Indicators: Color-coded icons show success or underperformance.
🔄 Automated Updates: Real-time dashboard refreshes when data is entered.
💡 Dropdown Filters: Switch between months or analysis types with ease.
🧩 Customizable KPIs: Add or modify metrics as per project requirements.
💻 No Coding Required: 100% Excel-based and fully editable.
🏗️ Structure of the Architecture KPI Scorecard
📊 1️⃣ Scorecard Sheet – The Main Performance Dashboard
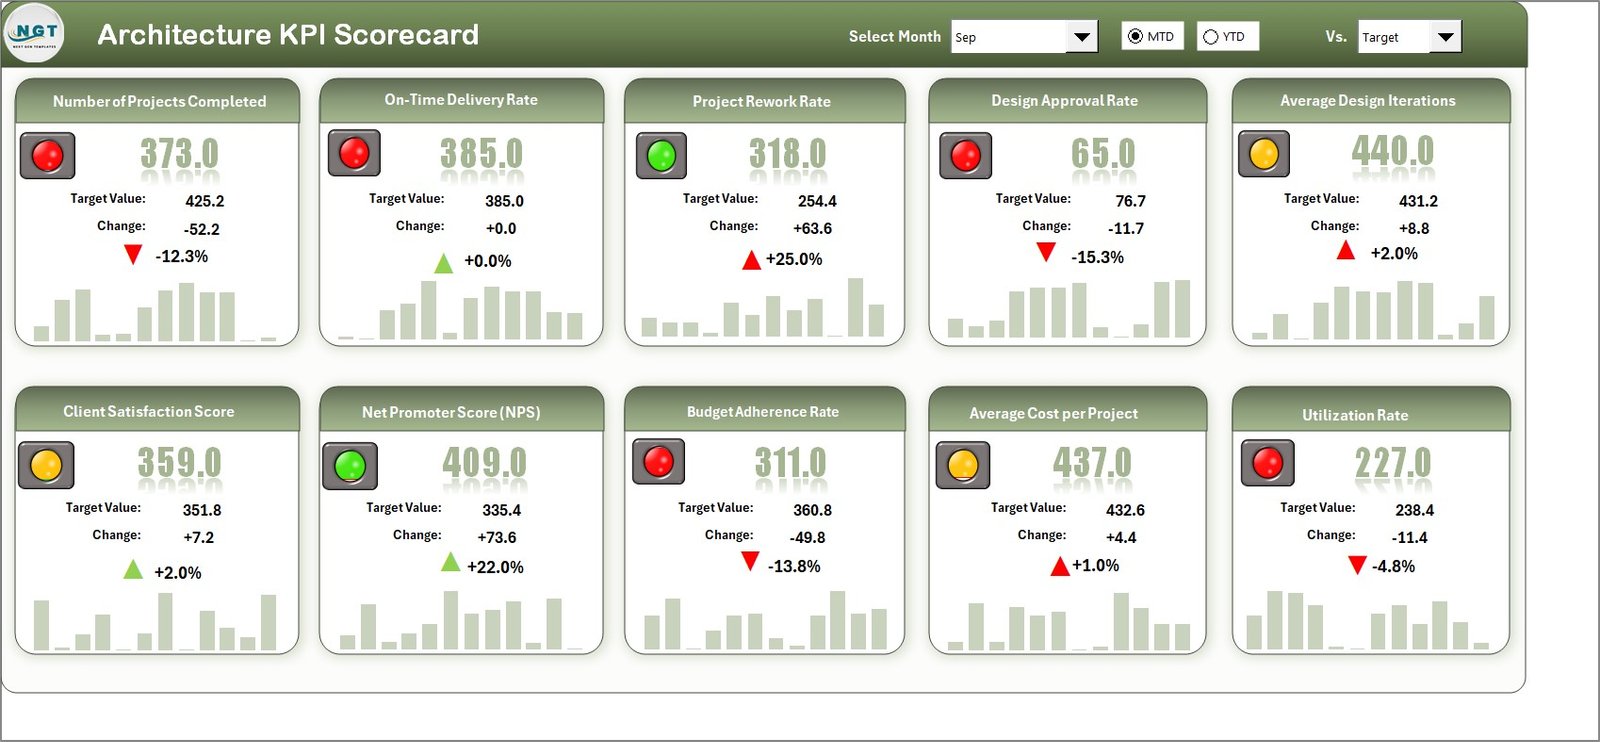
The Scorecard Sheet is the central view where all key KPIs come together.
Highlights:
Dropdown menus for month selection and MTD/YTD analysis.
Actual vs Target comparisons to measure performance.
Color-coded arrows indicating whether KPIs meet, exceed, or fall below targets.
Summary of Actual, Target, and Previous Year (PY) results.
💡 Purpose: Provide a one-glance overview of project efficiency, cost control, and client satisfaction.
📈 2️⃣ KPI Trend Sheet – Analyze Progress Over Time
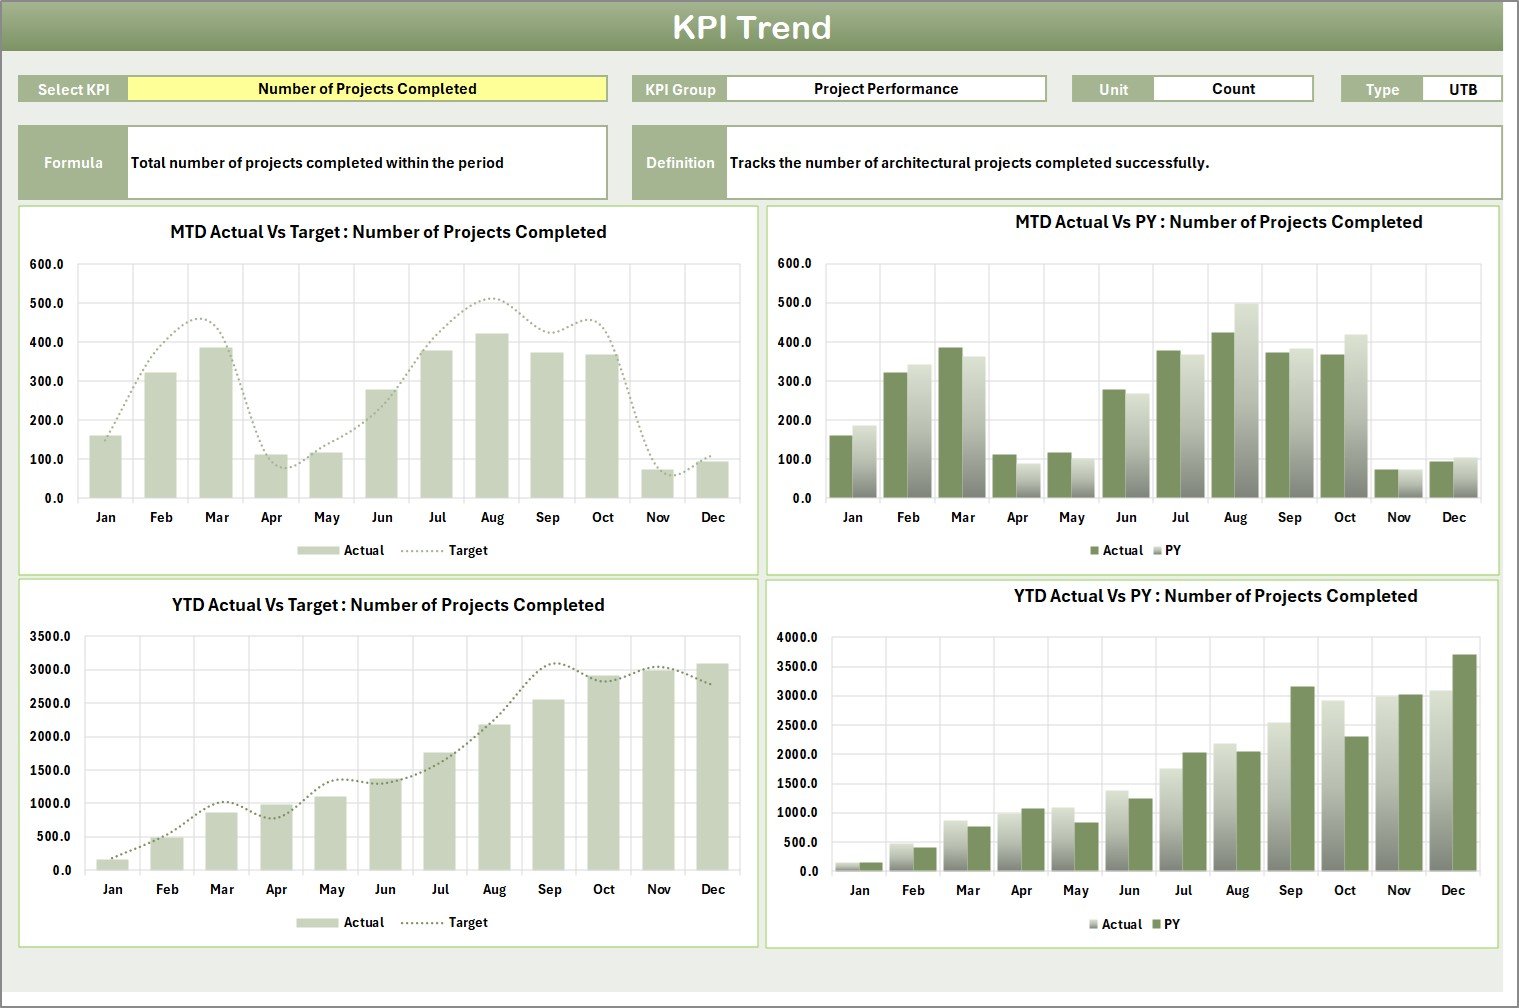
Drill deeper into each KPI to uncover monthly or yearly performance trends.
Features:
Select any KPI from a dropdown (cell C3).
View KPI Group, Unit, Type (LTB/UTB), Formula, and Definition.
Dual trend charts for MTD and YTD — comparing Actual, Target, and PY data.
💡 Purpose: Understand long-term trends and patterns to improve future project planning.
📋 3️⃣ Input Data Sheet – Centralized Data Entry
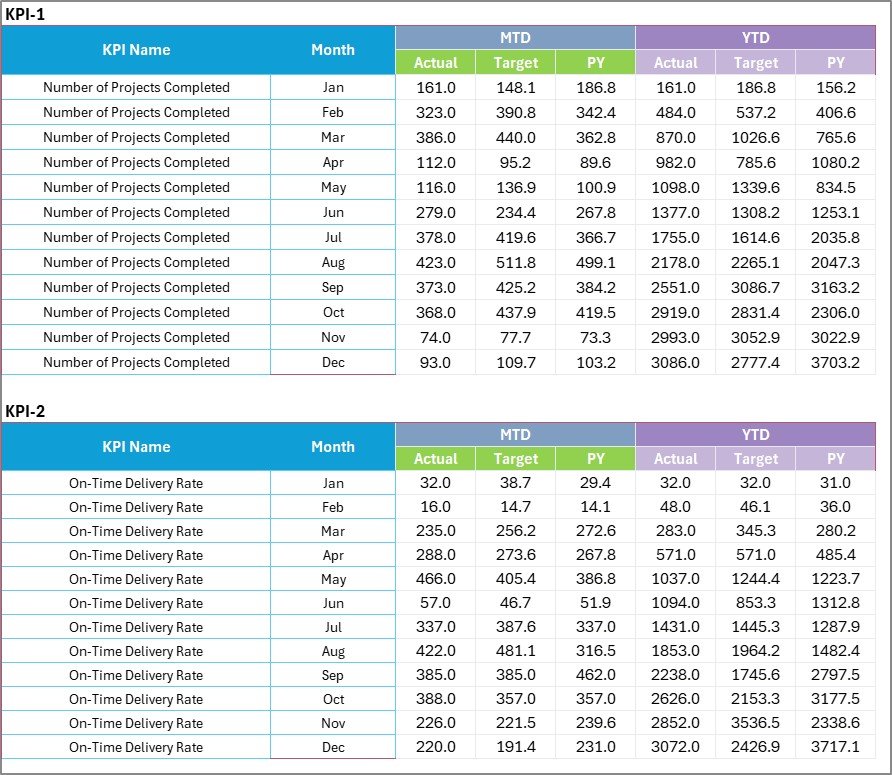
This is where all actual numbers, targets, and previous year data are recorded.
Highlights:
Organized structure for monthly data entry.
Automatic updates across all connected charts and formulas.
Supports data for multiple projects or departments.
💡 Purpose: Keep your dataset structured and ensure your scorecard stays current and accurate.
📘 4️⃣ KPI Definition Sheet – Maintain Clarity and Consistency
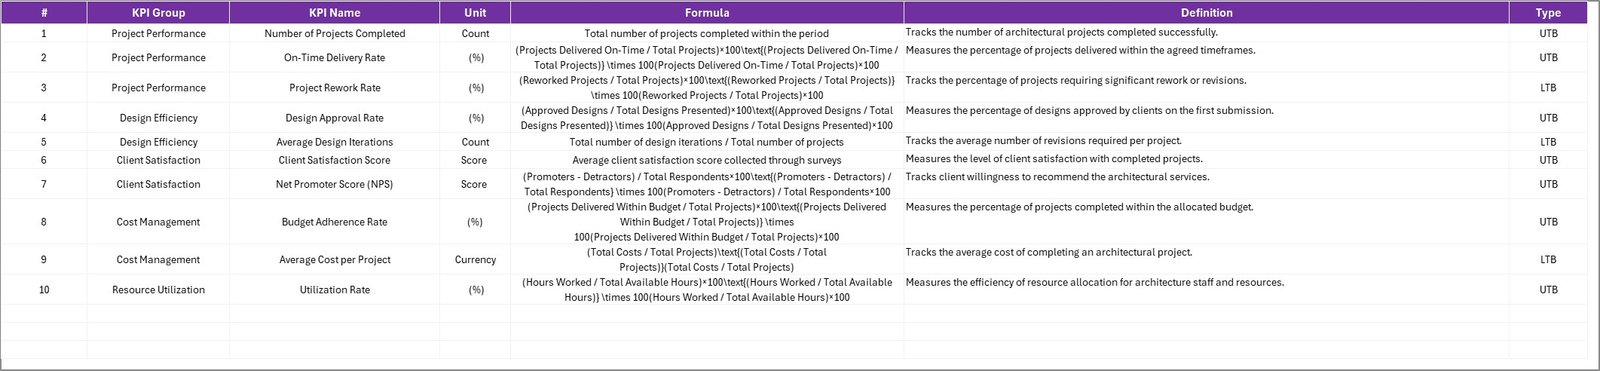
Your built-in KPI Reference Library ensures every metric is clearly defined.
Includes Columns For:
KPI Name
KPI Group (Financial, Operational, Client, or Sustainability)
Unit of Measurement
Formula Used
Definition / Description
KPI Type (LTB / UTB)
💡 Purpose: Eliminate confusion and maintain standard definitions across the organization.
🌟 Advantages of Using the Architecture KPI Scorecard in Excel
✅ Improved Decision-Making: Access all project KPIs in one visual dashboard.
📊 Enhanced Accountability: Assign ownership and track team-level performance.
📈 Profitability Tracking: Detect budget deviations early and boost financial efficiency.
📅 Project Timeline Monitoring: Identify delays before they impact delivery.
💬 Client Satisfaction Insight: Track customer feedback and experience data.
📉 Real-Time Performance View: Data auto-updates for continuous reporting.
💼 Professional Presentation: Ideal for management reviews and client presentations.
💡 Popular KPIs to Track in Architecture
Financial KPIs:
Profit Margin (%)
Project Cost Variance (%)
Billable Hours Ratio (%)
Operational KPIs:
Design Efficiency (%)
Project Delivery Timeliness (%)
Resource Utilization (%)
Client KPIs:
Client Satisfaction Score (1–10)
Repeat Business Rate (%)
Change Order Frequency
Sustainability KPIs:
Green Material Usage (%)
Energy Efficiency Rating (%)
Compliance with Sustainable Standards (%)
💡 All KPIs are fully customizable for your firm’s specific performance priorities.
🧠 Best Practices for Using This Scorecard
📅 Update data monthly to keep insights current.
📊 Use conditional formatting for visual clarity.
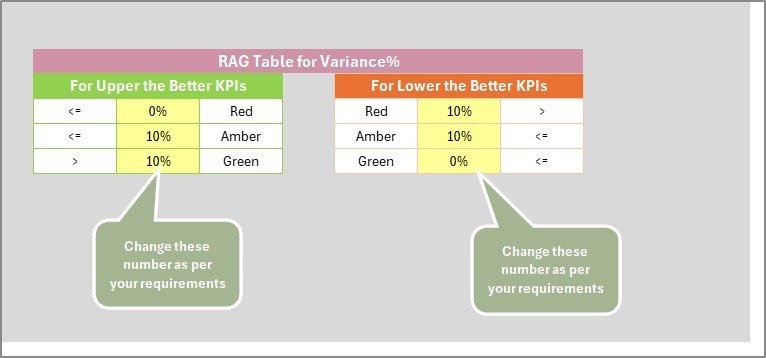
🟢 Green = On Target | 🟡 At Risk | 🔴 Below Target.
🔄 Compare MTD and YTD regularly for balanced analysis.
🧩 Benchmark performance using PY data.
🔐 Protect formula cells to prevent accidental edits.
👥 Share the scorecard with project teams to promote collaboration.
👩💼 Who Can Use This Template
🏗️ Architecture Firms & Design Studios
📐 Project Managers & Design Coordinators
🏢 Construction Consultants & Engineers
📊 Business Analysts & Firm Directors
🧩 Conclusion
The Architecture KPI Scorecard in Excel is more than a spreadsheet — it’s a complete performance management solution for architectural professionals.
It empowers firms to track efficiency, cost, client satisfaction, and sustainability — all within an easy-to-use Excel file.
With interactive visuals, trend charts, and automated KPIs, this scorecard delivers real-time insights that drive smarter design, stronger profitability, and improved project outcomes.
🏗️ Measure success. Optimize design. Deliver excellence — with NextGen Templates’ Architecture KPI Scorecard in Excel.
🔗 Click Here to Read the Detailed Blog Post
📺 Visit our YouTube Channel for step-by-step tutorials.
Watch the step-by-step video tutorial:
Compatibility and Requirements
- Works in Microsoft Excel desktop (Excel 2016 or later, or Microsoft 365).
- You pick the month and the MTD or YTD view from dropdowns, and the KPI Trend sheet has a dropdown to pick a KPI. Microsoft explains dropdowns in Create a drop-down list.
Frequently Asked Questions
Which sheets are included?
Four sheets: Scorecard, KPI Trend, Input Data and KPI Definition.
How do I update the scorecard?
Enter your actual numbers, targets and previous year data on the Input Data sheet. The Scorecard and the charts update from there.
Can I compare month-to-date and year-to-date results?
Yes. Use the dropdowns on the Scorecard sheet to choose the month and the MTD or YTD analysis. The KPI Trend sheet shows MTD and YTD charts for Actual, Target and previous year.
Can I add or change KPIs?
Yes. The KPIs are customizable, and the KPI Definition sheet holds each KPI’s name, group, unit, formula, definition and type (LTB or UTB).
Is there a Google Sheets or other architecture version?
See the Architecture KPI Dashboard in Excel and the Architecture and Design Dashboard in Google Sheets.
Related KPI Scorecard Templates
- Architecture KPI Dashboard in Excel: a dashboard view of architecture KPIs
- Architecture and Design Dashboard in Google Sheets: the same topic in Google Sheets
- Project Management KPI Scorecard in Excel: a scorecard for project delivery
- Procurement KPI Scorecard in Excel: a scorecard for purchasing
- KPI Scorecard Mega Pack: 12 scorecards in one download
Browse all Excel KPI dashboards.






















Reviews
There are no reviews yet.