



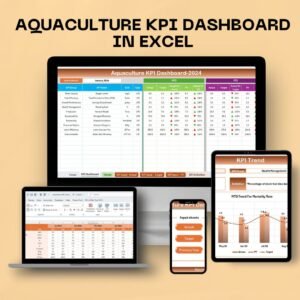
The Aquaculture KPI Dashboard in Excel is an essential tool for businesses in the aquaculture industry, offering powerful insights into the key performance indicators (KPIs) that drive efficiency, productivity, and profitability. This Excel-based dashboard allows you to track and analyze essential metrics such as production rates, feed conversion ratios, water quality, fish growth, and inventory management—all in one place.
Aquaculture businesses can use this dashboard to optimize operations, improve resource allocation, and ensure healthy and sustainable fish farming practices. With easy-to-read visuals and real-time data integration, you can make informed decisions that enhance operational efficiency, improve fish health, and boost production outcomes.

Key Features of the Aquaculture KPI Dashboard in Excel
📊 Production Metrics Tracking
Track the production rates of fish and other aquatic species, allowing you to measure growth rates, harvest cycles, and production volume over time. Monitor key indicators that affect overall production and yield.
💧 Water Quality Monitoring
Monitor vital water quality parameters such as pH, temperature, oxygen levels, and salinity. This ensures optimal living conditions for fish, reducing the risk of diseases and improving growth rates.
📈 Feed Conversion Ratio (FCR)
Track the feed conversion ratio, which is a critical metric in aquaculture. It helps assess the efficiency of feed usage, reduce feed waste, and improve overall profitability.
🧑🔬 Fish Growth Analysis
Monitor the growth progress of fish across various stages. Track the size, weight, and health of fish to ensure they reach optimal market size efficiently.
📅 Inventory Management
Manage inventory for feed, fish stock, equipment, and other resources. The dashboard helps track supplies, reduce waste, and improve resource allocation.
⚙️ Customizable & Scalable
The dashboard is customizable to fit the unique needs of your aquaculture business. You can adjust KPIs, data sources, and visualizations to reflect your specific operations and goals.
Why You’ll Love the Aquaculture KPI Dashboard in Excel
✅ Optimized Fish Farming Operations
Monitor and manage all aspects of your aquaculture business, from production and fish health to water quality and resource allocation.
✅ Improve Feed Efficiency & Reduce Waste
Track feed conversion ratios and monitor feed usage to ensure efficient and cost-effective feeding strategies.
✅ Enhance Water Quality Management
Regularly monitor water parameters to maintain optimal conditions for fish growth, reducing the risk of disease and improving overall health.
✅ Increase Production Yield
Utilize insights from the dashboard to optimize fish growth, adjust feeding strategies, and enhance production efficiency for higher yield.
✅ Customizable & Scalable
The dashboard is designed to scale with your operations. Whether you manage a small fish farm or a large aquaculture enterprise, this tool can be tailored to meet your specific business needs.
What’s Inside the Aquaculture KPI Dashboard in Excel?
Production Metrics: Track production rates, harvest cycles, and growth progress.
Water Quality Monitoring: Measure pH, oxygen levels, temperature, and salinity.
Feed Conversion Ratio (FCR): Monitor feed efficiency and reduce waste.
Fish Growth Analysis: Track fish size and weight across different stages.
Inventory Management: Keep track of feed, fish stock, and other resources.
Customizable KPIs: Tailor the dashboard to reflect the KPIs that matter most for your business.
How to Use the Aquaculture KPI Dashboard in Excel
1️⃣ Download the Template: Access the Aquaculture KPI Dashboard in Excel instantly.
2️⃣ Input Your Data: Enter data for fish growth, water quality, feed conversion, and production rates.
3️⃣ Track KPIs & Performance: Monitor vital metrics such as production volumes, feed usage, and water quality.
4️⃣ Analyze & Optimize: Use insights from the dashboard to adjust operations, improve efficiency, and increase yield.
5️⃣ Manage Inventory: Keep an eye on inventory levels for feed, stock, and equipment to ensure proper resource management.
Who Can Benefit from the Aquaculture KPI Dashboard in Excel?
🔹 Aquaculture Farms & Fisheries
🔹 Fish and Seafood Producers
🔹 Fish Health & Nutrition Experts
🔹 Supply Chain & Logistics Managers
🔹 Business Owners & Managers in the Aquaculture Industry
🔹 Environmental Scientists & Water Quality Specialists
🔹 Small & Large Aquaculture Enterprises
Improve your fish farming business with the Aquaculture KPI Dashboard in Excel. Track production, water quality, feed efficiency, and inventory, while making data-driven decisions that enhance operational efficiency and profitability.
Click here to read the Detailed blog post
Visit our YouTube channel to learn step-by-step video tutorials
Youtube.com/@PKAnExcelExpert






























Reviews
There are no reviews yet.