


The Agriculture KPI Dashboard in Google Sheets is a powerful tool designed to help agricultural professionals effectively track, analyze, and optimize key performance indicators (KPIs) within their operations. This comprehensive dashboard consolidates vital metrics such as crop yield, soil health, irrigation efficiency, and labor productivity, providing an overview of operational performance.
By using this Google Sheets-based dashboard, agricultural teams can make data-driven decisions, optimize farming processes, reduce costs, and ensure sustainability in their practices.
Key Features of the Agriculture KPI Dashboard in Google Sheets
📊 Comprehensive KPI Tracking
-
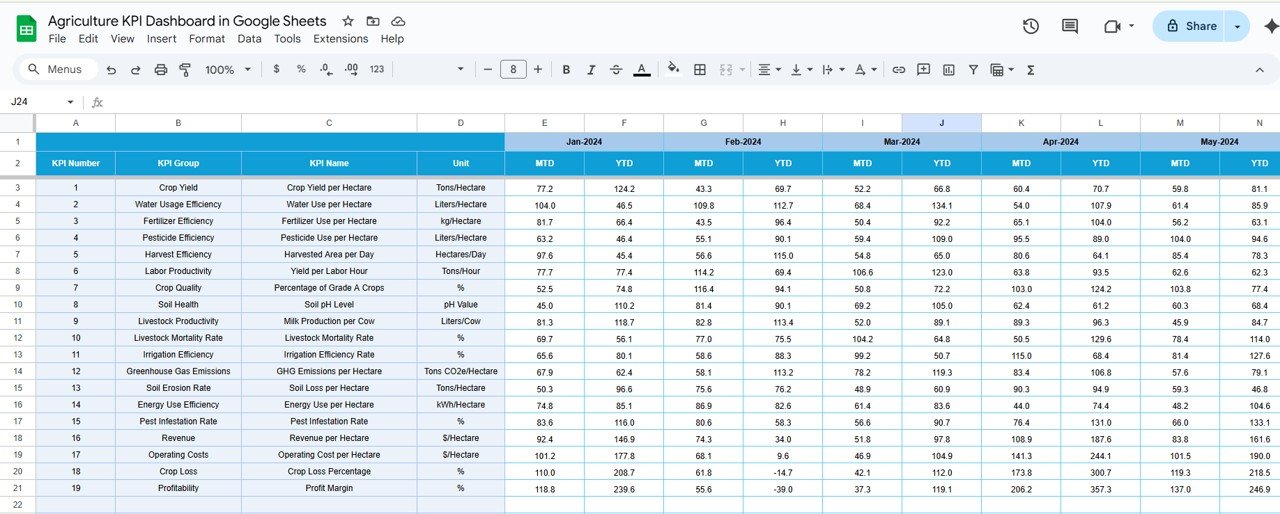
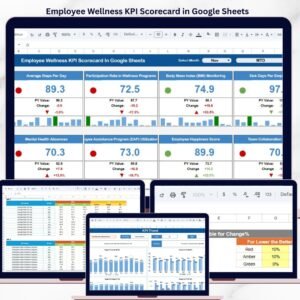
Monitor Essential Metrics: Track KPIs like crop yield per hectare, irrigation efficiency, soil moisture levels, and labor productivity in one place.
-
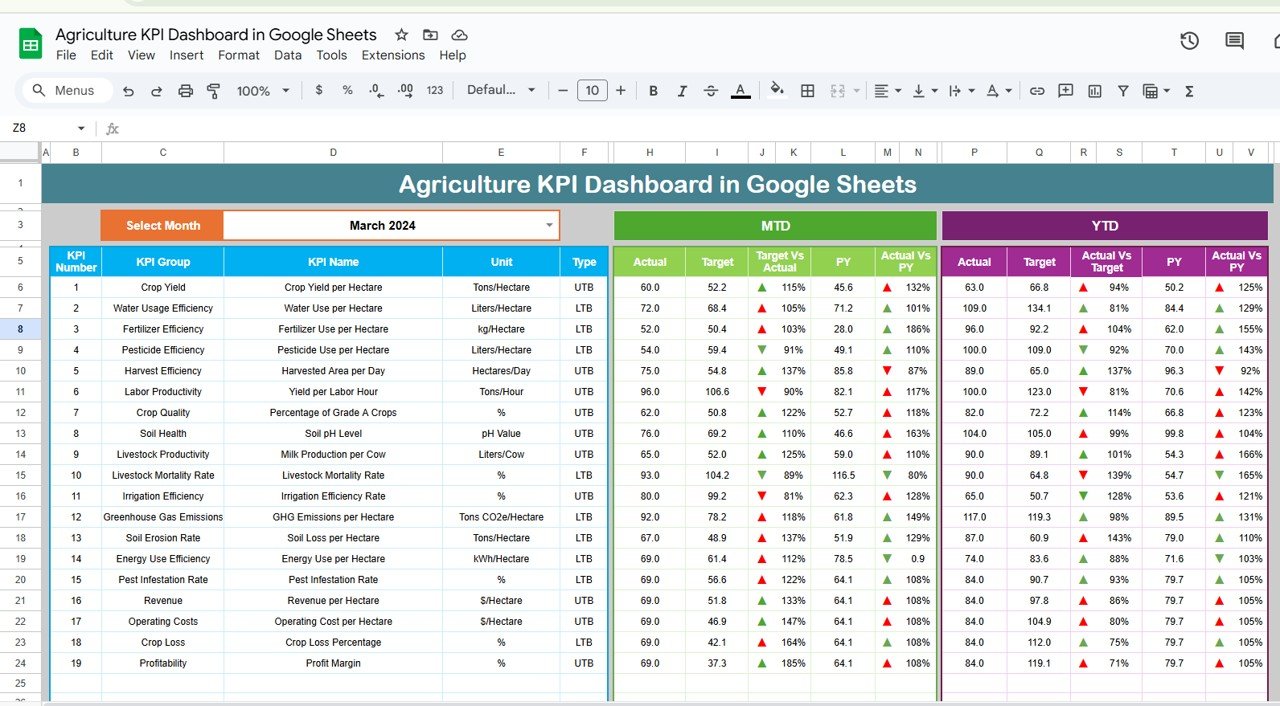
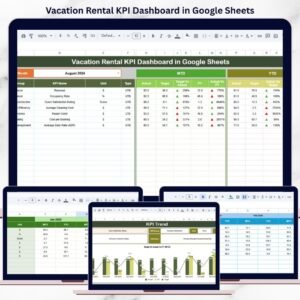
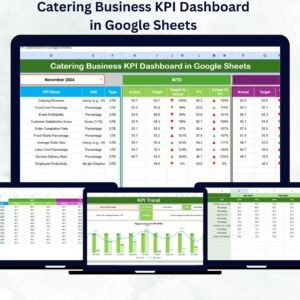
Real-Time Data Visualization: Use dynamic charts and graphs to visualize trends, making it easier to identify areas for improvement in agricultural operations.
📈 Customizable Inputs
-
Tailor the Dashboard to Your Needs: Easily input actual, target, and historical data, ensuring that the dashboard aligns with your specific goals and operations.
-
Data Integration: Import data from various agricultural systems or manual records to keep the dashboard updated with real-time information.
🔧 User-Friendly Interface
-
Easy to Use: Designed with simplicity in mind, the dashboard is accessible even for users with limited experience in Google Sheets.
-
Flexible Layout: Customize the layout and KPIs as needed to fit your business needs and improve decision-making.
📅 Performance Monitoring & Reporting
-
Track MTD & YTD: Monitor Month-to-Date (MTD) and Year-to-Date (YTD) performance to assess operational progress and performance against targets.
-
Target vs. Actual Comparison: Compare actual performance with set targets to ensure the operation is meeting business objectives.
Benefits of Using the Agriculture KPI Dashboard in Google Sheets
✅ Informed Decision-Making
With access to real-time data, you can make informed decisions that enhance efficiency and drive better outcomes in crop management and resource utilization.
✅ Increased Operational Efficiency
Identify inefficiencies, such as low crop yield or irrigation issues, and take action to optimize the farming process and reduce costs.
✅ Promotes Accountability
Transparent tracking of KPIs ensures accountability within the team, ensuring that every member works towards achieving the operational goals.
✅ Streamlined Reporting
Simplify your reporting process with automated data collection and visualization, saving you time and ensuring consistent tracking of farming performance.
Getting Started with Your Agriculture KPI Dashboard in Google Sheets
-
Download the Template: Start by downloading the Agriculture KPI Dashboard template to begin customizing it for your farm or agricultural operations.
-
Set Up Your KPIs: Identify the key performance indicators that align with your farming goals, such as crop yield, irrigation efficiency, and labor productivity.
-
Import Data: Integrate data from your agricultural systems or manually input your data to keep the dashboard updated.
-
Monitor & Analyze: Track performance, analyze trends, and evaluate your farm’s productivity to identify areas for improvement.
-
Optimize Your Farming Processes: Use the insights from the dashboard to make strategic decisions that will optimize your operations, reduce costs, and increase productivity.
By using the Agriculture KPI Dashboard in Google Sheets, your team can optimize farming processes, increase productivity, and ensure the sustainability of your agricultural operations.
Click here to read the Detailed blog post
Agriculture KPI Dashboard in Google Sheets
Visit our YouTube channel to learn step-by-step video tutorials
YouTube.com/@NeotechNavigators


Reviews
There are no reviews yet.