


Managing an agribusiness today is not just about farming—it is about performance, efficiency, cost control, and sustainability. However, when KPI data is spread across notebooks, registers, or unstructured Excel files, decision-making becomes slow, reactive, and risky.
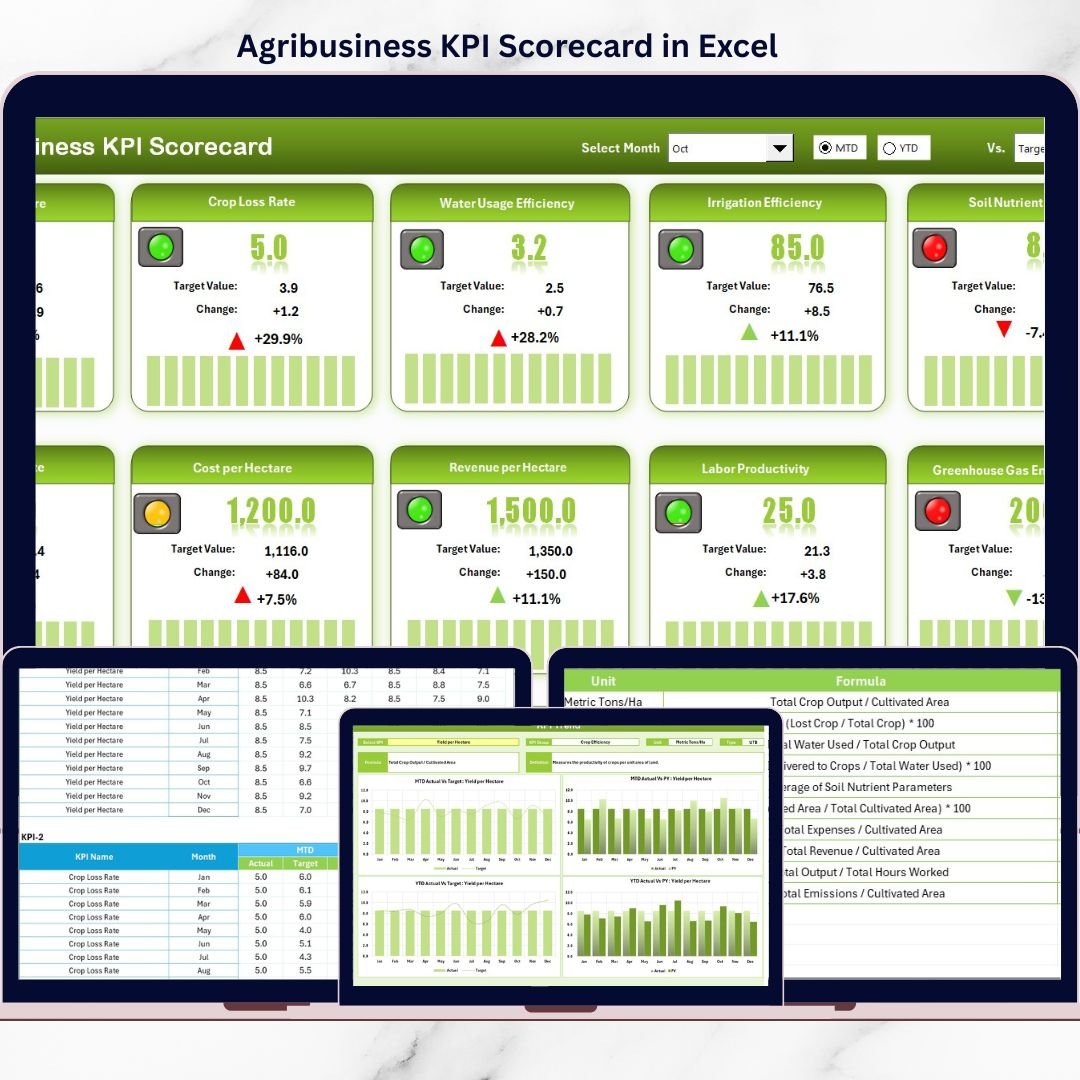
Agribusiness KPI Scorecard in Excel That is exactly where the Agribusiness KPI Scorecard in Excel becomes a game-changing performance management tool.
This ready-to-use Excel template helps agribusiness owners, farm managers, and agricultural consultants track, monitor, and analyze key KPIs in one structured scorecard. Instead of guessing or reacting late, you gain clear visibility, real-time insights, and data-driven control over your agribusiness operations.
🔑 Key Features of Agribusiness KPI Scorecard in Excel
📊 Centralized KPI Dashboard
Track all critical agribusiness KPIs in one structured Excel scorecard instead of managing multiple files.
🎯 MTD & YTD Performance Tracking
Analyze Month-to-Date and Year-to-Date performance to monitor short-term results and long-term trends.
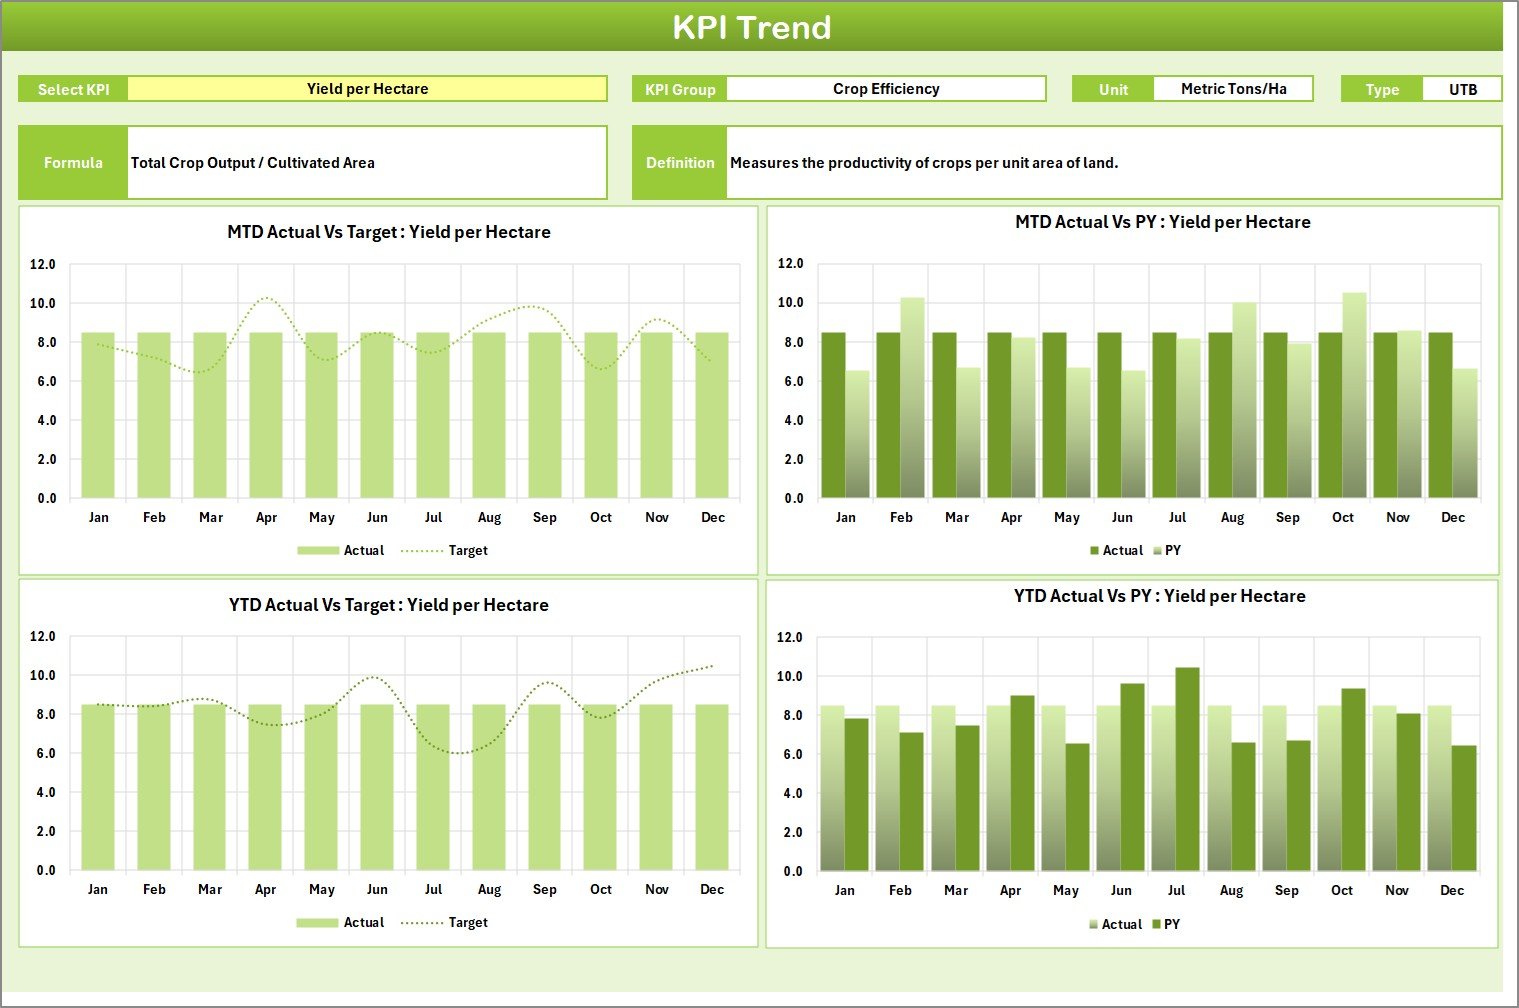
📈 KPI Trend Analysis
Visualize KPI trends over time to identify performance improvements, risks, and seasonal patterns.
🧮 Actual vs Target Comparison
Instantly compare actual performance against defined targets and identify gaps.
🎨 Visual Performance Indicators
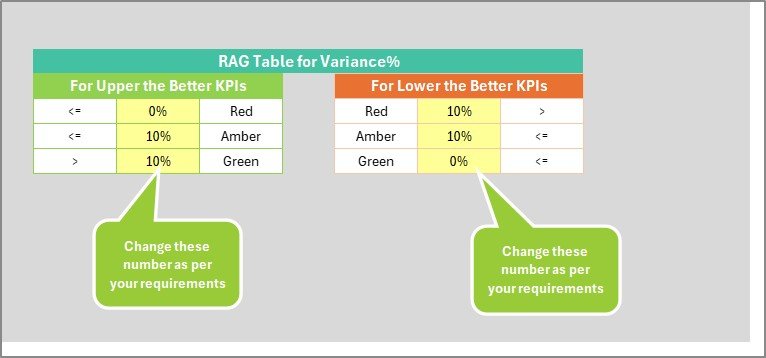
Conditional formatting highlights good, average, and poor performance at a glance.
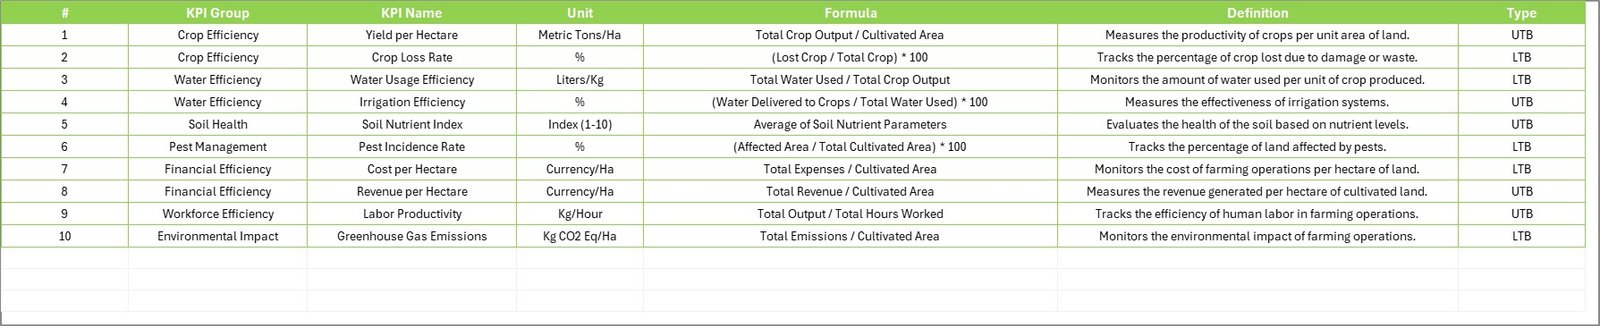
📝 Standardized KPI Definitions
Maintain consistent KPI names, formulas, units, and definitions for clarity across teams.
📦 What’s Inside the Agribusiness KPI Scorecard in Excel
This professionally designed Excel template includes four structured worksheets, each serving a clear purpose:
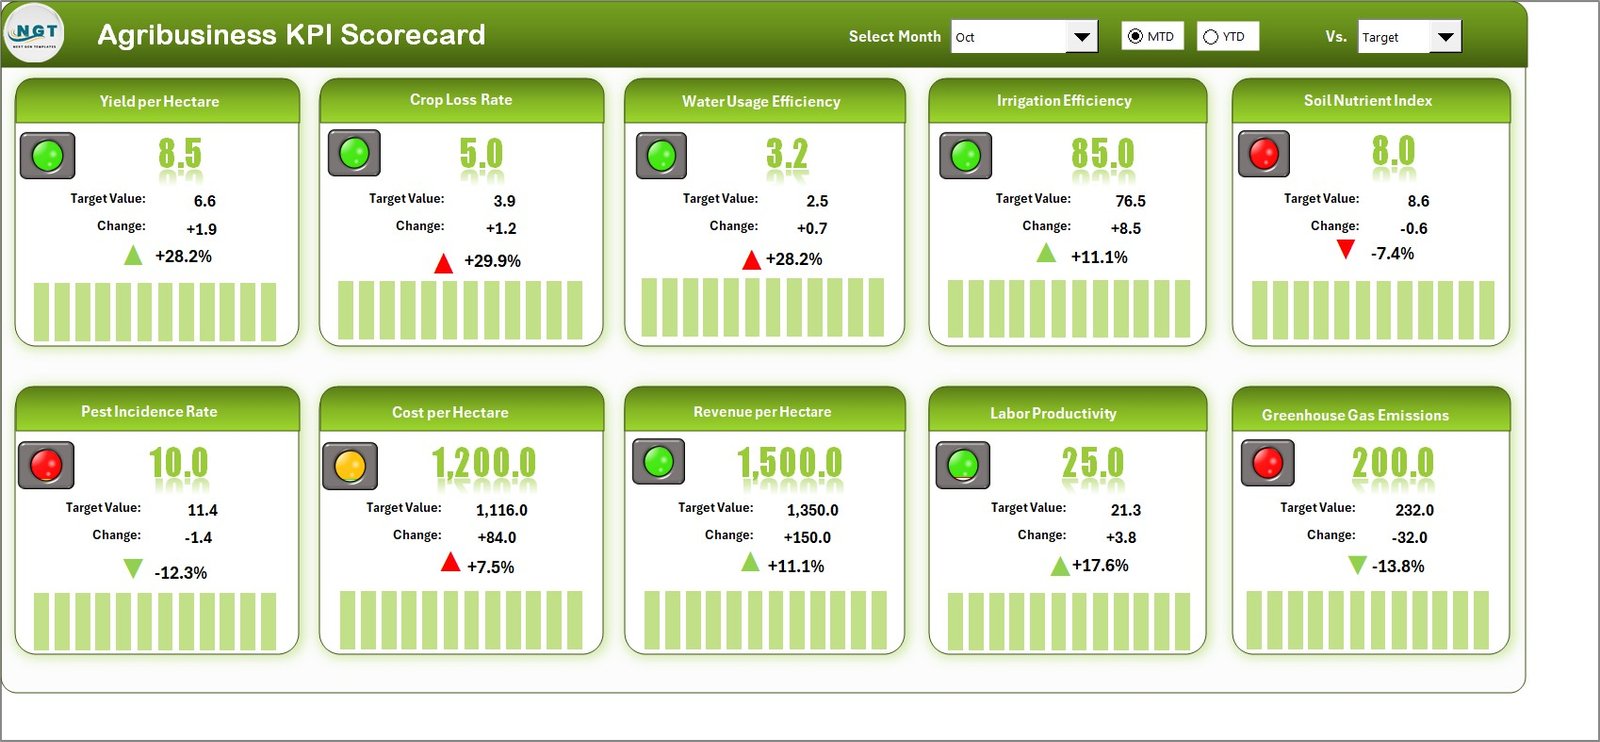
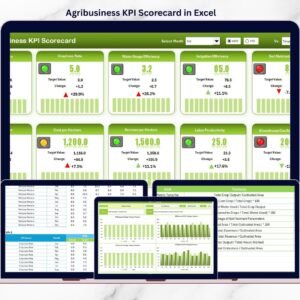
📊 Scorecard Sheet (Main Dashboard)
Dropdowns to select Month, MTD, or YTD
Actual vs Target values with variance
Color-coded performance indicators
Complete KPI performance snapshot
📈 KPI Trend Sheet
Select KPI from dropdown
View KPI group, unit, type, formula, and definition
MTD, YTD, and Previous Year trend charts
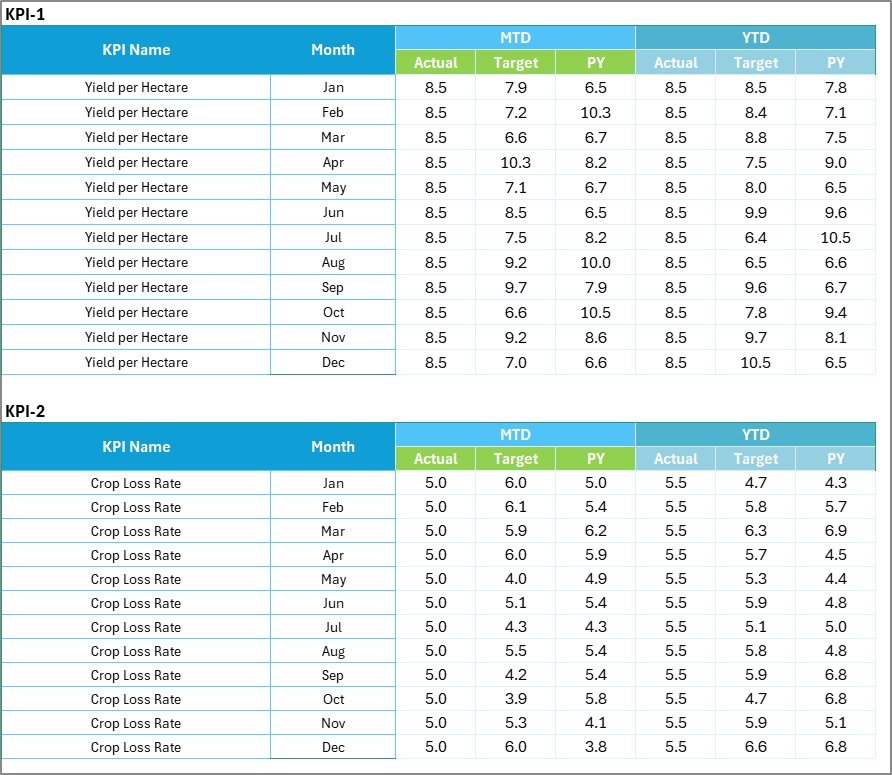
🧾 Input Data Sheet
Simple monthly data entry
Actual and target values
Clean, structured format to reduce errors
📋 KPI Definition Sheet
KPI name and group
Unit of measurement
Formula and definition
Acts as a single source of truth
⚙️ How to Use the Agribusiness KPI Scorecard in Excel
Using this scorecard is simple and user-friendly, even if you are not an Excel expert:
1️⃣ Enter monthly actual and target data in the Input Data sheet
2️⃣ Define or update KPIs in the KPI Definition sheet
3️⃣ Select Month, MTD, or YTD from dropdowns
4️⃣ Instantly view updated results on the Scorecard
5️⃣ Analyze individual KPIs using the Trend Sheet
No macros, no coding, and no additional software required—everything works inside Excel.
👨🌾 Who Can Benefit from This Agribusiness KPI Scorecard
This Excel KPI scorecard is ideal for:
🌾 Farm owners and agribusiness entrepreneurs
📋 Agribusiness and operations managers
📊 Agricultural consultants and advisors
💰 Finance, planning, and reporting teams
🏢 Cooperatives and Agri-enterprises
If you want clarity, accountability, and smarter decisions, this template is built for you.
🚀 Why Choose This Agribusiness KPI Scorecard?
✅ Centralized performance visibility
✅ Faster and better decision-making
✅ Reduced reporting time
✅ Improved accountability
✅ Excel-based simplicity and flexibility
Stop relying on intuition. Start managing your agribusiness with data-driven confidence.
📘 Click here to read the Detailed blog post
🎥 Visit our YouTube channel to learn step-by-step video tutorials
Watch the step-by-step video tutorial:
Compatibility and Requirements
- Works in Microsoft Excel desktop (Excel 2016 or later, or Microsoft 365).
- You pick the month, MTD or YTD, and the KPI on the Trend sheet, from dropdowns. Microsoft explains them in Create a drop-down list.
Frequently Asked Questions
Which sheets are included?
Four sheets: Scorecard, KPI Trend, Input Data and KPI Definition.
How do I update the scorecard?
Enter your monthly actual and target values in the Input Data sheet. Then choose the month, MTD or YTD from the dropdowns on the Scorecard sheet and the results update.
Can I see how a single KPI changes over time?
Yes. Pick a KPI from the dropdown on the KPI Trend sheet. It shows the KPI group, unit, type, formula and definition, with MTD, YTD and Previous Year trend charts.
How do I see which KPIs are on target?
The Scorecard sheet compares actual values with targets and shows the variance. Color-coded indicators mark good, average and poor performance.
Does it need macros?
No. The template needs no macros, coding or extra software. Everything works inside Excel.
Related KPI Scorecard Templates
- Environmental KPI Scorecard in Excel: a scorecard for environmental measures
- Procurement KPI Scorecard in Excel: a scorecard for purchasing and suppliers
- Operations KPI Scorecard in Excel: a scorecard for day-to-day operations
- Manufacturing KPI Scorecard in Excel: a scorecard for production teams
- KPI Dashboard Library (Excel): 15 KPI dashboard templates in one download
Browse all Excel KPI dashboards.




















Reviews
There are no reviews yet.