


The best pharmaceutical dashboard Excel option for most manufacturing teams is the Pharmaceutical KPI Dashboard in Excel ($14.99): it tracks OEE, batch right-first-time, deviations and yield out of the box. Below we rank eight pharma manufacturing templates across Excel, Google Sheets and Power BI, priced $9.99–$14.99.
Last updated: September 2026
Key takeaways
- Our top pick is the Pharmaceutical KPI Dashboard in Excel at $14.99 — the fastest way to see OEE, right-first-time and deviation trends in one screen.
- Best value is the Pharmaceutical KPI Dashboard in Google Sheets at $9.99, which lets QA, production and the plant head edit the same live file.
- Enterprise pharma QMS/MES SaaS (Veeva Vault, MasterControl, Sparta TrackWise) typically runs $20,000–$200,000 per year; a one-time $9.99–$14.99 template covers the reporting layer for a fraction of that.
- World-class OEE is roughly 85%, yet most pharma lines sit at 30–45% because of cleaning validation and changeovers — a dashboard that surfaces the gap pays for itself in one shift.
- All eight templates are one-time purchases with lifetime use, no per-seat fees, and ship in Excel, Google Sheets or Power BI so you can match your existing stack.
Pharmaceutical manufacturing templates compared
| Template | Format | Best For | Price |
|---|---|---|---|
| Pharmaceutical KPI Dashboard (Best overall) | Excel | Plant-wide GMP + OEE reporting | $14.99 |
| Clinical Trials Management KPI Dashboard | Excel | R&D and trial operations | $14.99 |
| Pharmaceuticals KPI Dashboard | Excel | Multi-product portfolio view | $12.99 |
| Pharmaceuticals KPI Dashboard | Power BI | Interactive, refreshable analytics | $11.99 |
| Pharmaceutical KPI Dashboard (Best value) | Google Sheets | Collaborative, cloud-based teams | $9.99 |
| Pharmacy KPI Dashboard | Excel | Dispensing and pharmacy operations | $12.99 |
| Pharmacy KPI Dashboard | Power BI | Pharmacy chain analytics | $11.99 |
| Pharmacy KPI Dashboard | Google Sheets | Budget single-pharmacy tracking | $9.99 |
How we picked these
We searched the NextGenTemplates catalog of roughly 6,900 published products and filtered to templates built specifically for pharmaceutical and pharmacy operations — not generic manufacturing sheets relabelled for pharma. Each finalist had to track at least one regulated metric (batch quality, deviations, yield or dispensing accuracy) and ship ready to fill, with sample data already wired to the charts.
We excluded free downloads, single-chart files, and anything with hard-coded values you cannot change. Every template here is a paid, maintained product with lifetime access. We also deliberately spread the list across Excel, Power BI and Google Sheets so you can pick the format your validation and IT teams already support, rather than adding a new tool to qualify.
Pharmaceutical manufacturing carries a reporting burden few other industries face: every batch generates deviation logs, in-process checks, environmental monitoring and yield data that regulators expect to see reconciled. Teams without a dashboard usually rebuild the same summary in a fresh spreadsheet each month, which is slow and error-prone. A well-built pharmaceutical dashboard Excel file gives that summary a permanent home, so the monthly review becomes a data refresh rather than a rebuild — the same efficiency argument we make in our sales dashboard templates and project management dashboard roundups.
The 8 best pharmaceutical manufacturing templates for 2026
1. Pharmaceutical KPI Dashboard in Excel — best overall
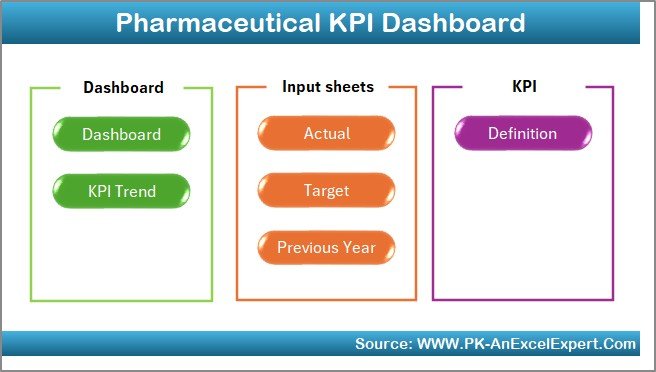
This is the pharmaceutical dashboard Excel template we hand to most plants first. It consolidates production, quality and compliance KPIs onto a single scorecard so the plant head, QA lead and production manager all read from the same numbers in a morning stand-up.
Who it is for: pharmaceutical manufacturing sites that need a GMP-aware operations dashboard without buying an enterprise MES.
What is inside:
- OEE broken into availability, performance and quality
- Batch right-first-time (RFT) and yield-per-batch trends
- Deviation, CAPA and out-of-specification (OOS) counts
- Downtime Pareto and month-over-month KPI comparison
Practical uses: flag a line where OEE drops below your 45% target before it becomes a backlog; watch RFT slip from 98% to 94% and catch the process drift; quantify how many batches an extra cleaning cycle really costs. Because it is native Excel, your validation team can review every formula — something a black-box SaaS report cannot offer.
Price: $14.99. Get the Pharmaceutical KPI Dashboard in Excel →
Best for: the default choice for a plant-wide pharma manufacturing scorecard in Excel.
2. Clinical Trials Management KPI Dashboard in Excel — best for R&D
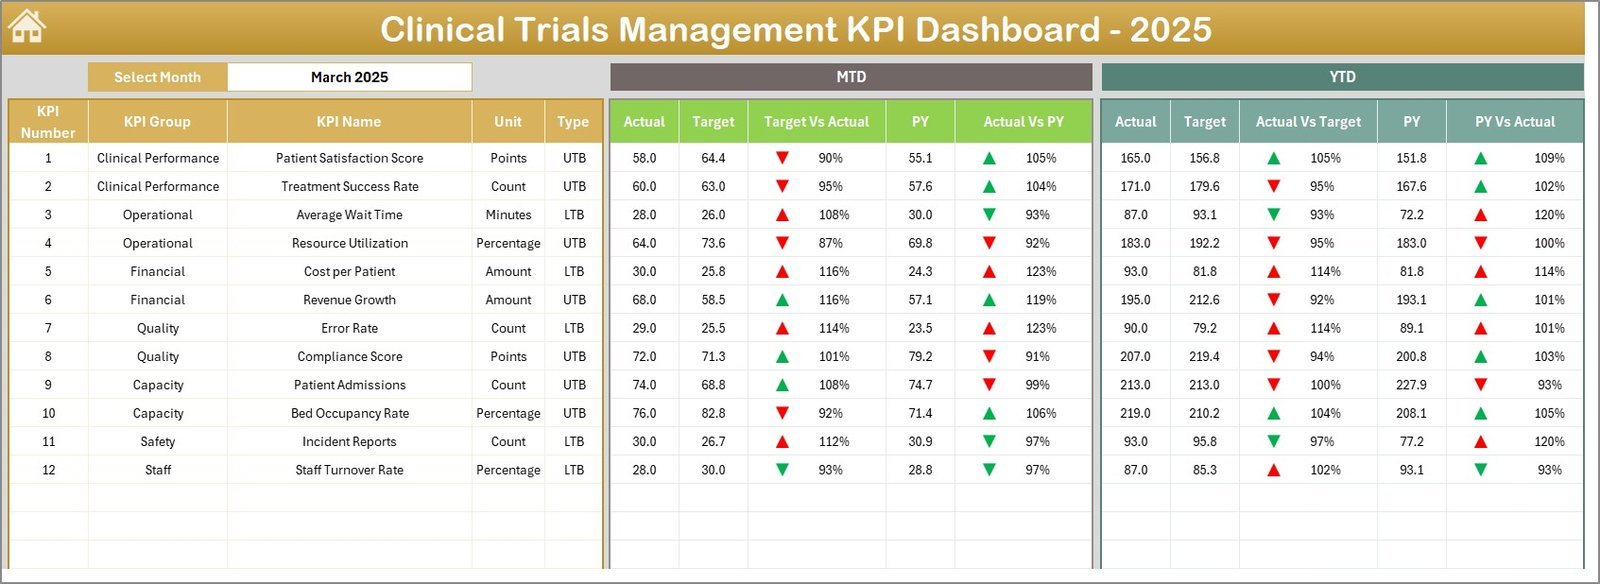
Before a drug reaches the manufacturing floor it lives in clinical trials, and this template tracks that phase. It manages enrolment, site performance, protocol deviations and budget burn across studies — the reporting layer teams usually rebuild by hand every week.
Who it is for: clinical operations, CROs and pharma R&D teams running one or more trials.
What is inside:
- Patient enrolment vs target, by site and study
- Screen-failure and dropout rates
- Protocol deviation and adverse-event logs
- Trial budget vs actual and milestone timeline
Practical uses: spot a site enrolling at 40% of plan before it delays the read-out; track screen-failure rates climbing past 30% so you can revisit inclusion criteria; give sponsors a one-page status instead of a 20-tab workbook. Enrolment slippage is the single biggest driver of trial cost overruns, so surfacing it early is worth far more than the price.
Price: $14.99. Get the Clinical Trials Management KPI Dashboard →
Best for: pharma R&D and clinical operations reporting in Excel.
3. Pharmaceuticals KPI Dashboard in Excel — best for a portfolio view
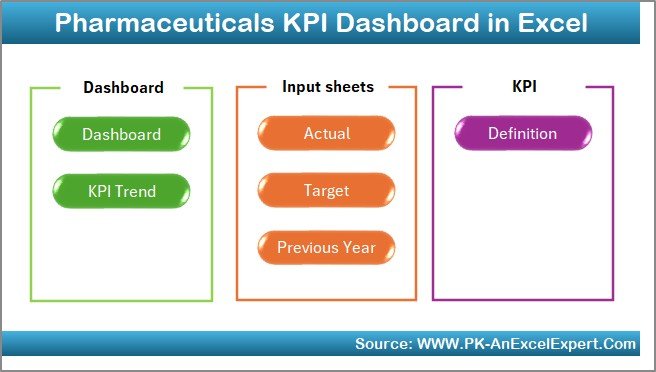
Where the top pick focuses on one site, this template is built to compare several products or lines side by side. It is the Excel option for a pharma company that makes multiple SKUs and wants a portfolio-level read on output, quality and cost.
Who it is for: multi-product manufacturers and operations directors overseeing more than one line.
What is inside:
- Production volume and yield by product
- Quality and rejection rate comparison
- Cost-per-unit and inventory turns
- Trend charts with drill-into-detail tables
Practical uses: rank your SKUs by margin and rejection rate so you know which line deserves the next capex; catch inventory turns falling below four so you cut expiry write-offs; hand finance a costed output view without exporting from three systems. The side-by-side layout is what makes it different from the single-site scorecard at number one.
Price: $12.99. Get the Pharmaceuticals KPI Dashboard in Excel →
Best for: multi-product pharma portfolio reporting in Excel.
4. Pharmaceuticals KPI Dashboard in Power BI — best for interactive analytics

This is the same pharma KPI set rebuilt for Power BI, so you get slicers, drill-through and a data model that refreshes on a schedule. If your reporting already lives in Power BI, this drops in without adding a spreadsheet to maintain.
Who it is for: data teams and larger sites that want interactive, refreshable pharma analytics.
What is inside:
- Interactive OEE, yield and quality visuals
- Slicers by product, line, shift and period
- Drill-through from summary to batch detail
- A reusable data model you point at your own source
Practical uses: let a plant manager filter to one line and one shift without touching a formula; schedule a refresh so the morning meeting always shows last night’s run; publish to the Power BI service so head office and the site see identical numbers. Compared with a $30,000-plus BI implementation, this is a starting model you own outright.
Price: $11.99. Get the Pharmaceuticals KPI Dashboard in Power BI →
Best for: interactive, refreshable pharma reporting in Power BI.
5. Pharmaceutical KPI Dashboard in Google Sheets — best value
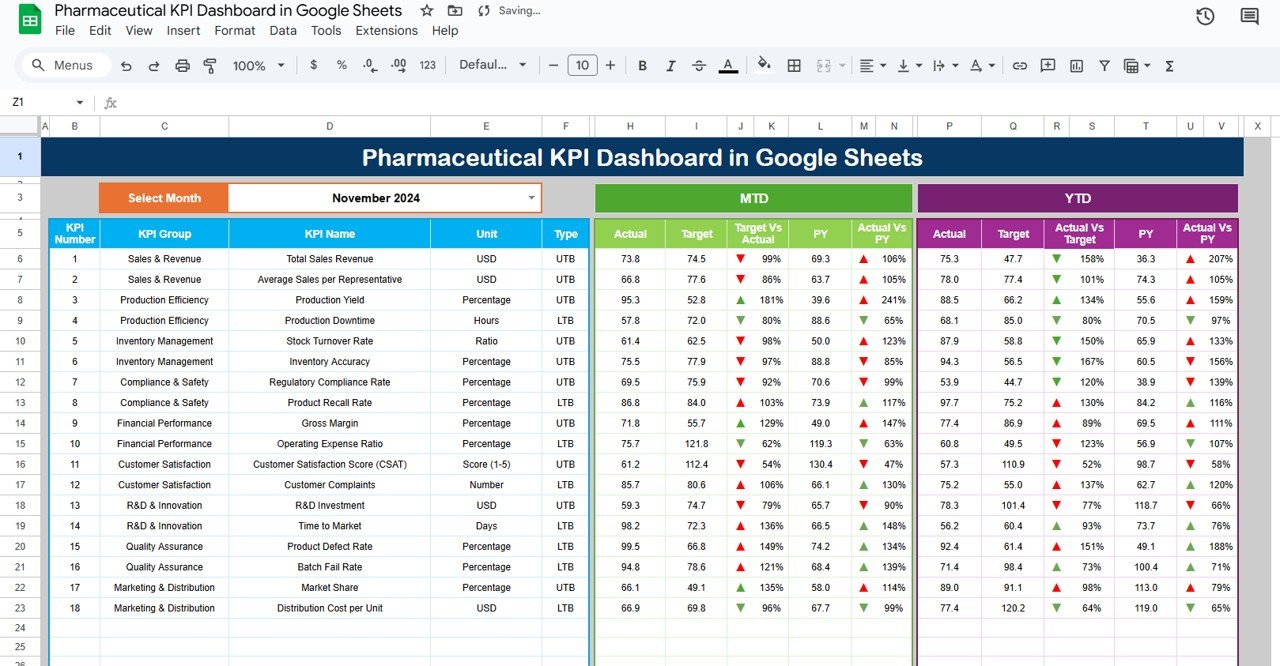
At $9.99 this is the best-value pick and the one to choose when several people need to edit the same file at once. Being cloud-native, QA, production and the plant head can all update it live, and there is nothing to install or license per seat.
Who it is for: distributed teams, contract manufacturers and anyone standardised on Google Workspace.
What is inside:
- Core pharma KPIs: OEE, yield, RFT, deviations
- Live-editable data entry with auto-updating charts
- Shareable links with view or edit control
- Mobile-friendly review on phone or tablet
Practical uses: let a night-shift supervisor log downtime from the floor on a tablet; share a read-only link with an auditor without emailing a file; keep one source of truth when three sites feed the same report. For a small pharma operation that has not committed to Excel or Power BI, this is the lowest-risk way to start measuring.
Price: $9.99. Get the Pharmaceutical KPI Dashboard in Google Sheets →
Best for: collaborative, cloud-based pharma teams on a budget.
6. Pharmacy KPI Dashboard in Excel — best for dispensing operations

Manufacturing is only half of pharma; the other half is dispensing. This template tracks the pharmacy side — prescription volume, dispensing accuracy, inventory and revenue — and is ideal for hospital pharmacies and retail outlets that report in Excel.
Who it is for: hospital and retail pharmacy managers accountable for accuracy and stock.
What is inside:
- Prescriptions filled and dispensing error rate
- Inventory value, stock-outs and expiry tracking
- Revenue, margin and payer mix
- Wait-time and service KPIs
Practical uses: keep dispensing accuracy above 99.9% by catching the days it slips; cut expiry write-offs by flagging slow movers before their shelf life runs out; show finance the margin impact of a payer mix shift. Dispensing errors carry direct patient-safety and liability costs, so a template that keeps the number visible earns its keep quickly.
Price: $12.99. Get the Pharmacy KPI Dashboard in Excel →
Best for: hospital and retail pharmacy operations in Excel.
7. Pharmacy KPI Dashboard in Power BI — best for pharmacy chains
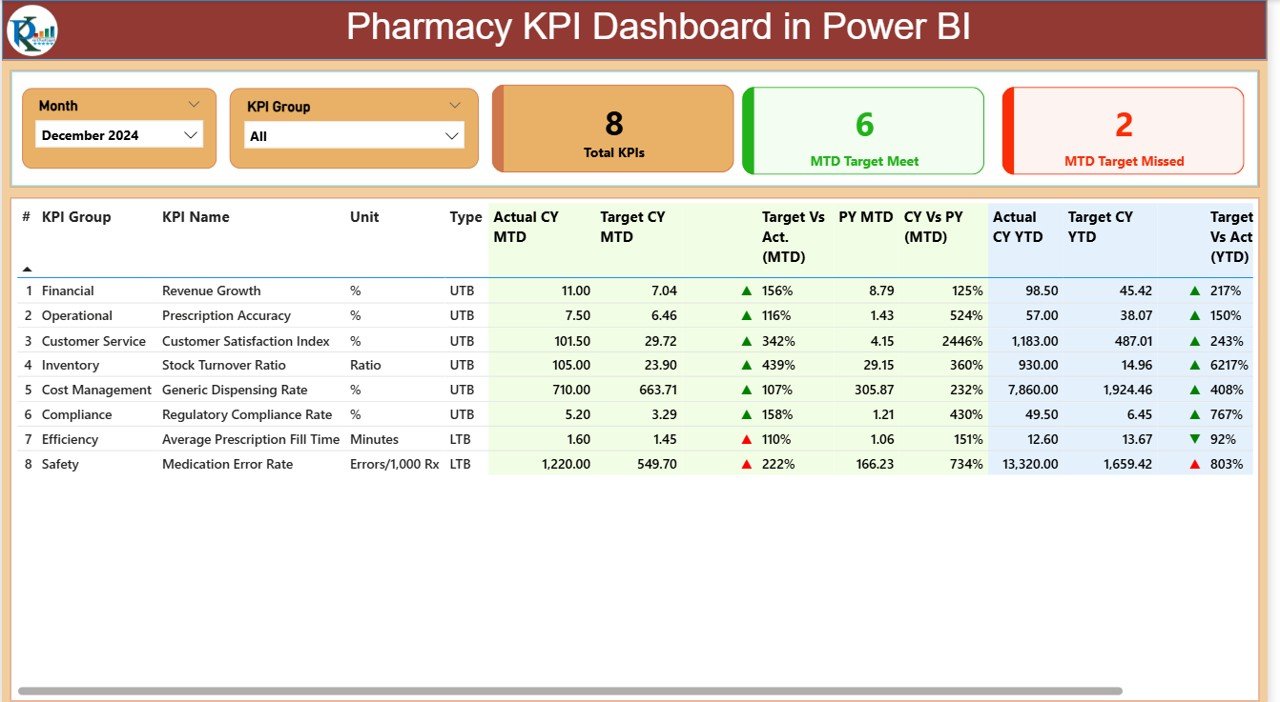
Run more than one pharmacy and you need to compare branches, not just track one. This Power BI version turns the pharmacy KPI set into an interactive model so a regional manager can filter across branches and drill into any outlet.
Who it is for: multi-branch pharmacy chains and regional operations managers.
What is inside:
- Branch-vs-branch KPI comparison
- Slicers by outlet, region and period
- Drill-through to a single pharmacy’s detail
- Scheduled refresh from your source data
Practical uses: rank branches on dispensing accuracy and revenue per script to target coaching; find the two outlets driving most of the expiry write-offs; give head office a live regional view instead of a monthly slide pack. For a chain, the ability to see every branch on one refreshable page is what separates this from the single-site Excel tracker.
Price: $11.99. Get the Pharmacy KPI Dashboard in Power BI →
Best for: multi-branch pharmacy chain analytics in Power BI.
8. Pharmacy KPI Dashboard in Google Sheets — best budget tracker

The most affordable way onto this list, this $9.99 Google Sheets tracker suits an independent pharmacy or a single outlet that wants proper KPIs without Excel or Power BI. It is cloud-based, shareable and quick to fill.
Who it is for: independent pharmacies and single outlets on a tight budget.
What is inside:
- Prescription volume and accuracy tracking
- Inventory and expiry monitoring
- Revenue and margin summary
- Auto-updating charts from live entry
Practical uses: let a small team update numbers from any device; keep an owner-manager across accuracy and stock without buying software; share a live link with an accountant at month end. It carries the same KPI logic as the Excel pharmacy dashboard, so you can start here and move up later without relearning the metrics.
Price: $9.99. Get the Pharmacy KPI Dashboard in Google Sheets →
Best for: a single pharmacy on the tightest budget.
Not sure which to start with? Most pharma manufacturing teams get the fastest return from the Pharmaceutical KPI Dashboard in Excel ($14.99) for the plant, or the Google Sheets version ($9.99) if several people edit together.
How to choose between them
Match the format to your team, then the scope to your operation:
| If you… | Choose | Price |
|---|---|---|
| Run one pharma manufacturing site in Excel | Pharmaceutical KPI Dashboard (Excel) | $14.99 |
| Manage clinical trials or R&D | Clinical Trials Management KPI Dashboard | $14.99 |
| Compare multiple products or lines | Pharmaceuticals KPI Dashboard (Excel) | $12.99 |
| Already report in Power BI | Pharmaceuticals KPI Dashboard (Power BI) | $11.99 |
| Need several people editing live | Pharmaceutical KPI Dashboard (Google Sheets) | $9.99 |
| Run a pharmacy or dispensing operation | Pharmacy KPI Dashboard (Excel) | $12.99 |
| Run a multi-branch pharmacy chain | Pharmacy KPI Dashboard (Power BI) | $11.99 |
| Run one pharmacy on a tight budget | Pharmacy KPI Dashboard (Google Sheets) | $9.99 |
A useful rule: pick a pharmaceutical dashboard Excel build when validation teams must audit every formula, Power BI when you need interactive filtering and scheduled refresh, and Google Sheets when live collaboration matters more than either. For the metric definitions behind these dashboards, see our guide to the 12 manufacturing KPIs to track, and if you are weighing a build-vs-buy decision, read our buying guide for Excel dashboards.
When a template is NOT the right answer
A spreadsheet dashboard is a reporting layer, not a system of record. If you need electronic batch records, 21 CFR Part 11 e-signatures, automated audit trails and full data-integrity controls for a regulatory submission, buy a validated MES or QMS — Veeva Vault, MasterControl or Sparta TrackWise — and accept the $20,000–$200,000 annual cost. A template cannot enforce ALCOA+ data integrity the way FDA cGMP regulations expect of a primary record.
These templates are the right answer when you want visibility now: a management scorecard that sits above your validated systems, summarising what they already capture. They are also ideal for sites still tracking KPIs in scattered files, contract manufacturers reporting to clients, and pharmacies that will never justify enterprise software. If real-time machine data or thousands of daily transactions are involved, a spreadsheet will strain; move to Power BI or a database-backed tool. Be honest about which job you are hiring the file to do.
A quick test: if the output is a slide in a management review, a template is perfect. If the output is a record an auditor will trace back to a raw signal with an e-signature, it is not. Many sites run both — the validated system holds the record, and one of these dashboards turns it into the numbers leadership actually looks at each week. For contract work, a shared scorecard also doubles as a client deliverable, much like the reporting layer in our clinic contract management dashboard.
Frequently asked questions
What is a pharmaceutical dashboard Excel template?
A pharmaceutical dashboard Excel template is a spreadsheet that consolidates production, quality and compliance KPIs — such as OEE, yield, right-first-time and deviations — onto one visual scorecard. It reads from your data tables and updates charts automatically, giving plant and QA managers a single view without specialist software.
How much does a pharma manufacturing dashboard template cost?
The templates in this roundup cost between $9.99 and $14.99 as a one-time purchase with lifetime access. That compares with enterprise pharma QMS and MES platforms, which typically run $20,000 to $200,000 per year, plus implementation and validation fees on top of the subscription.
Which pharmaceutical KPIs should a manufacturing dashboard track?
Core metrics are OEE (availability x performance x quality), batch right-first-time, yield per batch, deviation and CAPA counts, out-of-specification rate, and inventory turns. Pharmacy operations add dispensing accuracy, prescription volume and expiry tracking. Start with OEE and right-first-time, since they expose most hidden losses first.
What is a good OEE benchmark for pharmaceutical manufacturing?
World-class OEE is around 85%, but pharmaceutical lines commonly sit at 30–45% because cleaning validation, changeovers and in-process checks eat availability. The goal is not to hit 85% overnight but to measure your baseline and improve it; a dashboard that shows the trend is the first step.
Excel, Google Sheets or Power BI — which format is best?
Choose Excel when validation teams must audit formulas and you work offline. Choose Power BI when you need interactive filtering, drill-through and scheduled refresh across many rows. Choose Google Sheets when several people edit the same file live from different locations. All three formats appear in this list at similar prices.
Are these templates GMP or 21 CFR Part 11 compliant?
No. They are management reporting dashboards, not validated systems of record. They summarise data your compliant systems already capture. For electronic batch records, e-signatures and audit trails required for regulatory submission, you need a validated MES or QMS. Use these templates for visibility above those systems, not to replace them.
Can I customise the KPIs and add my own data?
Yes. Every template ships with sample data wired to the charts, which you replace with your own figures. You can rename KPIs, adjust targets and add rows. Because the Excel and Google Sheets versions are open formulas, your team can extend them; the Power BI version lets you repoint the model at your source.
Do I need one dashboard or several?
Most single sites need one manufacturing dashboard plus, if relevant, a pharmacy or clinical trials dashboard for that function. Multi-product manufacturers benefit from the portfolio Excel version, and chains from the Power BI branch comparison. Buying two complementary templates — say the Excel plant scorecard and the Google Sheets collaborative copy — still costs under $25.
How is a pharmacy KPI dashboard different from a manufacturing one?
A manufacturing dashboard tracks production: OEE, yield, batch quality and deviations. A pharmacy dashboard tracks dispensing: prescription volume, dispensing accuracy, inventory, expiry and revenue. They share layout and charting logic but measure different operations, which is why this list includes dedicated versions of each.
Will these work in older versions of Excel?
The Excel templates use standard charts and formulas that work in Excel 2016 and later, including Microsoft 365. There are no macros required to view the dashboards, so they open on most corporate installations. For the smoothest experience with newer functions, Microsoft 365 or Excel 2021 is recommended.
Get more pharmaceutical manufacturing templates
Start measuring this week. Our top pharmaceutical dashboard Excel pick, the Pharmaceutical KPI Dashboard in Excel ($14.99), is the fastest route to a full plant scorecard, while the Google Sheets version ($9.99) is the best value for teams that edit together. Pharmacy operations should start with the Pharmacy KPI Dashboard in Excel ($12.99).
Explore more manufacturing dashboard templates, browse quality control dashboard templates and procurement dashboard templates, or read 7 reasons you need a pharmaceutical dashboard. See every template in action on our YouTube channel.