

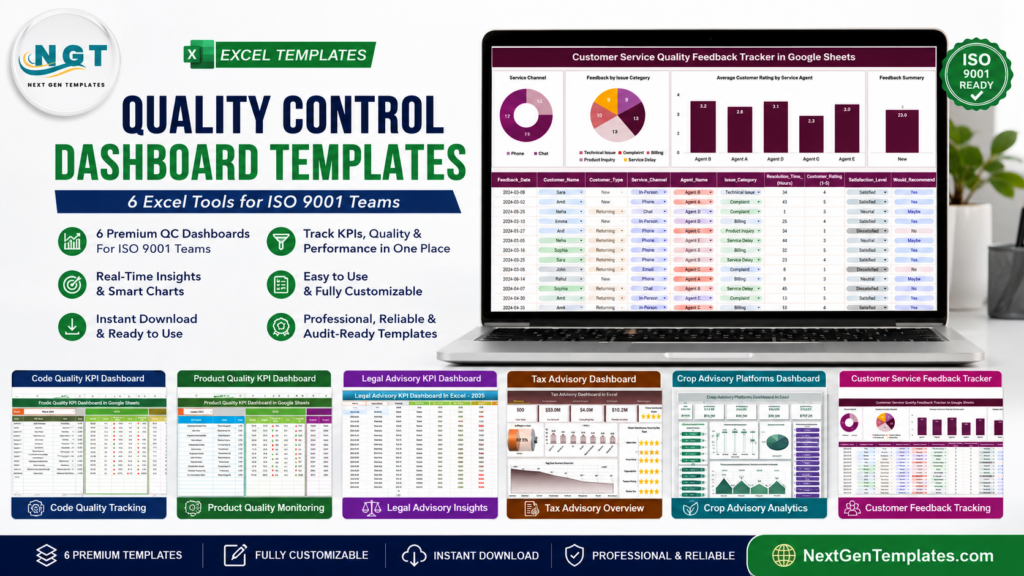
Quality control Excel templates give ISO 9001 teams a faster way to collect inspection evidence, track defects, summarize CAPA activity, and prepare audit-ready documentation without waiting for a full QMS software rollout. For a small manufacturer, consulting firm, service operation, or internal quality team in the US, the problem is rarely that the team has no data. The problem is that QC inspection logs, defect trackers, supplier notes, customer complaints, and corrective actions live in separate files until audit week turns them into a scramble.
That scramble can get expensive. A 10-user inspection app at roughly $24 per user per month can reach $240 per month before configuration, training, and migration. Even compared with a $17.99 spreadsheet template, the payback math is obvious when the team mainly needs structured evidence, review rhythm, and cleaner reporting. The templates in this roundup range from $6.99 to $14.99 and cover eight specific NextGenTemplates tools across six quality-control use cases: inspection evidence, defect review, SPC trend reporting, CAPA follow-up, advisory quality, and customer-service quality. Use this guide to choose the best QC dashboard, defect tracker, or ISO 9001 template for your workflow.
Why ISO 9001 Teams Need a QC Dashboard
ISO 9001 is a massive operating language. The ISO Survey has tracked valid management-system certificates since 1993, and ISO’s 2022 explanatory note reported 1,265,216 ISO 9001:2015 certificates across 1,666,172 sites. That scale is why buyers, auditors, and suppliers expect clear evidence instead of informal status updates.
The US market still has real certification pressure. SimpleQuE’s review of the 2024 ISO Survey lists the United States among the top ISO 9001 countries with 28,783 certificates. If your team sells into manufacturing, technology, healthcare, government, food, or regulated service markets, your quality records may be part of the sales conversation before they are part of an audit.
Poor quality is not a soft cost. Quality Digest summarizes expert estimates that cost of poor quality can reach 5% to 30% of gross sales for manufacturing and service companies. A spreadsheet will not fix root causes by itself, but a disciplined QC inspection log, defect tracker, CAPA tracker, and trend dashboard makes loss visible earlier.
Software pricing can outrun the first problem. SafetyCulture’s public pricing materials list Premium at about $24 per user per month on annual billing. Smartsheet Business has also commonly been positioned around $19 per member per month. Those tools may be right for mature teams, but a quality control Excel or Google Sheets template is often the practical first step when you need audit evidence this week.
Documentation is the difference between doing the work and proving the work. ISO 9001 asks teams to plan, monitor, evaluate, and retain suitable evidence for quality processes. A simple dashboard stack helps connect daily inspection activity to management review, corrective action, customer impact, and continual improvement.
 Launch offer
From your first Pivot Table to the Data Model, DAX, Power Query and a one-page KPI dashboard. 11h 51m of video by PK, with practice files, quizzes and a capstone.
Compare These Quality Control Templates
| Template | Format | Best For | Price |
|---|---|---|---|
| Code Quality KPI Dashboard in Google Sheets | Google Sheets | Software QA, code review quality, release-readiness reporting | $9.99 |
| Product Quality KPI Dashboard in Google Sheets | Google Sheets | Product defects, inspection trends, customer-facing quality metrics | $9.99 |
| Legal Advisory KPI Dashboard in Excel | Excel | Advisory service quality, review cycle control, matter performance | $14.99 |
| Tax Advisory Dashboard in Excel | Excel | Tax advisory workload, filing quality, compliance service reporting | $13.99 |
| Crop Advisory Platforms Dashboard in Excel | Excel | Agriculture advisory quality, field issue tracking, service outcomes | $13.99 |
| Customer Service Quality Feedback Tracker in Google Sheets | Google Sheets | Service quality feedback, complaint patterns, follow-up documentation | $6.99 |
| Tax Advisory KPI Dashboard in Excel | Excel | Tax KPI scorecards, advisory quality metrics, management review | $14.99 |
| Customer Experience & Service Quality Dashboard in Google Sheets | Google Sheets | Customer experience trends, service quality KPIs, operational reviews | $9.99 |
Need more spreadsheet options around quality and operations? Browse the Google Sheets KPI dashboard templates, the Excel KPI dashboard templates, and the broader Google Sheets template library on NextGenTemplates.
The Templates: Inspection Logs, Defects, SPC, CAPA, and Quality Evidence
1. Code Quality KPI Dashboard in Google Sheets
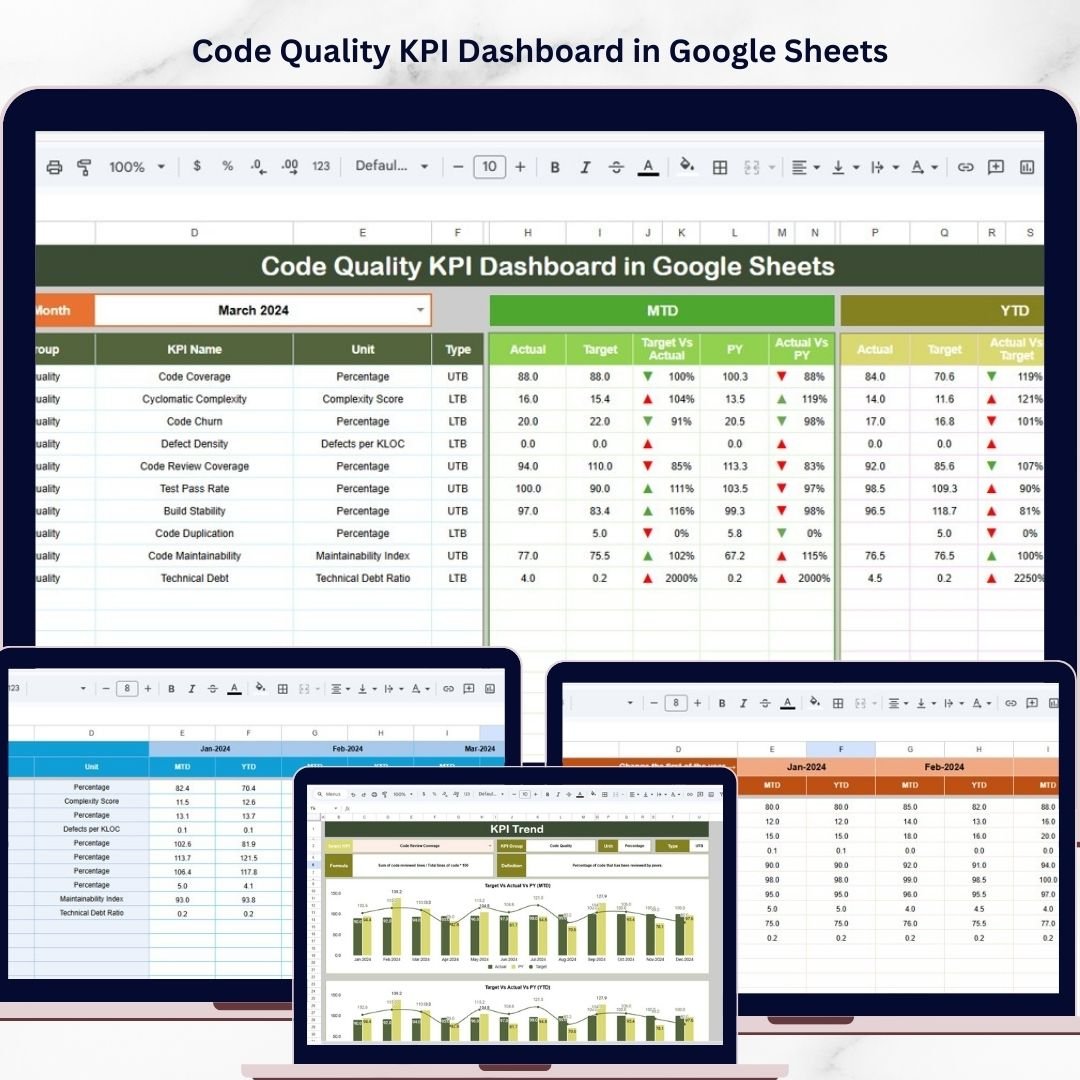
Screenshot preview: The product preview shows a Google Sheets dashboard built around code quality performance, giving software and technology teams a structured place to review quality KPIs rather than leaving release-readiness notes scattered across tickets, chat threads, and sprint documents.
The Code Quality KPI Dashboard in Google Sheets is the best fit when quality control means the quality of digital products, internal tools, or software deliverables. ISO 9001 teams that manage software as part of product realization can use it as a lightweight evidence layer for review discipline, defect visibility, and improvement discussions. At $9.99, it is especially useful for engineering managers, QA analysts, product owners, and service teams that need shared visibility without adding another paid QA platform.
- Track code quality KPIs before release gates and customer handoff.
- Document trends for defects, review performance, testing activity, or remediation backlog.
- Support management review conversations with one dashboard instead of exported ticket lists.
- Pair the dashboard with a separate defect tracker or CAPA log for root-cause follow-up.
If your ISO 9001 scope includes software-enabled products or internal development, this template helps turn technical quality into reportable evidence. The strongest use case is recurring review: update the source rows weekly, discuss the trend lines, assign owners, and keep a record of quality decisions.
View the Code Quality KPI Dashboard in Google Sheets
2. Product Quality KPI Dashboard in Google Sheets
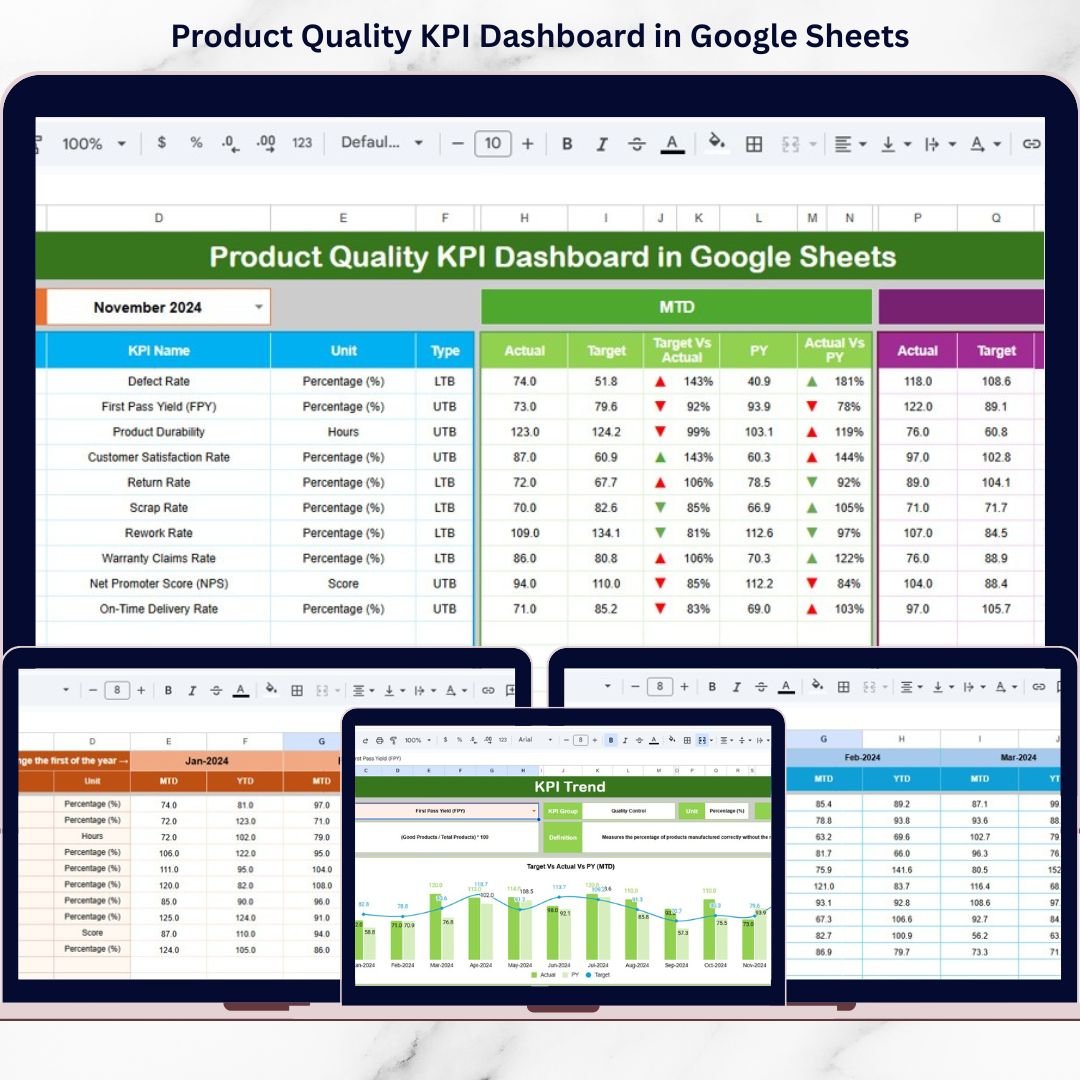
Screenshot preview: The preview positions this template as a product quality reporting dashboard in Google Sheets, useful for monitoring quality outcomes, reviewing KPI changes, and preparing a compact management view of product performance.
The Product Quality KPI Dashboard in Google Sheets is the closest match for teams searching for a practical QC dashboard. It works well as the summary layer above inspection records, defect logs, customer returns, warranty notes, supplier nonconformances, and corrective actions. For $9.99, it gives product quality teams a shared reporting file that can be updated by multiple users and reviewed during weekly quality meetings.
- Summarize defect counts, inspection results, and quality performance by product line.
- Support ISO 9001 management review with charts, KPI cards, and trend evidence.
- Monitor recurring issues before they become customer complaints or audit findings.
- Use alongside SPC charts when process-control data needs a management dashboard.
This template is strongest when the team already has source data but lacks a clean reporting rhythm. It is not a full statistical process control system by itself. If you need control limits, run charts, or process capability calculations, keep those calculations in a dedicated SPC tab and use this dashboard to summarize the health of the process, open defects, and improvement actions.
View the Product Quality KPI Dashboard in Google Sheets
3. Legal Advisory KPI Dashboard in Excel
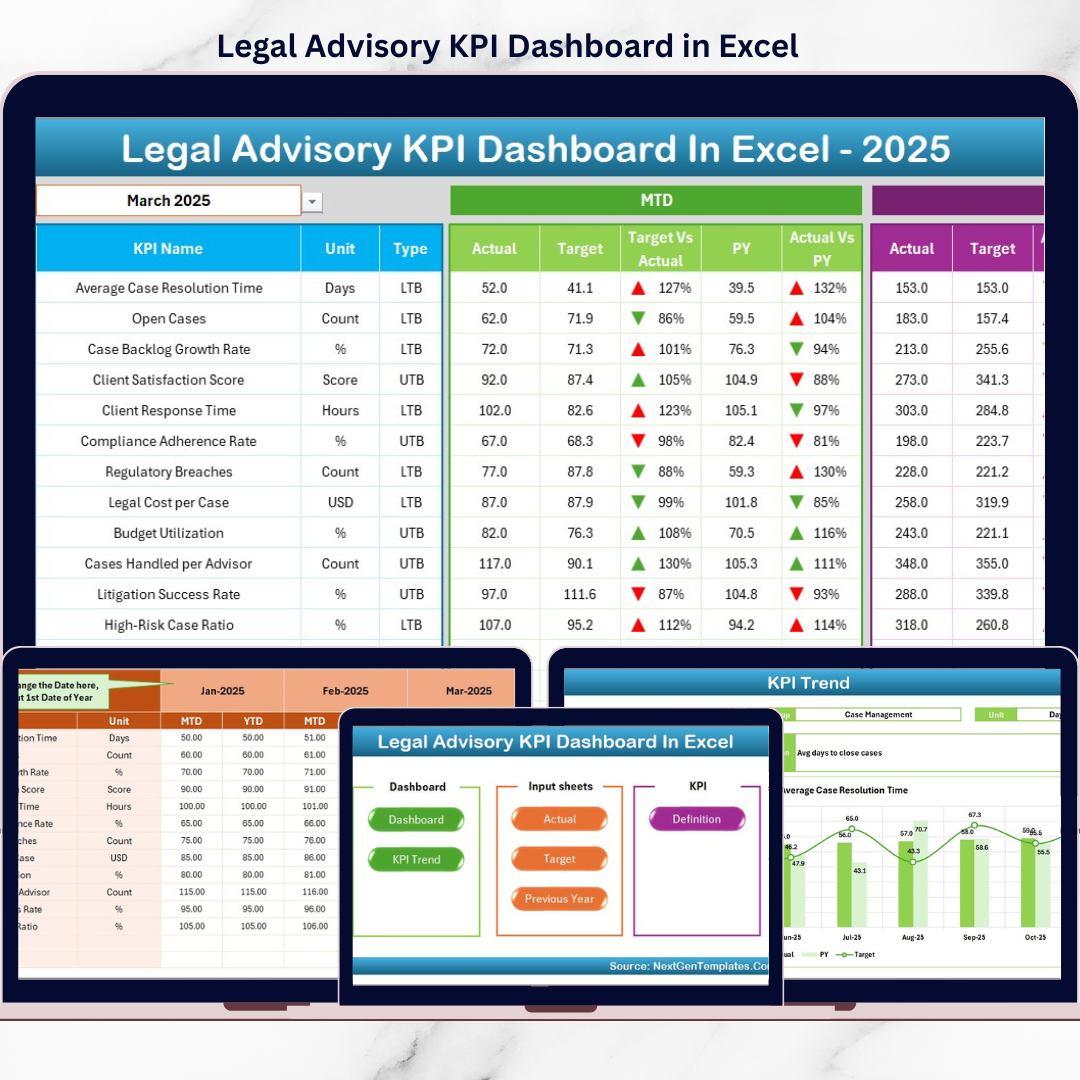
Screenshot preview: The product image presents an Excel KPI dashboard for legal advisory performance, making it a useful quality-management layer for service delivery, matter review, turnaround tracking, and documentation of advisory outcomes.
The Legal Advisory KPI Dashboard in Excel is not a factory inspection log, and that is exactly why it belongs in a broader quality-control roundup. ISO 9001 applies to services as well as products. If your quality system covers advisory work, compliance review, documentation accuracy, or client deliverables, you need service-quality evidence that goes beyond completed-or-not-completed status. At $14.99, this Excel dashboard can support a disciplined review cycle for legal operations, compliance teams, internal counsel, or professional service groups.
- Track advisory workload, delivery status, and service-quality KPIs for management review.
- Document review-cycle performance before client delivery or internal approval.
- Identify recurring delays, rework themes, or process bottlenecks.
- Support audit-ready documentation where legal or compliance advice is part of the QMS.
Use this template when your defect is not a scratched component, but a delayed review, missed requirement, incomplete file, or avoidable rework loop. The Excel format is familiar, easy to store with controlled documents, and practical for teams that want offline ownership of quality evidence.
View the Legal Advisory KPI Dashboard in Excel
4. Tax Advisory Dashboard in Excel
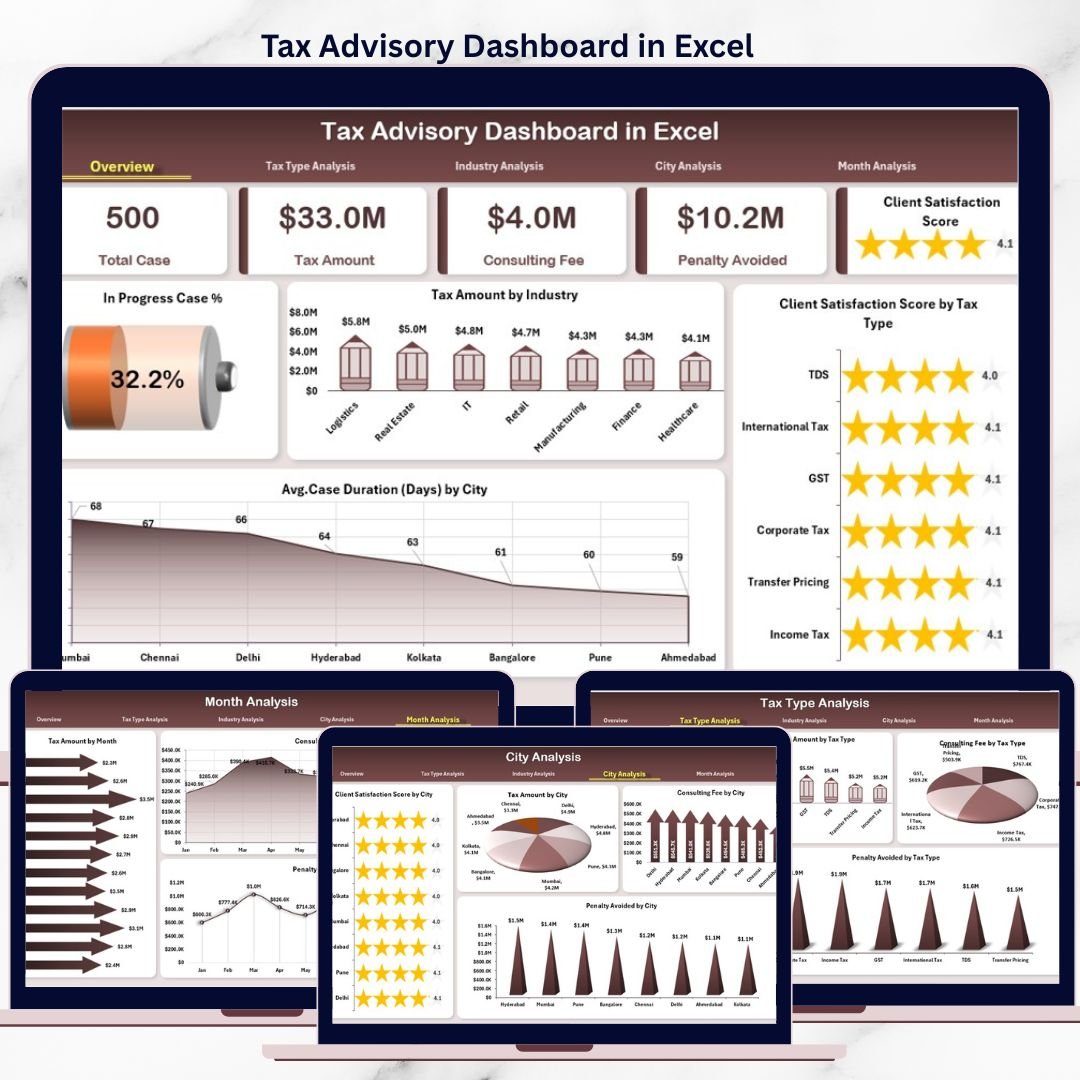
Screenshot preview: The preview shows an Excel dashboard for tax advisory operations, giving teams a place to track advisory work, performance signals, and service delivery status in one workbook.
The Tax Advisory Dashboard in Excel is a practical service-quality template for accounting firms, tax departments, outsourced advisory teams, and compliance-heavy operations. In ISO 9001 language, it helps document process performance: what work is open, what is complete, where delays are forming, and where advisory quality needs attention. The $13.99 price makes it easier to standardize review without committing to a full practice-management platform.
- Monitor tax advisory workload, deadlines, and quality-related follow-up.
- Document recurring filing issues, client-response delays, or review bottlenecks.
- Create a management-review snapshot for advisory service quality.
- Use the workbook as a companion to a CAPA tracker when repeated issues need root-cause action.
This template is best when your quality risk is missed work, late work, or undocumented review. It can also help compare planned vs completed advisory activity during busy seasons. If you already use a tax workflow platform, this can still serve as a simple executive dashboard or audit pack summary.
View the Tax Advisory Dashboard in Excel
5. Crop Advisory Platforms Dashboard in Excel
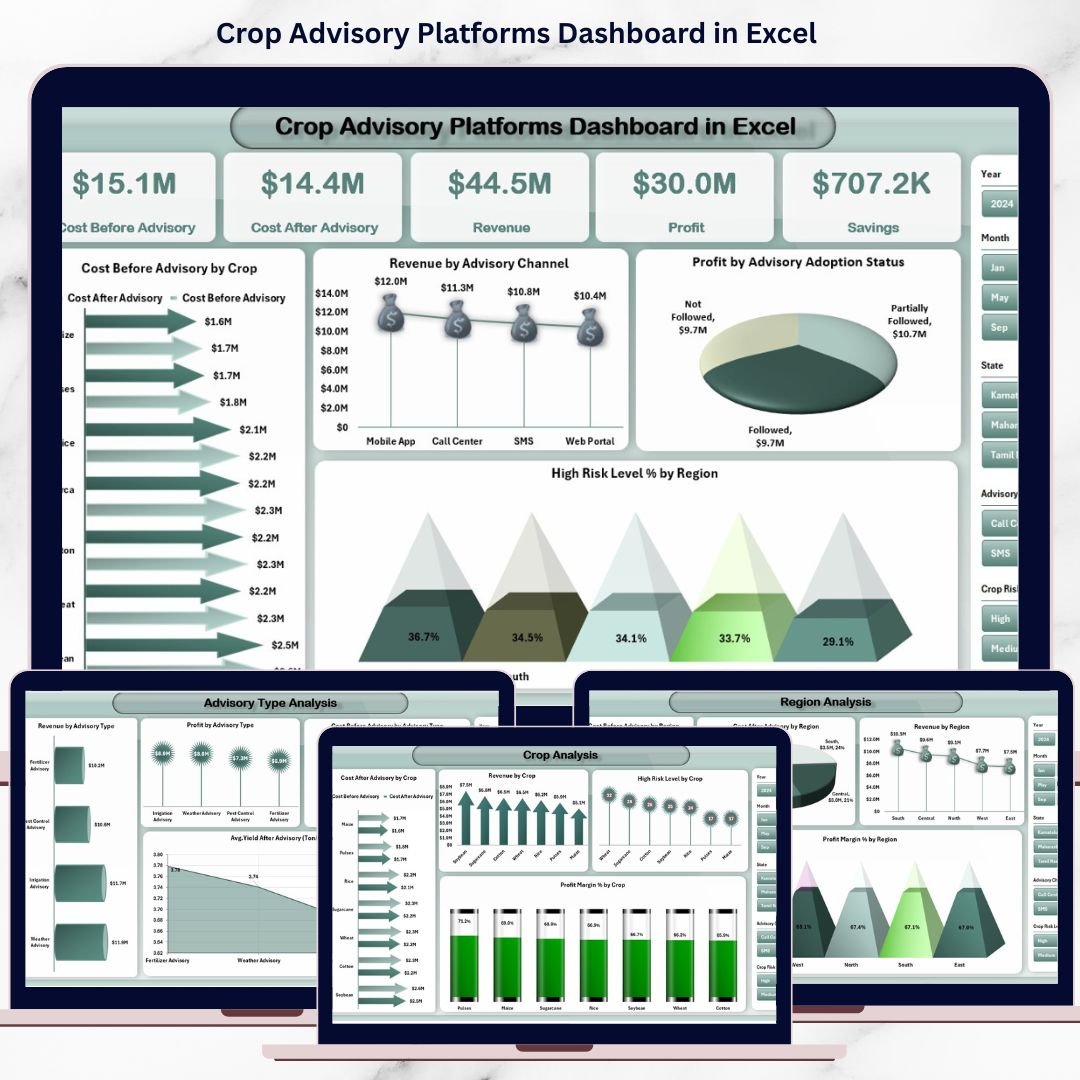
Screenshot preview: The product image shows an Excel dashboard for crop advisory platform performance, a useful fit for teams that need to document field-service quality, advisory activity, and outcome trends.
The Crop Advisory Platforms Dashboard in Excel extends quality control into agriculture, field support, agritech, and advisory operations. For ISO 9001 teams, this matters because quality evidence often comes from field observations, service recommendations, customer outcomes, and follow-up action. At $13.99, the workbook gives crop advisory teams a structured reporting layer without building an Excel dashboard from scratch.
- Track advisory coverage, field issue categories, and follow-up status.
- Monitor consistency of recommendations across regions, advisors, or crop programs.
- Document service outcomes for customer reviews, supplier audits, or management meetings.
- Use dashboard trends to trigger corrective actions when recurring issues appear.
This is not a lab QC worksheet or a statistical process-control calculator. It is better viewed as a service-quality dashboard for field advisory processes. If your business uses crop condition records, inspection notes, or farmer feedback as part of quality documentation, this template gives leadership a clearer way to see whether the advisory system is working.
View the Crop Advisory Platforms Dashboard in Excel
6. Customer Service Quality Feedback Tracker in Google Sheets
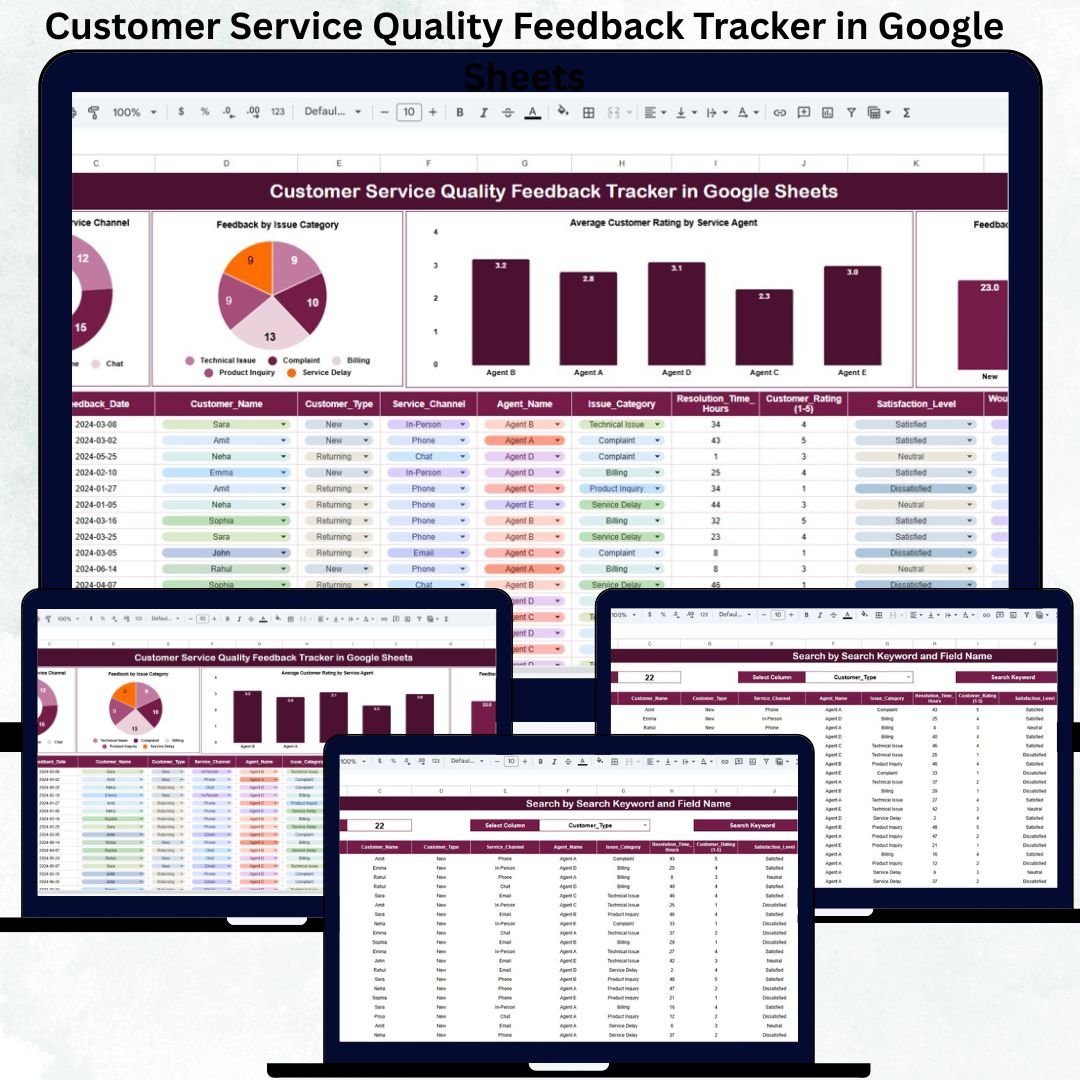
Screenshot preview: The preview highlights a Google Sheets tracker for collecting and reviewing service-quality feedback, making it useful for complaint handling, customer experience evidence, and quality follow-up.
The Customer Service Quality Feedback Tracker in Google Sheets is the most direct choice for teams that need a customer-facing defect tracker. In service operations, defects often show up as complaints, missed expectations, repeat contacts, low satisfaction, unresolved tickets, or inconsistent handoffs. For $6.99, this tracker gives teams a low-cost way to record feedback, categorize issues, and keep follow-up visible.
- Log customer complaints, service-quality comments, and recurring feedback themes.
- Track follow-up status so complaints do not disappear after the first response.
- Support ISO 9001 customer satisfaction monitoring and evidence retention.
- Feed a CAPA tracker when complaint patterns indicate a systemic process issue.
This template is especially useful when your team is not ready for a full help desk or customer-experience platform. It can sit beside a QC dashboard, giving quality managers a practical link between product/service performance and customer perception. For more related options, explore the Google Sheets tracker templates.
View the Customer Service Quality Feedback Tracker in Google Sheets
7. Tax Advisory KPI Dashboard in Excel

Screenshot preview: The product image presents a KPI-oriented Excel dashboard for tax advisory work, which is useful when leadership needs a clearer scorecard view than a general workload dashboard provides.
The Tax Advisory KPI Dashboard in Excel is the better pick when your quality review depends on KPI discipline rather than task status alone. Compared with a general advisory dashboard, a KPI dashboard is better suited to recurring management review, performance targets, service-level monitoring, and quality trend discussions. At $14.99, it gives tax advisory leaders a focused Excel scorecard for decision-making.
- Track KPI movement across tax advisory quality, delivery, productivity, or review metrics.
- Prepare monthly management-review evidence for leadership or audit files.
- Compare service areas, advisor performance, or process outcomes over time.
- Connect KPI misses to corrective-action owners and follow-up dates.
Use this template when you need to ask whether the team is improving, rather than simply what is open. It pairs well with a defect tracker, complaint log, or CAPA register because it can summarize whether recurring issues are shrinking, aging, or moving in the wrong direction.
View the Tax Advisory KPI Dashboard in Excel
8. Customer Experience & Service Quality Dashboard in Google Sheets
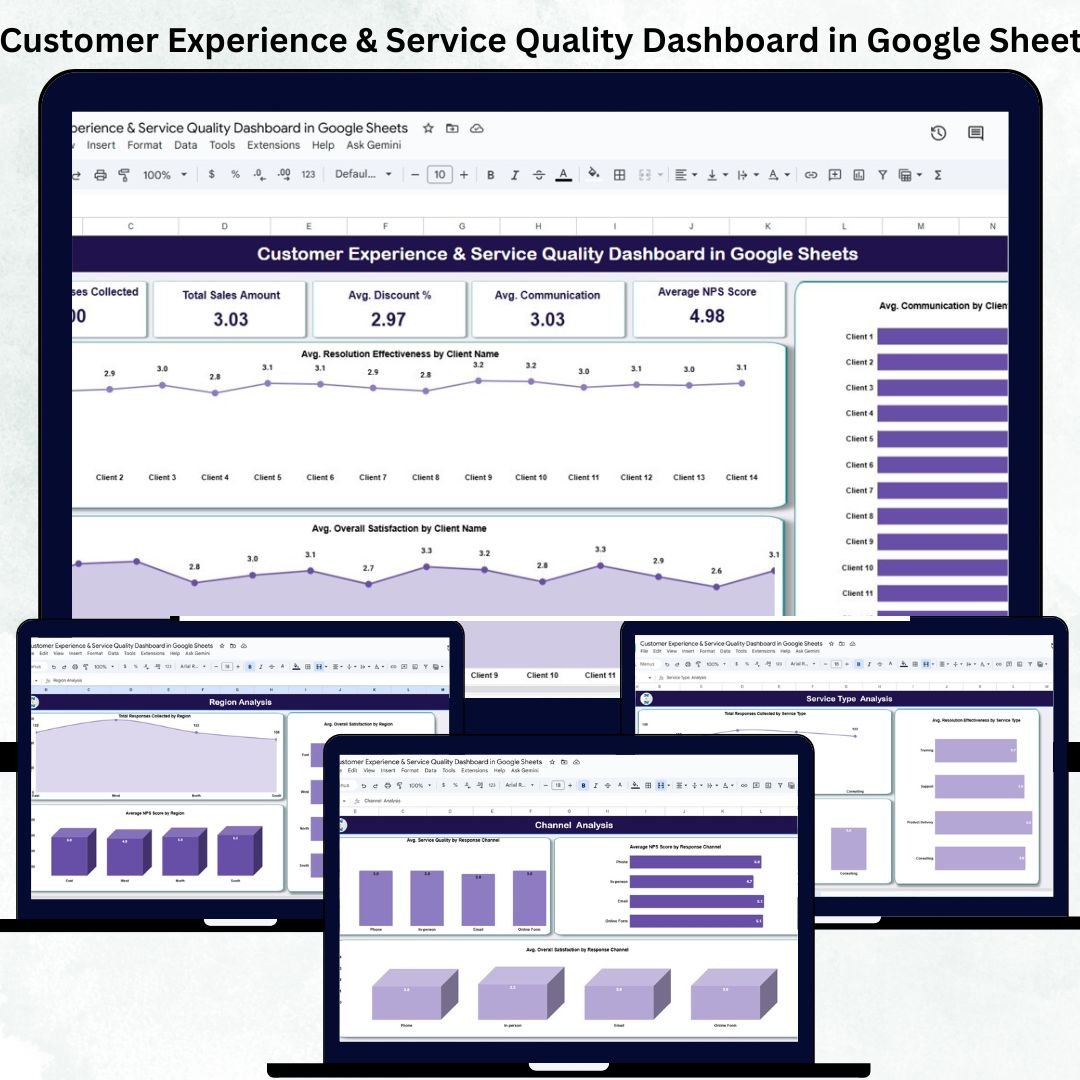
Screenshot preview: The preview shows a Google Sheets dashboard for customer experience and service quality, helping teams turn feedback and service performance into a management-level quality view.
The Customer Experience & Service Quality Dashboard in Google Sheets is the best fit when customer perception is a core quality metric. ISO 9001 teams often need to monitor customer satisfaction, complaints, returns, response quality, and service consistency. A Google Sheets dashboard gives service leaders a collaborative way to review those signals without waiting for a separate BI project. The $9.99 price makes it an easy add-on to a broader quality control Excel stack.
- Summarize customer experience and service-quality KPIs for leadership review.
- Identify recurring customer pain points that deserve CAPA or process improvement.
- Compare customer-facing quality trends before and after improvement actions.
- Give support, operations, and quality teams a shared scorecard.
Use this template when your quality system needs to prove that the voice of the customer is being monitored and acted on. It is a strong companion to the feedback tracker: one file captures issue-level feedback, while this dashboard shows trend-level performance.
View the Customer Experience & Service Quality Dashboard in Google Sheets
How to Choose the Right QC Template
Choose the Product Quality KPI Dashboard if you need the central QC dashboard. This is the best starting point for product defects, inspection outcomes, recurring quality trends, and management review. If your team searches for quality control Excel but works collaboratively in the cloud, the Google Sheets format may be the better day-to-day choice.
Choose a feedback or service-quality template if complaints are your biggest signal. The Customer Service Quality Feedback Tracker is better for issue-level records, while the Customer Experience & Service Quality Dashboard is better for summary reporting. Many ISO 9001 teams need both: the tracker stores the evidence, and the dashboard shows whether service quality is improving.
Choose advisory dashboards when professional service delivery is inside your quality scope. Legal, tax, and crop advisory dashboards are not shop-floor inspection logs. They are quality evidence tools for teams where the delivered product is advice, compliance work, review, or field guidance. In those businesses, cycle time, review status, rework, customer feedback, and missed commitments are legitimate quality indicators.
Choose Excel when ownership and controlled files matter most. Excel is easier to place inside a controlled-document process, attach to an audit folder, or maintain as a local management-review workbook. Choose Google Sheets when multiple users need to update the same file frequently.
Add SPC and CAPA intentionally. None of these templates should be treated as a full SPC package or complete CAPA system by themselves. If you need control charts, process capability, root-cause investigation, effectiveness checks, or formal corrective-action approval, create those tabs or documents beside the dashboard. The dashboard’s job is to show the status, trend, and accountability clearly.
Quality teams in energy and process plants can pair these with an oil and gas dashboard that tracks production, downtime and incidents by field and region.
Water and utility labs that sample against drinking-water standards can pair these QC tools with a utilities dashboard template that tracks turbidity, chlorine residual, contamination cases and risk rating by source and treatment plant.
Quality Control Excel FAQ
What is a quality control Excel template?
A quality control Excel template is a structured spreadsheet used to record QC activity, summarize inspection results, monitor defects, track corrective actions, and prepare evidence for management review or audits. It is usually simpler than QMS software and easier to customize for a specific team.
Can an Excel QC dashboard support ISO 9001 audits?
Yes, an Excel QC dashboard can support ISO 9001 audits when it is controlled, updated consistently, and backed by source records. It should show what was inspected, what failed, who owns follow-up, what corrective action was taken, and whether performance is improving over time.
What should an ISO 9001 template include?
An ISO 9001 template should include clear fields for process owner, date, requirement, inspection result, defect or nonconformance details, root cause, corrective action, due date, responsible person, status, and evidence location. Dashboards should summarize trends and open actions.
Is a QC dashboard the same as a defect tracker?
No. A defect tracker records individual issues, while a QC dashboard summarizes patterns, status, and performance. A strong quality system often uses both: the tracker stores the detailed record, and the dashboard gives managers a clear view of quality health.
Do these templates include SPC charts?
These templates are best understood as KPI and reporting dashboards. If your team needs SPC charts with control limits, keep an SPC worksheet or statistical tool alongside the dashboard, then use the dashboard to summarize process stability, defect trends, and action status.
How do CAPA trackers fit with these dashboards?
A CAPA tracker captures root cause, corrective action, preventive action, owner, due date, verification, and effectiveness review. A dashboard should pull from or sit beside that tracker so leadership can see aging actions, repeat issues, and overdue follow-up.
Should a small team choose Excel or Google Sheets for QC?
Choose Excel if you need controlled files, offline access, or formal workbook ownership. Choose Google Sheets if collaboration matters more, especially when multiple users update inspection logs, feedback records, or service-quality notes during the week.
How often should a QC dashboard be updated?
Update the source log whenever an inspection, defect, complaint, or corrective action occurs. Review the dashboard weekly for active operations and monthly for management review. High-risk processes may need daily review during launch, ramp-up, or customer escalation periods.
Can service teams use quality control templates?
Yes. Service teams can use quality control templates to track complaints, missed commitments, rework, review accuracy, response quality, and customer satisfaction. ISO 9001 quality management applies to service delivery as well as physical products.
What is the cheapest template in this roundup?
The Customer Service Quality Feedback Tracker in Google Sheets is the lowest-priced template in this roundup at $6.99. It is a practical first step when the team mainly needs to capture feedback, complaints, and service-quality follow-up.
Build an Audit-Ready QC Stack
The smartest approach is not to force one spreadsheet to do everything. Build a small stack that matches how quality evidence actually flows. Start with an inspection log or feedback tracker for raw events. Add a defect tracker for issue-level accountability. Use a CAPA tracker for root-cause and corrective action. Then use a QC dashboard to summarize the evidence for leadership, customers, and auditors.
If you want the fastest starting point, begin with the Product Quality KPI Dashboard in Google Sheets. Add the Customer Service Quality Feedback Tracker in Google Sheets if complaints or feedback drive your quality system. If your quality scope includes advisory work, use the legal, tax, or crop advisory dashboards to document service delivery quality with the same discipline you would apply to production quality.
About the Author
Built by PK – Microsoft Certified Professional with 15+ years of Excel, Google Sheets, and Power BI experience. Founder of NextGenTemplates, reaching 300K+ subscribers across YouTube channels. Every template is hand-built and tested before release.
Last updated: June 30, 2026.
New to buying dashboards? Read our buyer guide on how to choose an Excel dashboard template – a five-point checklist, real prices, and the bundle-vs-single maths before you pay.
On a tight budget? Compare our cheap Excel dashboard templates under $15 – 12 ready-made KPI dashboards from $11.99 with a full pricing table and bundle-vs-single maths.
Tracking the numbers behind quality control? See our explainer on the 12 quality KPIs to track in 2026 — DPMO, First Pass Yield and Cost of Quality with exact formulas and benchmark ranges.