Short answer: a procurement dashboard gives sourcing teams one place to track spend, suppliers, purchase orders, lead times, savings, and procurement KPI performance before small issues become budget problems. U.S. sourcing teams are under pressure to control costs, document approvals, and explain supplier decisions faster, but a full procurement SaaS rollout is not always the first step. For comparison, the public Precoro pricing page lists Core at $499/month billed annually and Automation at $999/month billed annually. If your immediate need is a procurement dashboard, procurement KPI view, or purchase order tracker, a $17.99 Excel or Power BI template can be a practical reporting layer while the wider process matures.
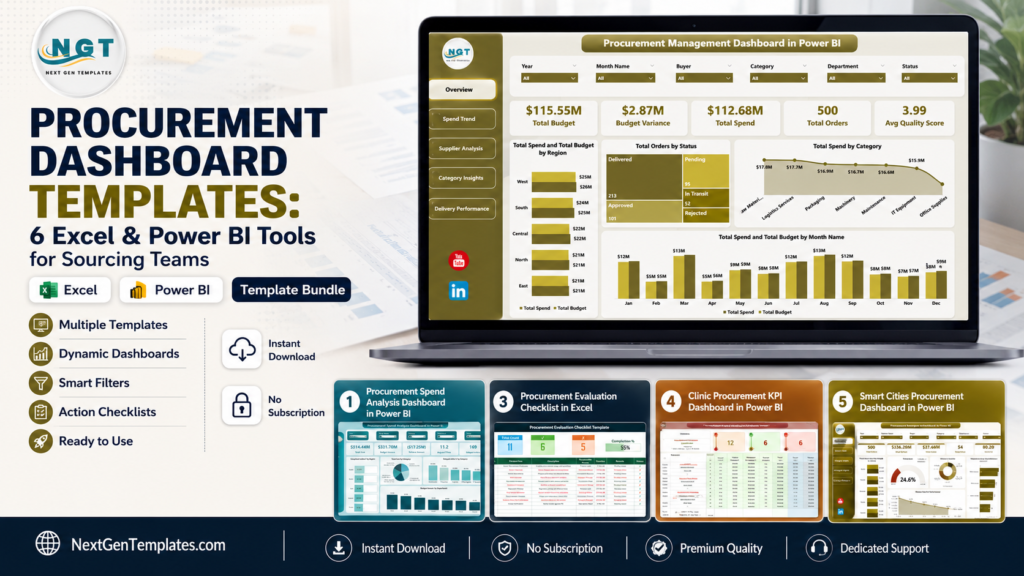
This roundup compares the exact NextGenTemplates assets specified for end-to-end procurement: six dashboard and KPI dashboard templates plus two low-cost checklist companions. Together, they cover supplier scorecards, PO tracker views, spend analytics, savings tracking, procurement execution, vendor evaluation, and industry-specific KPI monitoring.
Why Procurement Dashboards Matter Now
Procurement teams are being asked to do more than place orders. They need to defend supplier choices, monitor budget variance, prove compliance, and surface savings opportunities. A structured procurement dashboard helps translate raw purchasing records into decision-ready evidence.
- Software costs add up quickly: public procurement SaaS pricing can start at $499/month, while the core NextGenTemplates dashboard options in this guide start at $17.99 as one-time template purchases.
- Digital procurement leaders outperform: Deloitte’s 2025 Global Chief Procurement Officer Survey reports that digital leaders were more likely to meet or exceed cost savings plans than followers.
- Supplier performance is measurable: the same Deloitte research highlights stronger supplier performance outcomes among organizations that combine procurement technology and talent capability.
- Visibility is a risk control: Deloitte also reports that CPO respondents prioritized alternative supply sources, supply chain visibility, and supplier information sharing as key mitigation strategies.
- Workload pressure is real: The Hackett Group’s 2026 Procurement Key Issues research points to an 8% workload increase while procurement teams face tighter headcount and operating budgets.
Procurement Dashboard Template Comparison
| Template | Format | Best For | Price |
|---|---|---|---|
| Procurement Management Dashboard in Power BI | Power BI | Executive procurement visibility, supplier analysis, spend and delivery performance | $17.99 |
| Procurement Management Dashboard in Excel | Excel | Spreadsheet-based procurement KPI reporting, PO status, lead time, and budget tracking | $17.99 |
| Procurement Spend Analysis Dashboard in Power BI | Power BI | Spend analytics, budget variance, regional analysis, delayed order monitoring | $17.99 |
| Procurement Action Plan Checklist in Excel | Excel | Action ownership, deadlines, execution follow-up, procurement task tracking | $1.99 |
| Procurement Evaluation Checklist in Excel | Excel | Vendor evaluation, procurement review steps, compliance and approval tracking | $1.99 |
| Refinery Procurement KPI Dashboard in Power BI | Power BI | Oil and gas refinery procurement KPI tracking, MTD/YTD targets, trend analysis | $11.99 |
| Clinic Procurement KPI Dashboard in Power BI | Power BI | Healthcare procurement KPI monitoring, clinic cost control, target performance | $11.99 |
| Smart Cities Procurement Dashboard in Power BI | Power BI | Public sector procurement compliance, planned budget, negotiated savings, requester accountability | $17.99 |
6 Dashboard Templates Plus 2 Checklist Tools
Procurement Management Dashboard in Power BI
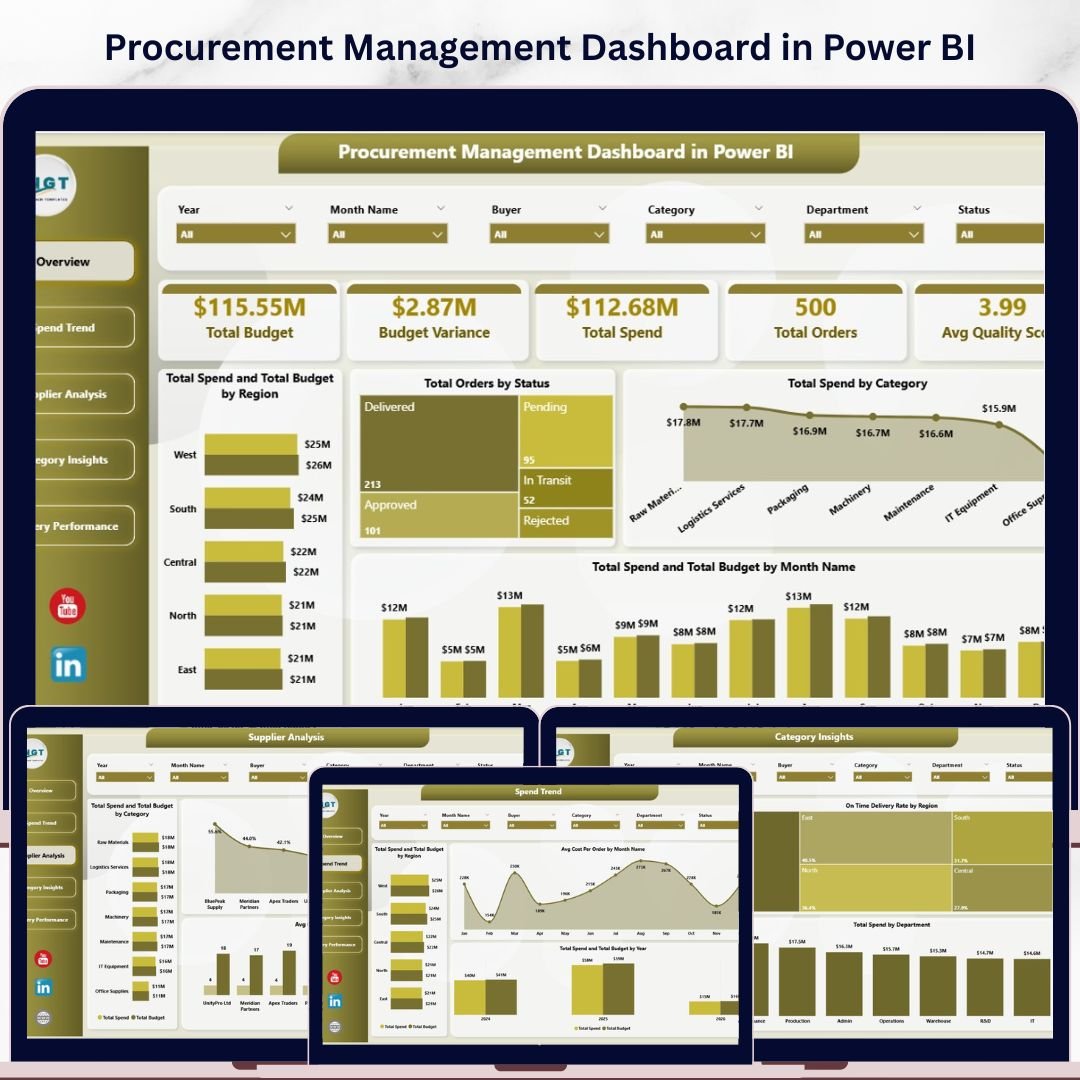
The Procurement Management Dashboard in Power BI is the strongest fit when your sourcing team wants an interactive procurement command center instead of a static spreadsheet report. It tracks Total Budget, Budget Variance, Total Spend, Total Orders, and Avg Quality Score across five dashboard pages. Because it is built in Power BI, it is well suited for managers who want slicers, cross-filtering, and presentation-ready reporting for leadership meetings.
Screenshot notes: the product screenshots show an Overview page, Spend Trend page, Supplier Analysis page, Category Insights page, and Delivery Performance page. That means the template is not limited to spend totals. It also supports supplier scorecards, delivery efficiency, regional comparisons, payment terms, department spend, and procurement category analysis.
- Use it to review supplier quality score and lead time before renewal meetings.
- Use it to compare spend against budget by region or category.
- Use it to monitor order status and delivery performance for weekly procurement reviews.
- Use it to give finance a cleaner view of budget variance and total spend.
Price: $17.99. View the Power BI procurement management dashboard.
Procurement Management Dashboard in Excel
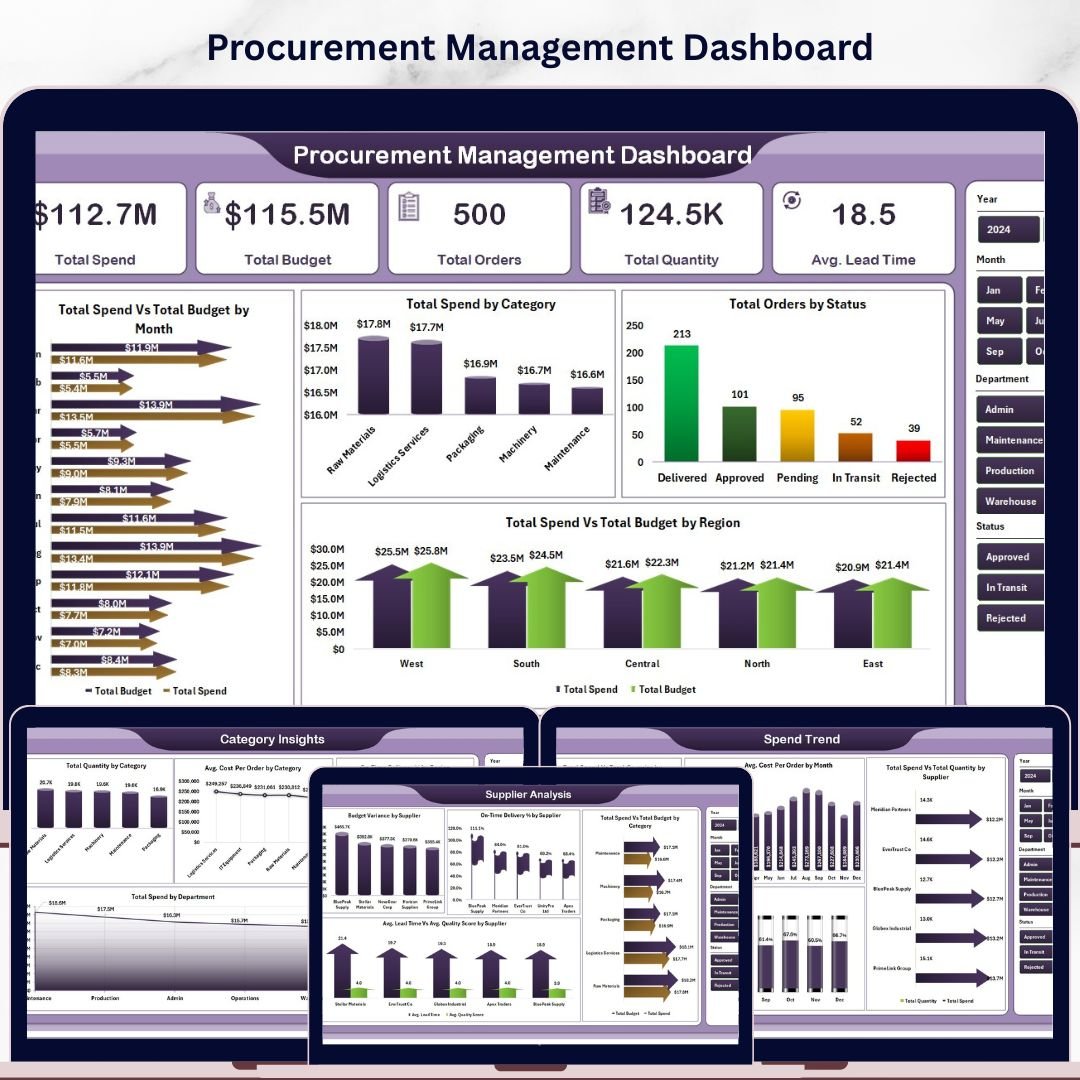
The Procurement Management Dashboard in Excel is the better choice when your team already runs purchasing data in Excel and wants a procurement dashboard without Power BI setup. It includes five dashboard pages, a data sheet, and a support sheet with pivot tables. The core KPI cards track Total Spend, Total Budget, Total Orders, Total Quantity, and Avg. Lead Time, which makes it useful for teams that want a practical purchase order tracker and procurement KPI report in one workbook.
Screenshot notes: the screenshots show the Overview, Spend Trend, Supplier Analysis, Category Insights, Delivery Performance, Data Sheet, and Support Sheet tabs. That structure matters because users can replace sample data, refresh pivots, and then review spend, supplier, category, and delivery metrics without rebuilding charts from scratch.
- Use it as a monthly procurement KPI pack for managers who prefer Excel.
- Use it to track PO status, spend by category, and lead time by buyer.
- Use it to compare supplier spend and on-time delivery percentage.
- Use it to build a repeatable procurement report without VBA or macros.
Price: $17.99. Get the Excel procurement management dashboard.
Procurement Spend Analysis Dashboard in Power BI
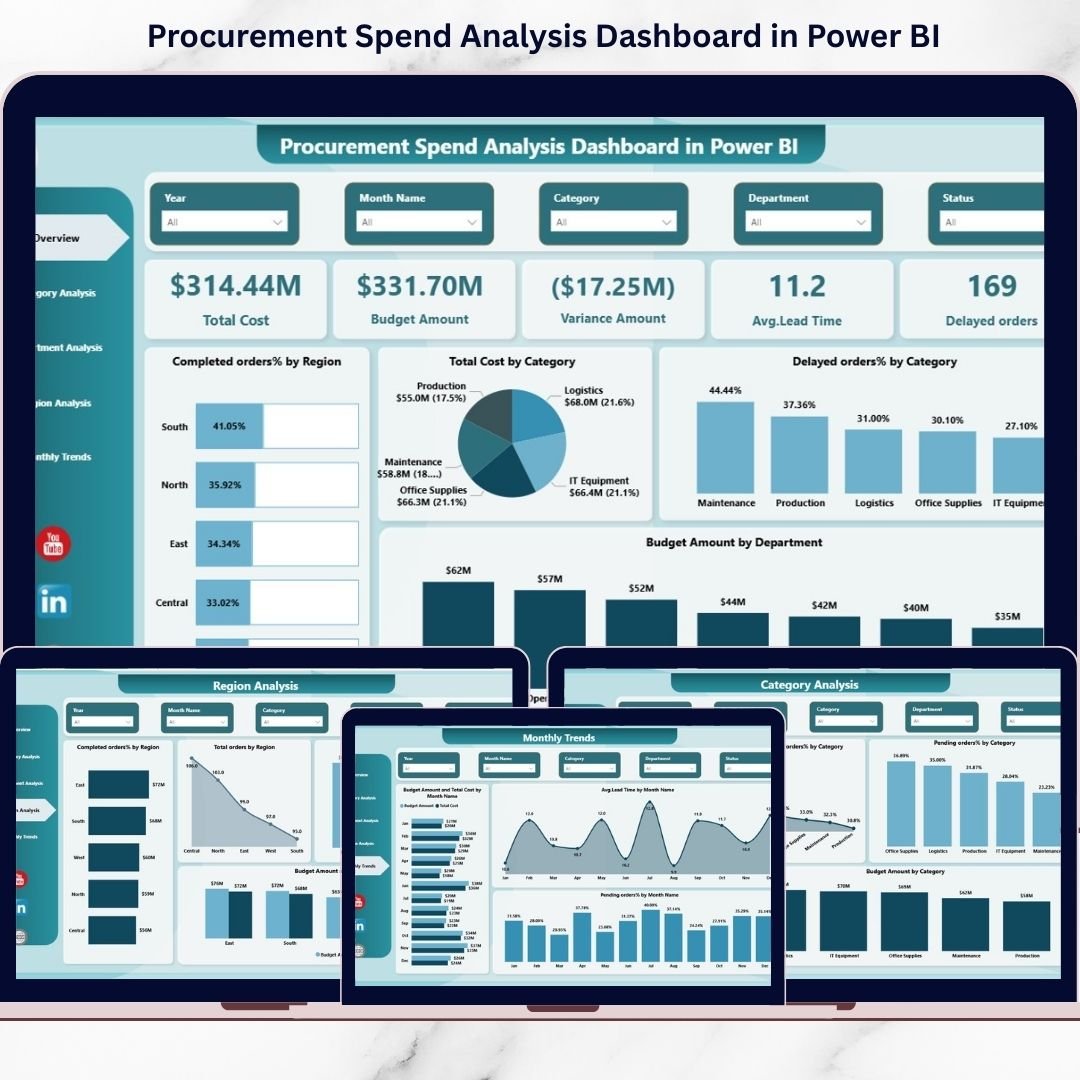
The Procurement Spend Analysis Dashboard in Power BI is focused on cost control. If your team needs to explain where procurement money is going, why variance is increasing, or which regions and departments are creating delays, this template is the clearest match. It centers on Total Cost, Budget Amount, Variance, Average Lead Time, Delayed Orders, completed order percentage, and pending order percentage.
Screenshot notes: the product screenshots show five Power BI pages: Overview, Category Analysis, Department Analysis, Region Analysis, and Monthly Trends. That gives procurement leaders a clean path from executive summary to the operational layer: category spend, department accountability, regional performance, and monthly movement.
- Use it to find high-cost categories before supplier negotiations.
- Use it to monitor delayed orders and average lead time by business area.
- Use it to compare budget variance across regions or departments.
- Use it to prepare procurement spend reviews for CFO or operations meetings.
Price: $17.99. Explore the Power BI spend analysis dashboard.
Procurement Action Plan Checklist in Excel
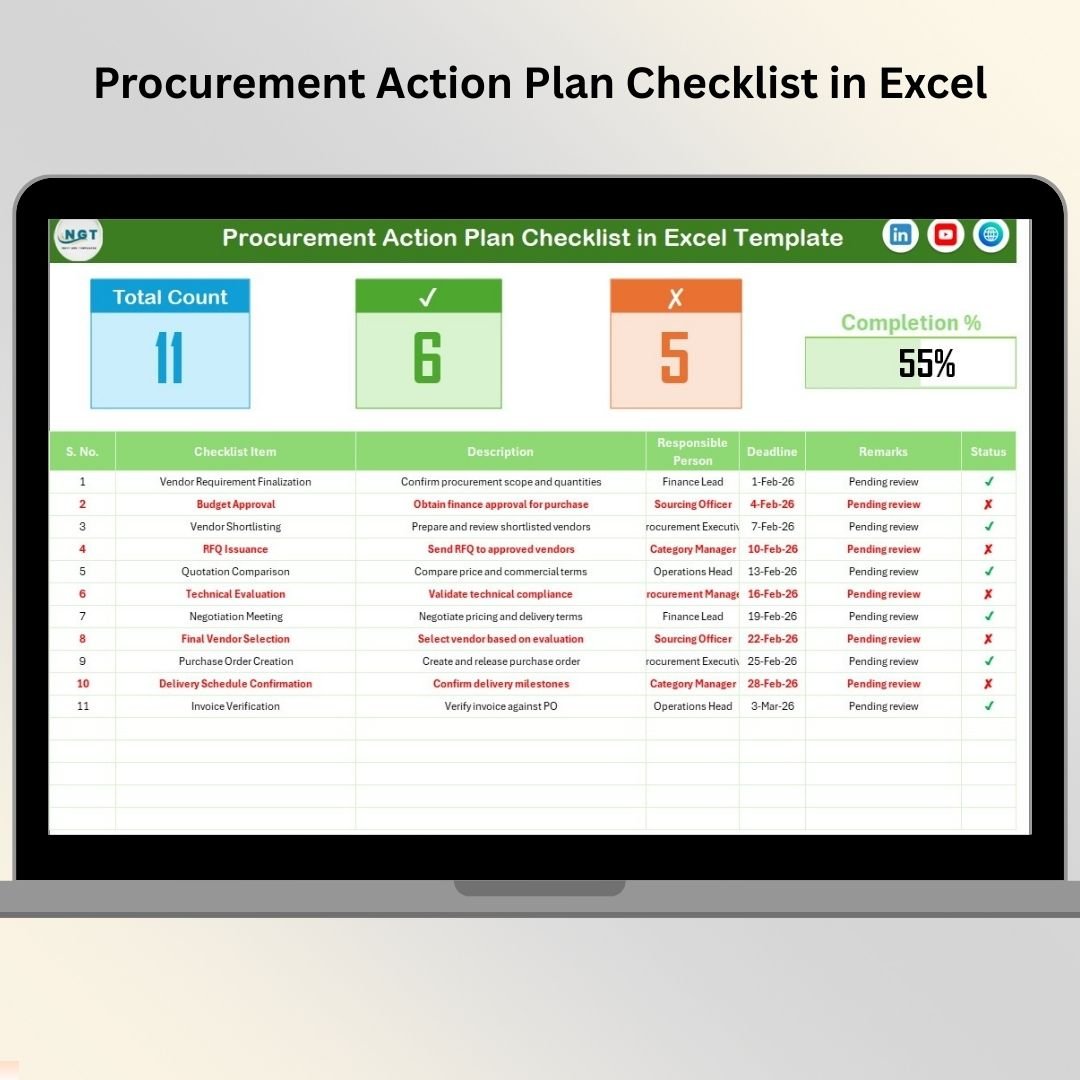
The Procurement Action Plan Checklist in Excel is not a visual analytics dashboard, but it is a useful companion to every procurement dashboard in this roundup. Dashboards reveal what is happening. Action plans make sure the team does something about it. This checklist helps sourcing teams convert findings into owners, deadlines, remarks, and completion status.
Screenshot notes: the product screenshots show a main Procurement Action Plan Checklist sheet with a summary section, total count, checked count, crossed count, and progress bar. The checklist table includes serial number, checklist item, description, responsible person, deadline, remarks, and status. A List sheet supports clean responsible-person dropdowns.
- Use it after a supplier scorecard review to assign corrective actions.
- Use it to track savings initiatives from idea to completion.
- Use it for audit follow-ups, contract renewal tasks, and approval cleanup.
- Use it to keep sourcing, finance, and operations aligned after review meetings.
Price: $1.99. Add the procurement action plan checklist.
Procurement Evaluation Checklist in Excel
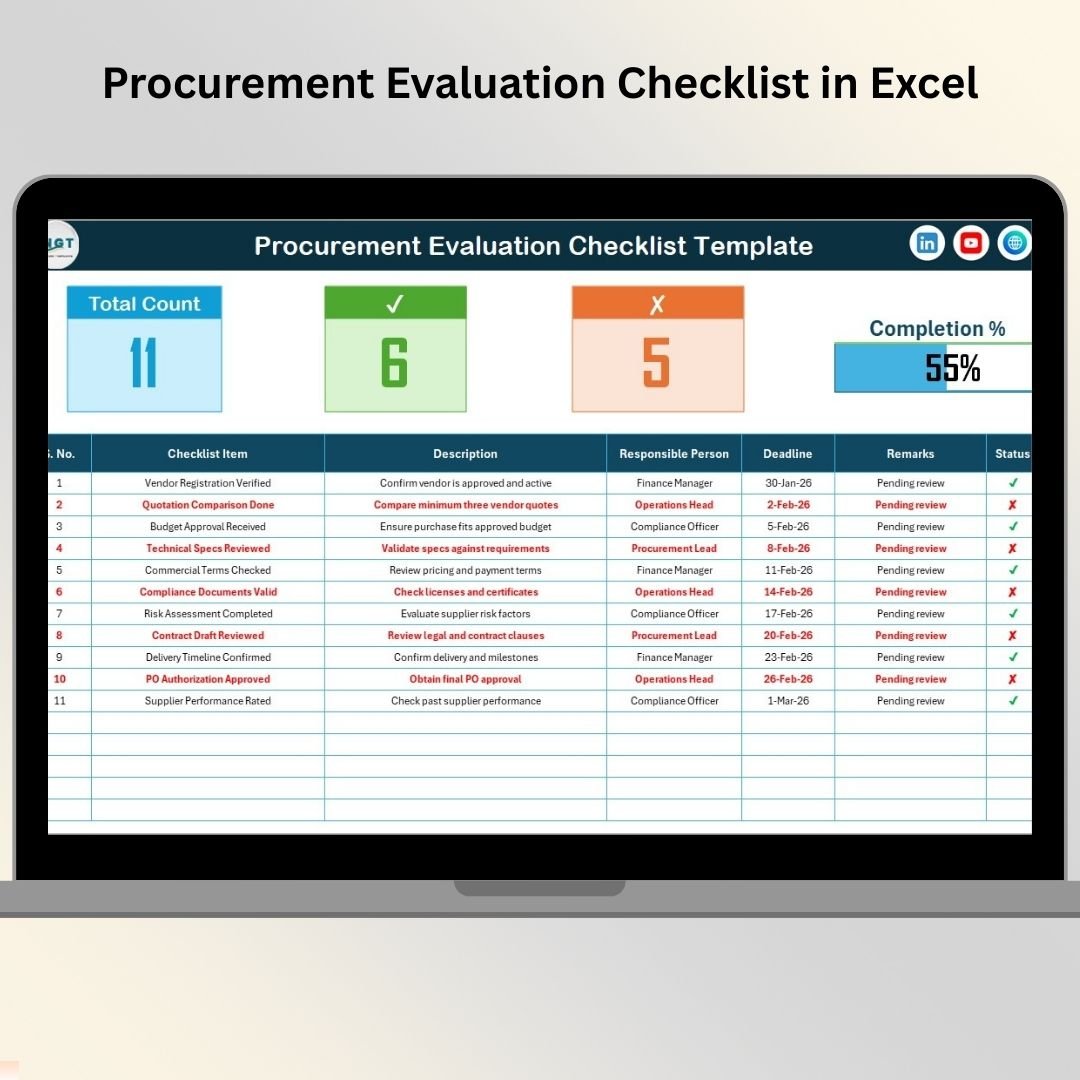
The Procurement Evaluation Checklist in Excel supports the evaluation side of procurement governance. It is useful when teams need a repeatable way to review vendors, contracts, approvals, compliance steps, and purchase decisions before they become purchase orders. For small teams, it can act as a lightweight control framework. For larger teams, it can standardize the work before data moves into a dashboard or ERP.
Screenshot notes: the screenshots show a Procurement Evaluation Checklist sheet with a top progress summary and a checklist table. The fields include serial number, checklist item, description, responsible person, deadline, remarks, and status. The List sheet supports dropdown inputs so names stay consistent across the file.
- Use it to standardize vendor evaluation before supplier onboarding.
- Use it to document contract review steps and approval readiness.
- Use it to monitor procurement compliance tasks by owner and deadline.
- Use it as a simple audit trail for purchasing decisions.
Price: $1.99. Use the procurement evaluation checklist.
Refinery Procurement KPI Dashboard in Power BI
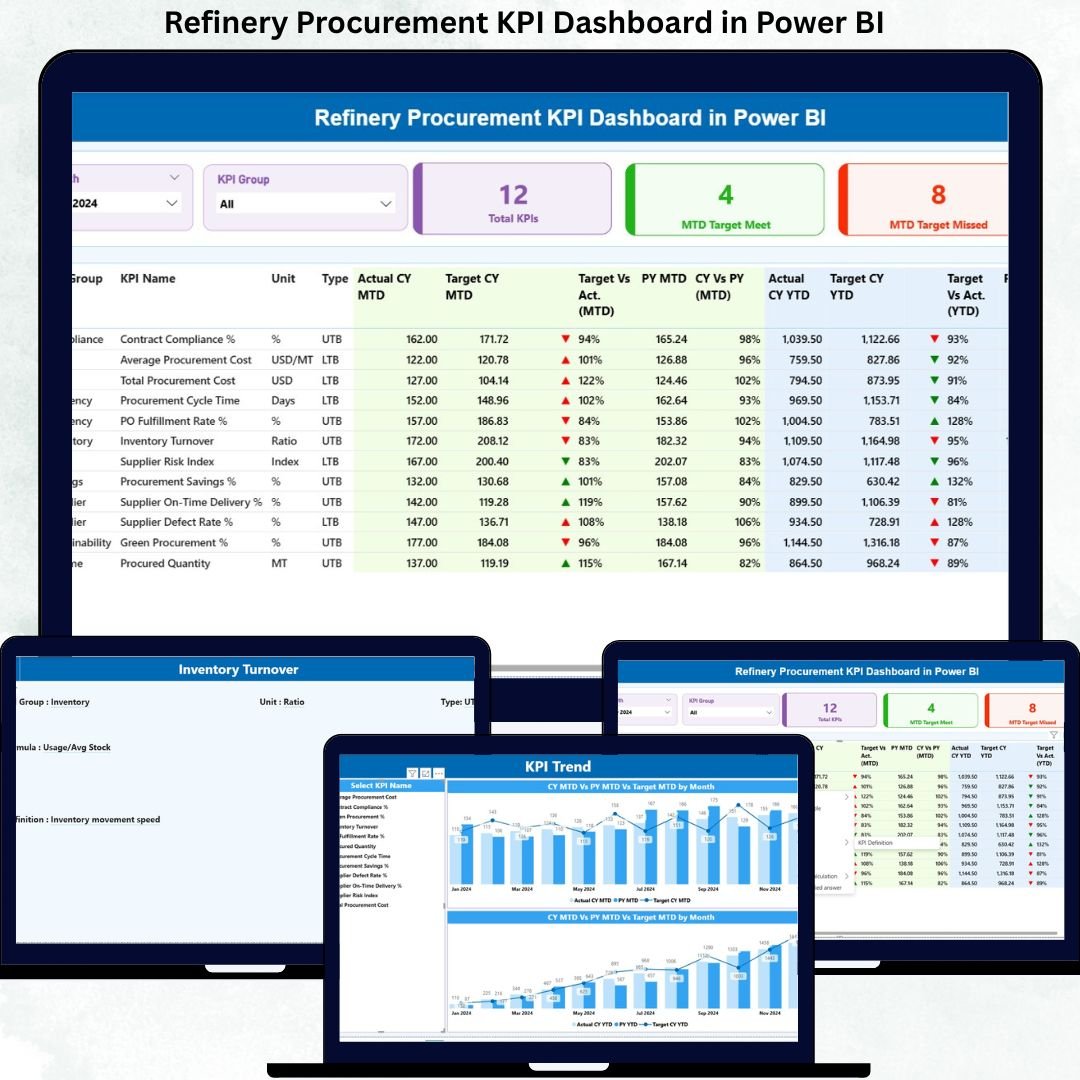
The Refinery Procurement KPI Dashboard in Power BI is built for oil and gas refinery procurement teams that need tighter KPI discipline around production continuity, supplier reliability, and procurement targets. Unlike the general management dashboards above, this product is structured around KPI tracking, MTD and YTD performance, actual vs target comparisons, current year vs previous year analysis, and visual status indicators.
Screenshot notes: the product screenshots show a Summary page, KPI Trend page, KPI Definition page, and Excel-based input model. The data model includes Input_Actual, Input_Target, and KPI Definition sheets. That makes it especially useful when the team wants standardized KPI definitions and repeatable target tracking, not just one-time spend visuals.
- Use it to monitor refinery procurement KPI performance against target.
- Use it to compare MTD and YTD actuals to previous year values.
- Use it to document KPI definitions for governance and plant leadership.
- Use it to spot procurement targets that need immediate attention.
Price: $11.99. View the refinery procurement KPI dashboard.
Clinic Procurement KPI Dashboard in Power BI
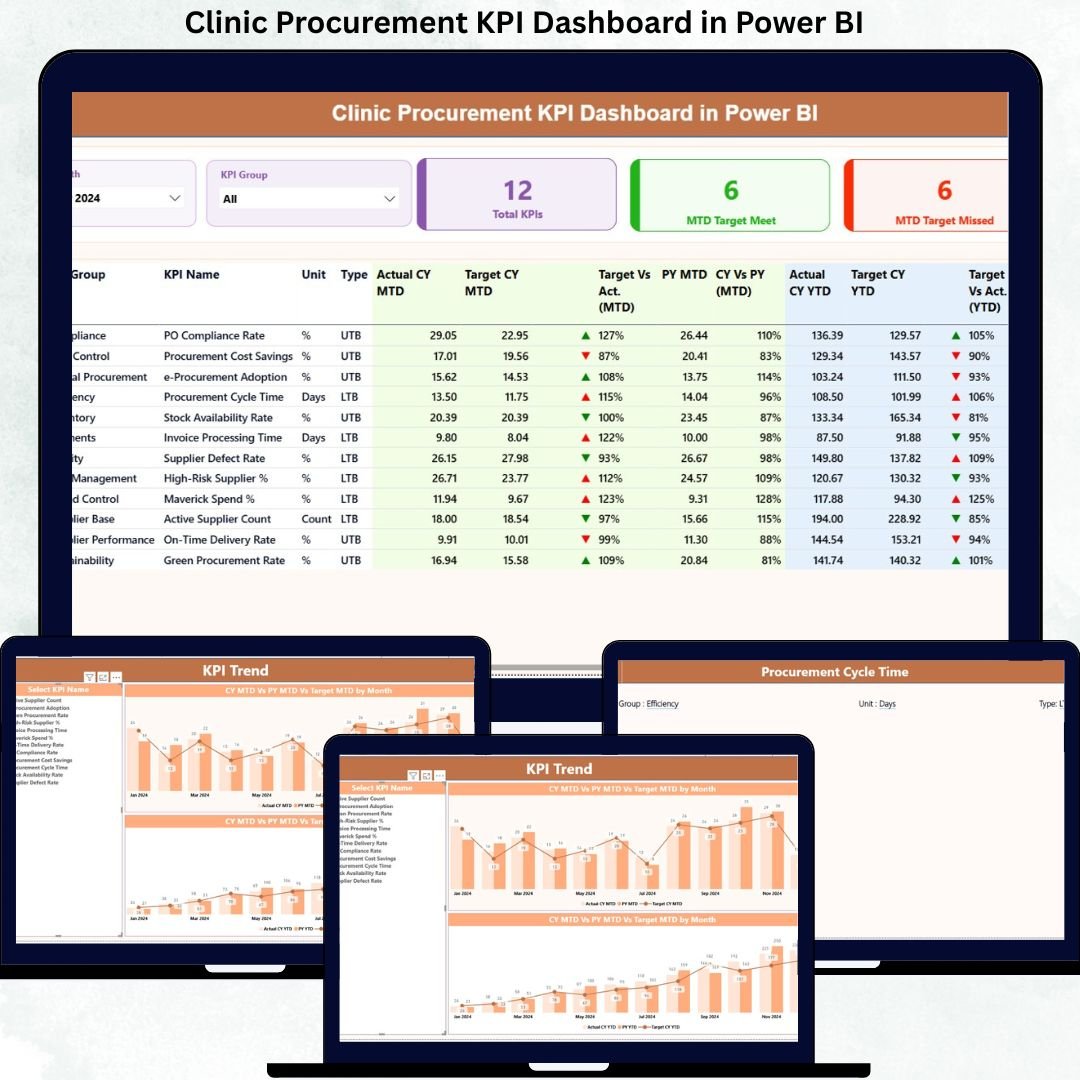
The Clinic Procurement KPI Dashboard in Power BI is designed for healthcare procurement teams that need to balance cost control, compliance, and continuity of clinical supplies. A clinic cannot treat procurement reporting as a back-office afterthought. Late orders, weak supplier tracking, and unclear KPI ownership can affect both budgets and operations. This dashboard gives clinic administrators, procurement managers, and finance teams a structured KPI reporting layer.
Screenshot notes: the screenshots show a Summary page, KPI Trend page, KPI Definition page, and Excel input structure. The summary view supports MTD and YTD performance tracking, target met versus target missed indicators, actual vs target comparison, previous year comparison, month filtering, and KPI group filtering.
- Use it to track clinic procurement performance against monthly targets.
- Use it to monitor cost control KPIs for healthcare purchasing.
- Use it to give clinic administrators a clearer view of procurement performance.
- Use it to standardize KPI definitions for compliance reviews.
Price: $11.99. Open the clinic procurement KPI dashboard.
Smart Cities Procurement Dashboard in Power BI
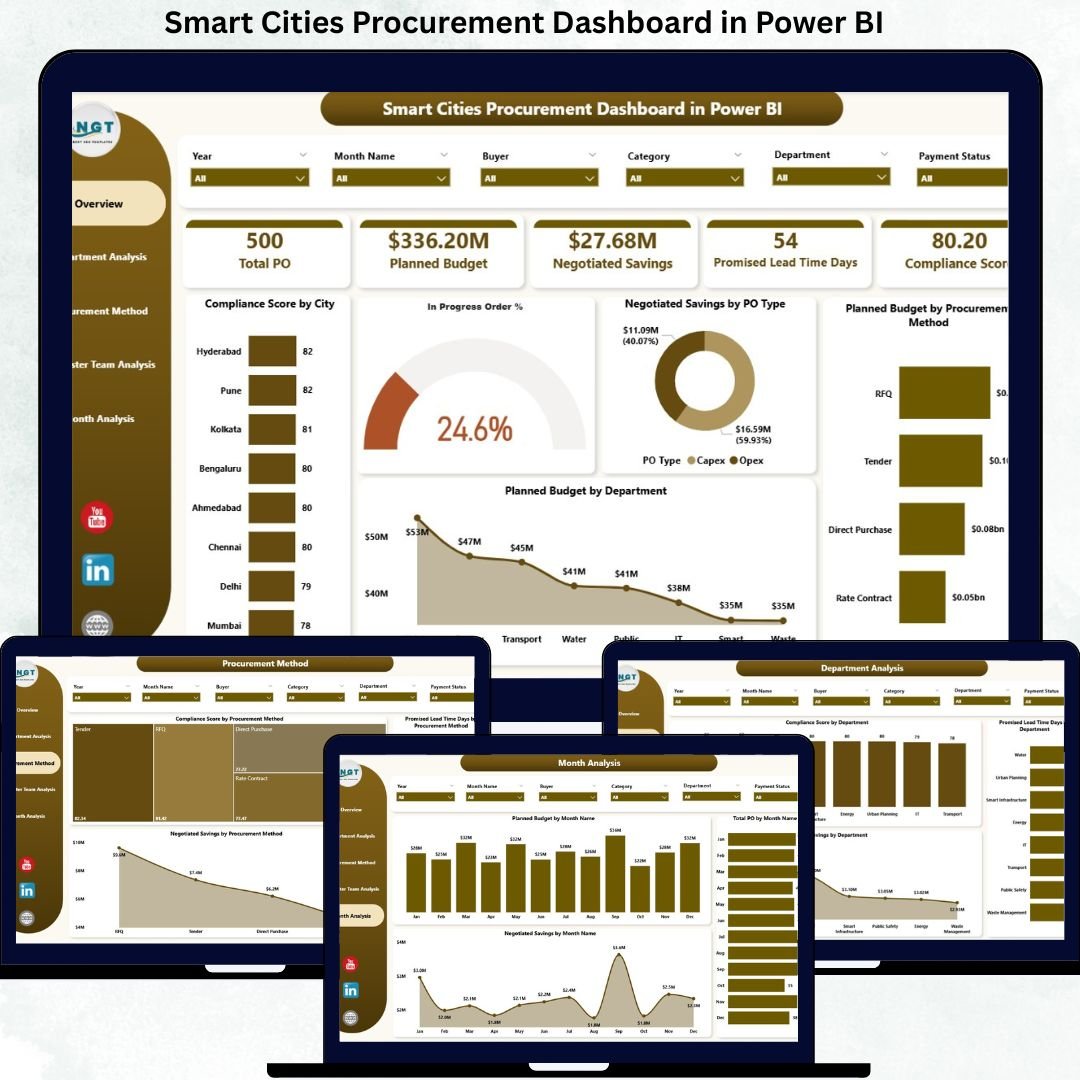
The Smart Cities Procurement Dashboard in Power BI is the best fit for public sector or municipal procurement teams that need transparency, governance, and accountability across departments. It focuses on compliance score, in-progress order percentage, negotiated savings, planned budget, procurement methods, departments, requester teams, and monthly trends. For government-style procurement, those fields are more than nice-to-have metrics. They support budget discipline and audit readiness.
Screenshot notes: the product screenshots show five analytical pages: Overview, Department Analysis, Procurement Method Analysis, Requester Team Analysis, and Monthly Trends. The Overview page includes slicers for city, department, procurement method, and time period, plus KPI cards for compliance, in-progress orders, negotiated savings, and planned budget.
- Use it to track procurement compliance by city, department, or method.
- Use it to monitor negotiated savings and planned budget.
- Use it to identify requester teams that need stronger procurement discipline.
- Use it to prepare transparent reporting for smart city program leaders.
Price: $17.99. Review the smart cities procurement dashboard.
How to Choose the Right Procurement Dashboard Template
The right procurement dashboard depends on your reporting audience, data maturity, and the decision you need to support. Use this decision framework before buying:
- Choose Excel when data entry is still spreadsheet-first. The Procurement Management Dashboard in Excel is best when buyers, analysts, and managers are already comfortable updating workbook data and refreshing pivot tables.
- Choose Power BI when leadership wants interactive reporting. The Power BI procurement management dashboard and Power BI spend analysis dashboard are better when users need slicers, drill-downs, and presentation-ready analytics.
- Choose KPI dashboards when targets matter more than transactions. The refinery and clinic dashboards are built around MTD, YTD, actual vs target, prior-year comparison, and KPI definitions.
- Choose checklist tools when the main gap is process control. The action plan and evaluation checklists are best for ownership, deadlines, approval readiness, and audit follow-up.
- Choose an industry dashboard when procurement rules are specialized. Smart city, refinery, and clinic procurement teams need more specific fields than a generic purchase order tracker can provide.
If you are unsure, start with the broad Procurement Management Dashboard in Power BI for an interactive reporting view, or the Procurement Management Dashboard in Excel for fast adoption. Then add the checklist companion that matches your process gap.
Procurement Dashboard FAQs
What is a procurement dashboard?
A procurement dashboard is a reporting view that tracks purchasing activity, supplier performance, spend, purchase orders, savings, delivery timelines, budget variance, and procurement KPI results. It helps sourcing teams move from scattered records to one decision-ready view.
Which procurement dashboard template is best for Excel users?
The best option for Excel users in this roundup is the Procurement Management Dashboard in Excel. It includes dashboard pages, a data sheet, and support pivots, so users can update procurement records and refresh reporting without building charts manually.
Which procurement dashboard template is best for Power BI users?
The Procurement Management Dashboard in Power BI is the best broad Power BI choice because it covers spend, budget variance, suppliers, categories, delivery performance, and executive KPI cards.
Can these templates work as a purchase order tracker?
Yes. The management dashboards can support purchase order tracker workflows because they include order status, total orders, delivery performance, lead time, supplier analysis, and spend views. Teams can use them to monitor PO progress and identify delayed or high-risk purchasing activity.
What procurement KPI should sourcing teams track first?
Start with total spend, budget variance, on-time delivery rate, average lead time, supplier quality score, delayed orders, and negotiated savings. These procurement KPI measures connect directly to cost control, supplier accountability, and operational continuity.
Should a small business use Excel or Power BI for procurement reporting?
Use Excel if the team wants the fastest setup and easiest data editing. Use Power BI if the team wants interactive filtering, dashboard sharing, and more visual reporting. Many small teams start with Excel and move to Power BI when reporting demand grows.
Are the checklist templates replacements for dashboards?
No. The checklist templates solve a different problem. A dashboard shows what is happening; a checklist helps the team assign owners, deadlines, evaluation steps, and action follow-up. They work best as companion tools.
Which template is best for supplier scorecards?
For supplier scorecards, start with the Procurement Management Dashboard in Power BI or Excel. Both include supplier analysis elements such as quality score, lead time, on-time delivery, supplier spend, and category-level views.
Which template is best for public sector procurement?
The Smart Cities Procurement Dashboard in Power BI is the best fit for public sector procurement because it tracks compliance score, planned budget, negotiated savings, departments, procurement methods, requester teams, and monthly trends.
Final Recommendation for Sourcing Teams
If your goal is end-to-end procurement visibility, do not buy a template only because it looks good. Match it to the decision you need to make. For broad procurement reporting, choose the Power BI procurement management dashboard or the Excel procurement management dashboard. For spend control, choose the Power BI spend analysis dashboard. For KPI governance in specialized environments, choose the refinery, clinic, or smart cities dashboard. For process discipline, add the action plan or evaluation checklist.
Built by PK – Microsoft Certified Professional with 15+ years of Excel, Google Sheets, and Power BI experience. Founder of NextGenTemplates, reaching 300K+ subscribers across YouTube channels. Every template is hand-built and tested before release.