

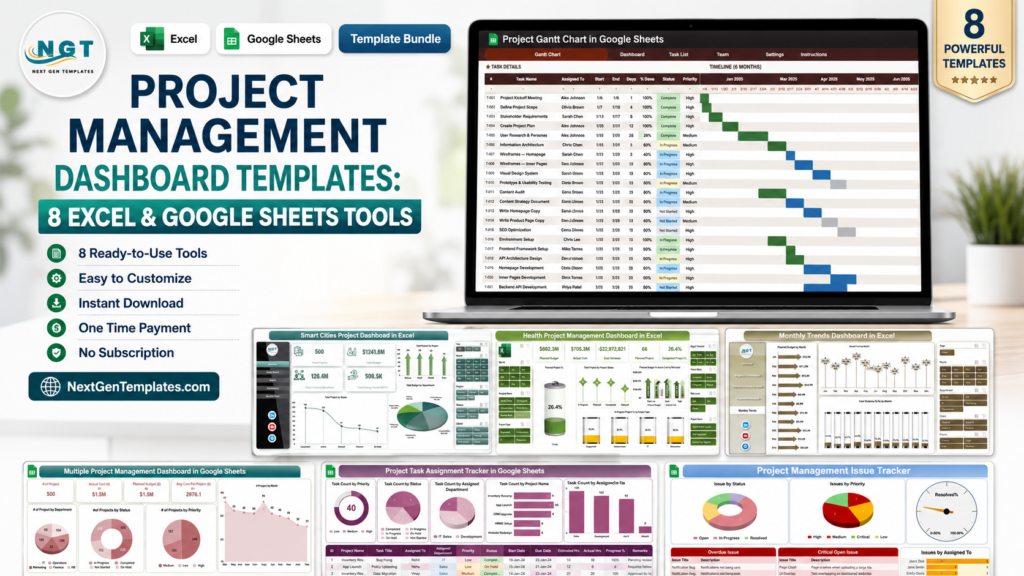
Project management dashboard templates are the fastest way to get budget, timeline, task, risk, and portfolio visibility without rolling out a full SaaS project-management platform. The PMI Pulse of the Profession 2025 notes that only 18% of project professionals report high business-acumen proficiency, while 66% are moderate and 16% are low. That gap matters because project reporting is not just administration; it is how managers connect work, cost, risk, and business value.
Weighing a switch away from paid project software? See our roundup of Asana alternative Excel & Google Sheets templates that replace Asana with a one-time purchase.
Leaving a subscription platform? Read our roundup of Monday.com alternatives in Excel & Google Sheets for one-time-purchase work management boards and dashboards.
For small teams, consultants, PMOs, city programs, energy projects, and healthcare administrators, Excel and Google Sheets can be a practical first layer of control. As of this review, Asana lists its Advanced plan at $24.99 per user/month billed annually, monday.com lists Standard at $12 per seat/month billed annually, and ClickUp lists Business at $12 per user/month billed yearly. The eight NextGenTemplates tools below are one-time template purchases from $6.99 to $13.99, with a separate Project Management Pro Bundle option for teams that want several project tools together.
Key Features of These Project Management Dashboard Templates
These templates are built for teams that need quick reporting, not a months-long systems implementation. Across the eight tools, you can track project status, planned budget, actual cost, completion percentage, task owners, priorities, risk, issue logs, Gantt timelines, contractor performance, region-level views, and monthly trends.
- Portfolio visibility: PMO and multi-project dashboards summarize many projects in one view.
- Timeline control: Gantt tools show task schedules, dependencies, phases, and delays.
- Task accountability: trackers assign owners, due dates, priorities, progress, and workload.
- Budget discipline: dashboards compare planned cost, actual cost, variance, and profitability.
- Industry context: smart city, electricity, and healthcare dashboards include fields tailored to real project environments.
Dashboard Pages and Tracker Views Explained
The Excel dashboards usually include an executive overview, budget or cost analysis, project-type analysis, department or manager analysis, and monthly trends. The Google Sheets templates focus more on collaboration: shared task lists, dashboard charts, issue logs, Gantt timelines, and workload views that team members can update from the browser.
Use a dashboard when leadership needs a weekly or monthly status review. Use a Gantt chart when the question is, ‘What happens next, and what is blocking it?’ Use a task or issue tracker when the team needs daily ownership and follow-up.
Excel and Google Sheets Templates vs. Asana, Monday.com, and ClickUp – Feature Comparison
| Decision Area | Excel and Google Sheets Templates | Asana, Monday.com, or ClickUp |
|---|---|---|
| Cost model | One-time purchase per template, usually $6.99 to $13.99 | Monthly or annual per-user subscription |
| Setup time | Fast if your team already has spreadsheet data | Fast to start, but workflow design and permissions take time |
| Gantt chart | Available through dedicated Gantt templates | Available on selected paid plans or views |
| Task tracking | Works well for small teams with clear update discipline | Better for live notifications, comments, assignments, and automations |
| Portfolio dashboard | Good for PMO reporting and monthly reviews | Stronger for enterprise rollups, dependencies, and governance |
| Custom fields | Fully editable formulas, columns, charts, and layouts | Configurable, but limited by plan and admin settings |
| Year-1 cost at 5 users | $6.99 to $13.99 per individual tool, or $49.99 for the bundle option | About $720 to $1,499 per year before add-ons, based on public annual prices reviewed in July 2026 |
Who Should Use This Template Stack
Use these project management dashboard templates if your team already works in Excel or Google Sheets, needs a cleaner reporting layer quickly, and does not yet need a full workflow platform. They fit PMO directors, project managers, consultants, startup operators, city program managers, energy-sector analysts, healthcare administrators, and teams that manage many small projects at once.
They are not the best fit if you need enterprise permissions, automatic notifications, deep mobile workflows, SSO, time approval, native chat, or live task dependencies across hundreds of users. In that case, a SaaS platform may still be worth the subscription cost.
Real-World Use Cases
- PMO monthly review: Combine PMO budget, cost, priority, status, and manager views for leadership meetings.
- Infrastructure portfolio: Track smart city, electricity, transport, or public-sector project spend and delivery progress.
- Healthcare project control: Monitor hospital initiatives, equipment installations, compliance projects, and budget variance.
- Team execution: Use a Gantt chart for planning, a task tracker for owners, and an issue tracker for risks and blockers.
Advantages of Project Management Dashboard Templates
The main advantage is speed. Instead of designing charts from a blank workbook, you start with a structured template and adapt it to your project fields. The second advantage is ownership: your team keeps the file, formulas, and reporting logic. The third is cost control, especially when the first problem is not complex collaboration but scattered reporting.
Opportunities for Improvement
Spreadsheet templates work best when the data process is clear. Assign one owner for source data, define update frequency, keep archived monthly snapshots, and avoid editing formulas without a backup. If several people update the same Excel file, use OneDrive or SharePoint version history. If many people update tasks daily, Google Sheets or a SaaS tool will usually be easier to govern.
Best Practices
- Define the five to ten KPIs leadership actually reviews.
- Keep raw data in structured tables rather than free-form notes.
- Refresh dashboards before recurring project meetings, not after.
- Use Gantt charts for schedule planning and task trackers for daily ownership.
- Keep issue tracking separate from normal task tracking so blockers stay visible.
- Review budget variance and delayed tasks together; cost and schedule problems often travel together.
Explore Relevant Templates
| Template | Platform | Best For | Sale Price |
|---|---|---|---|
| Smart Cities Project Dashboard in Excel | Excel | Urban development and smart infrastructure programs | $13.99 |
| Electricity Project Dashboard in Excel | Excel | Power, grid, renewable, and contractor project reporting | $13.99 |
| Project Management Office (PMO) Dashboard in Excel | Excel | Portfolio, budget, cost, and manager-level PMO reporting | $13.99 |
| Health Project Management Dashboard in Excel | Excel | Healthcare project cost, status, and leadership review | $13.99 |
| Multiple Project Management Dashboard in Google Sheets | Google Sheets | Shared multi-project monitoring and team collaboration | $9.99 |
| Project Gantt Chart in Google Sheets | Google Sheets | Timeline planning, task dependencies, and workload views | $12.99 |
| Project Task Assignment Tracker in Google Sheets | Google Sheets | Task owners, due dates, progress, and workload tracking | $6.99 |
| Project Management Issue Tracker in Google Sheets | Google Sheets | Issue logs, risks, blockers, priority, and resolution status | $6.99 |
For more options, browse the Excel Project Management templates and Google Sheets Project Management templates categories.
1. Smart Cities Project Dashboard in Excel
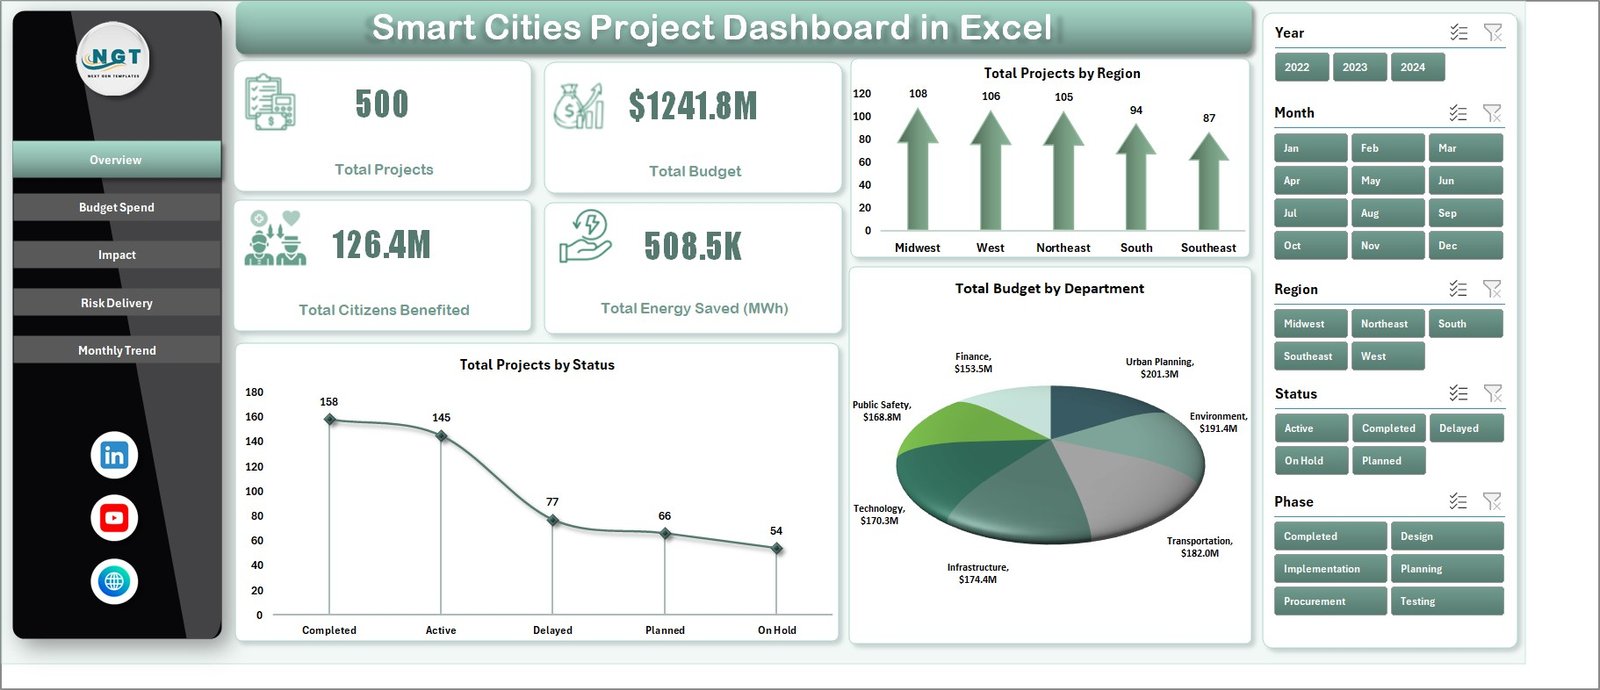
This template is best for city administrators and planning teams that need one view of smart infrastructure projects, budgets, status, regions, environmental impact, and delivery risk. It is a strong choice for public-sector programs that need clearer reporting without custom software.
View Smart Cities Project Dashboard
2. Electricity Project Dashboard in Excel
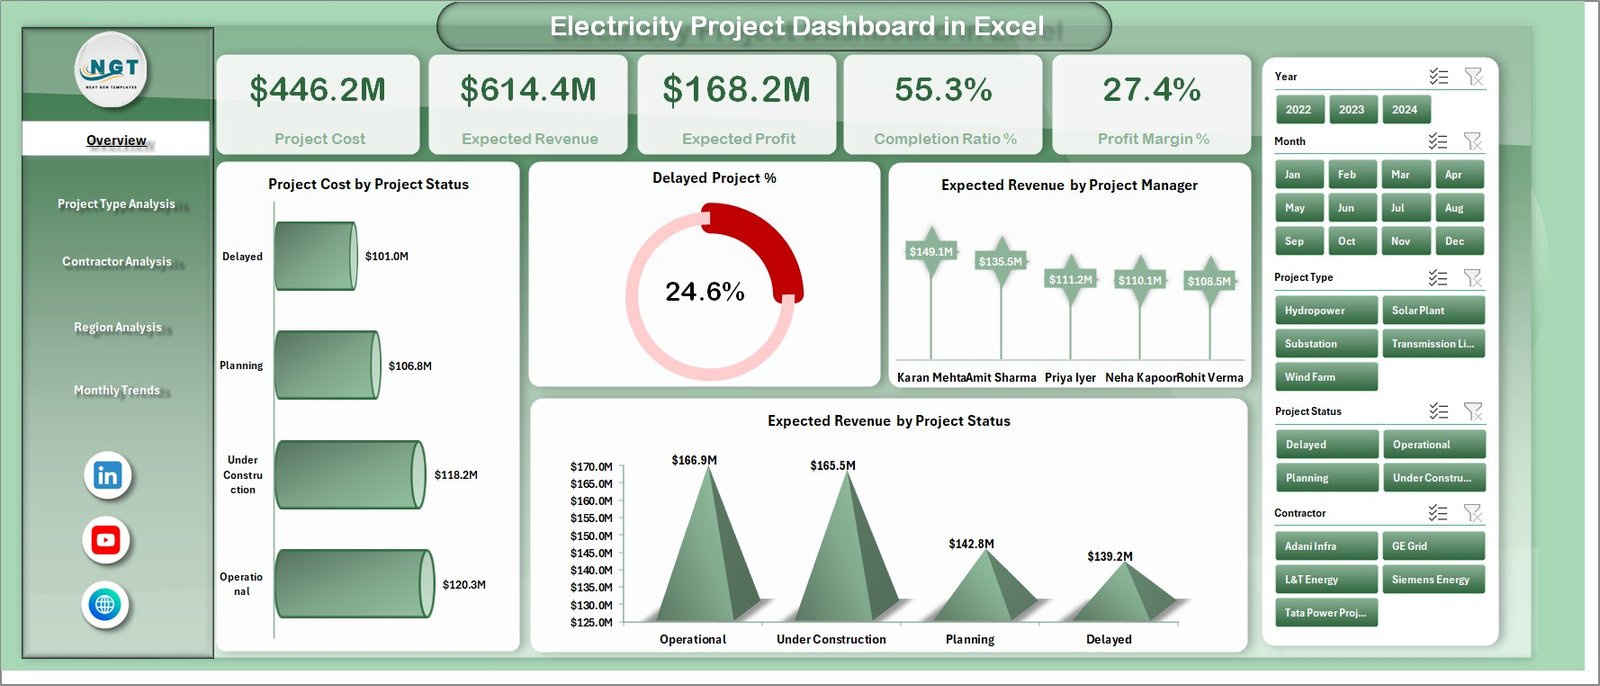
Use this Excel dashboard for electricity infrastructure, substations, transmission lines, renewable projects, and contractor performance reporting. It focuses on project cost, expected revenue, expected profit, completion ratio, regions, project types, and monthly trends.
View Electricity Project Dashboard
3. Project Management Office (PMO) Dashboard in Excel
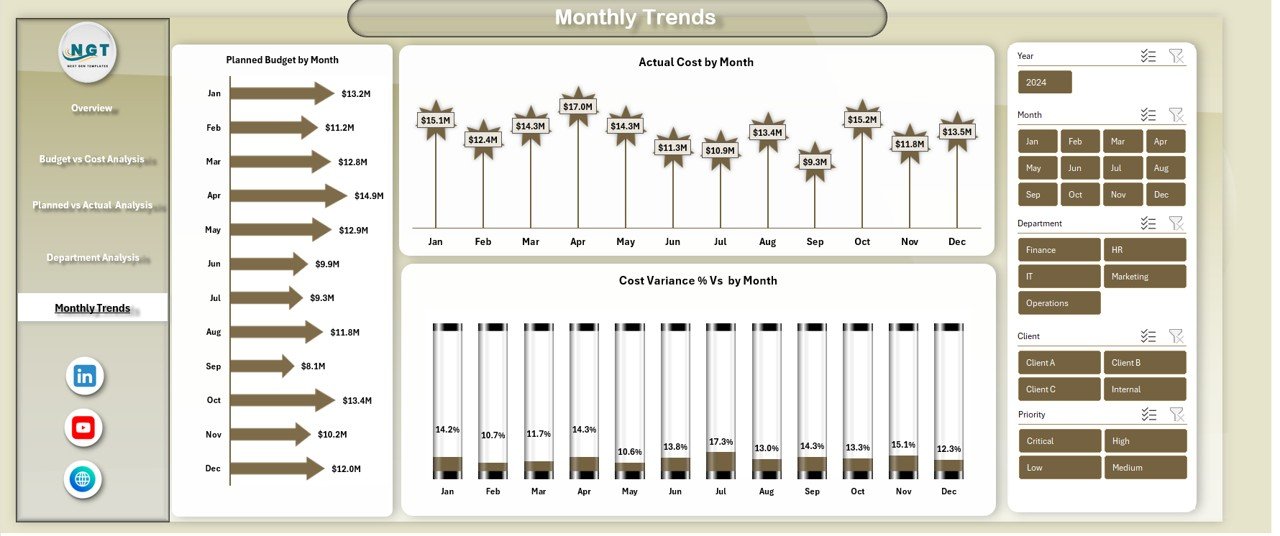
This is the strongest portfolio-style option in the list. PMO teams can track planned budget, actual cost, variance, project count by status, project count by priority, department performance, project manager views, and monthly trend movement.
4. Health Project Management Dashboard in Excel
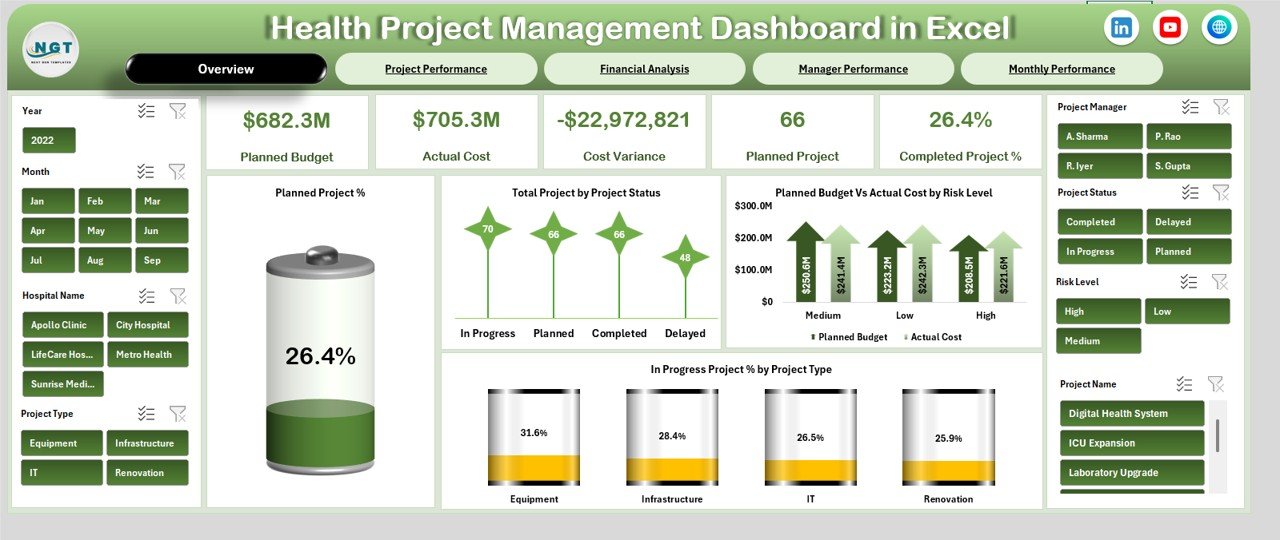
Healthcare teams can use this dashboard for hospital expansions, compliance initiatives, IT upgrades, medical equipment projects, and service improvement programs. The workbook emphasizes planned budget, actual cost, risk, project status, manager performance, and monthly trends.
View Health Project Management Dashboard
5. Multiple Project Management Dashboard in Google Sheets
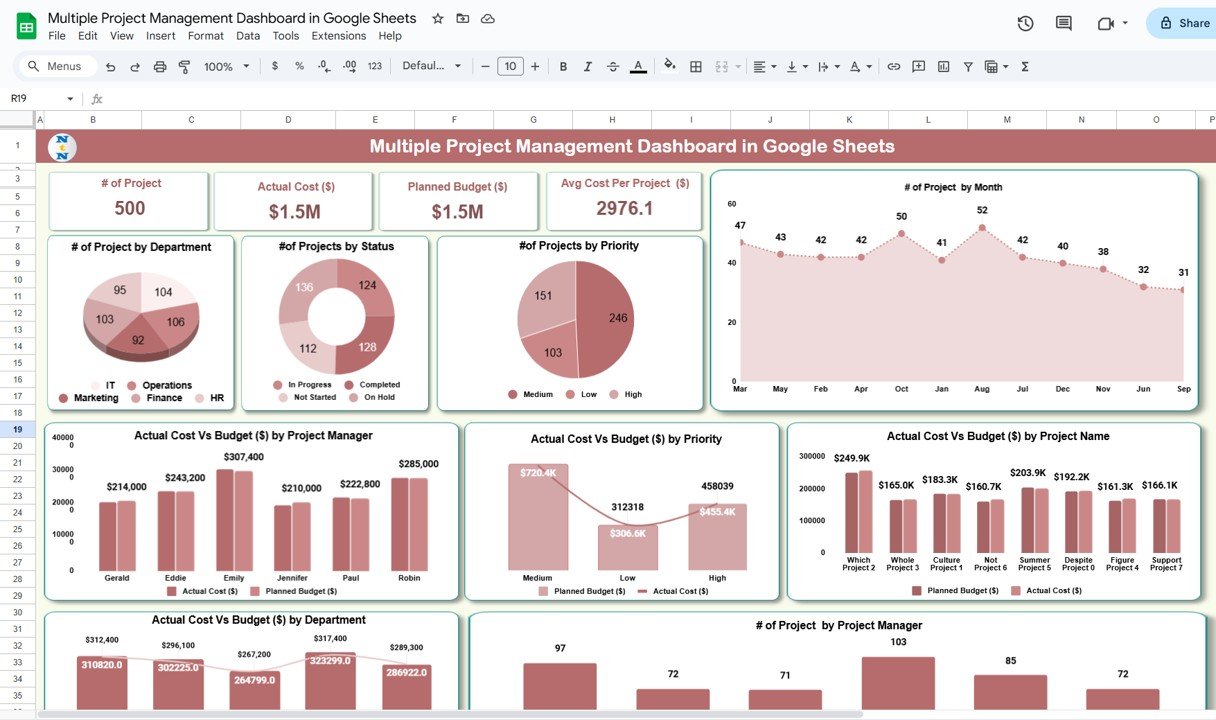
This Google Sheets dashboard is useful when more than one stakeholder needs shared access to project status, budget, progress, department, manager, and performance views. It is the better choice when collaboration matters more than offline Excel control.
View Multiple Project Dashboard
6. Project Gantt Chart in Google Sheets
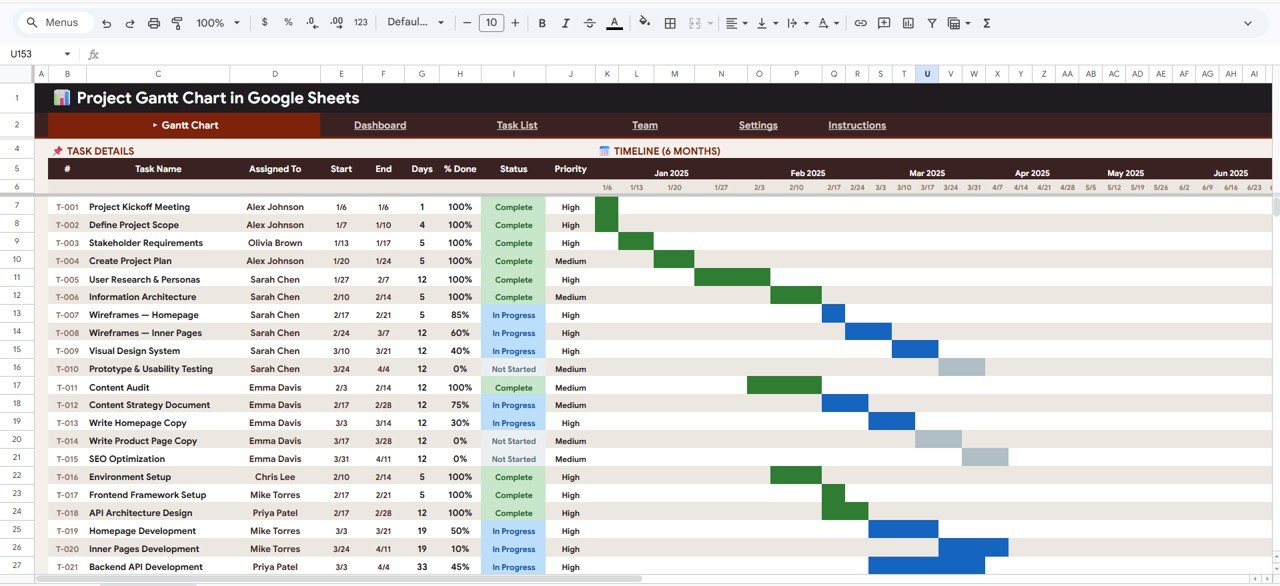
Choose this tool when scheduling is the main problem. It supports visual timelines, task dependencies, team workload, task details, settings, priority filters, status views, and a dashboard page for progress monitoring.
7. Project Task Assignment Tracker in Google Sheets
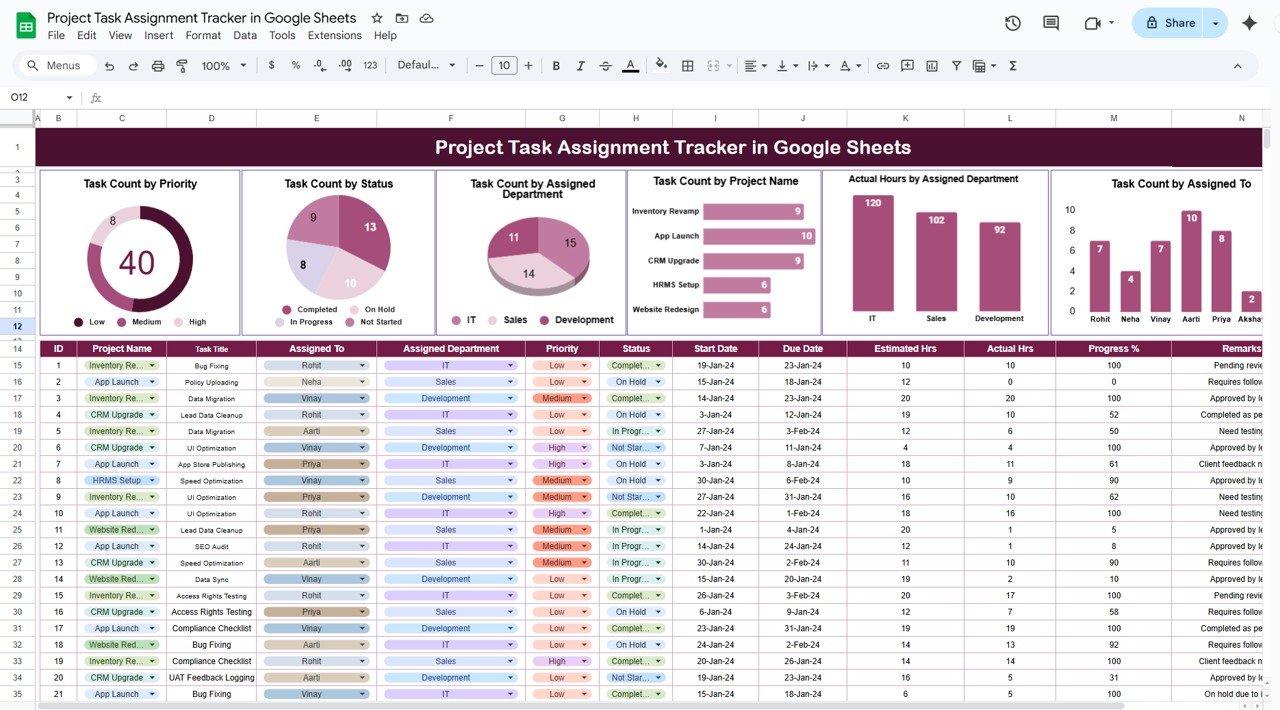
This tracker is built for task ownership. It helps teams assign tasks, monitor due dates, compare estimated and actual hours, track progress, and review workload by department, project, owner, priority, and status.
8. Project Management Issue Tracker in Google Sheets

Use this tracker for problems that should not get buried in normal task lists: blockers, risks, open issues, priority levels, assignees, progress, and resolution notes. It is especially useful for weekly project review meetings.
Frequently Asked Questions
Can Excel or Google Sheets replace Asana, Monday.com, or ClickUp?
Sometimes, but not always. A spreadsheet template can replace light reporting, project status reviews, task lists, Gantt charts, and issue logs. It should not replace SaaS software when you need live notifications, advanced permissions, enterprise audit logs, workload automation, or large-team governance.
Which project management template should I start with?
Start with the PMO Dashboard in Excel if leadership needs portfolio reporting. Start with the Project Gantt Chart in Google Sheets if scheduling is the main pain. Start with the Task Assignment Tracker if the issue is daily ownership.
Are these templates one-time purchases?
Yes. The templates listed here are one-time purchases on NextGenTemplates. They are not monthly SaaS subscriptions.
Which format is better for collaboration?
Google Sheets is usually better for live collaboration because multiple users can update the file in the browser. Excel is better when one analyst owns reporting, needs offline control, or wants deeper workbook customization.
Is the Project Management Pro Bundle worth it?
If you need Gantt charts, task tracking, issue tracking, progress tracking, and multi-project dashboards together, the Project Management Pro Bundle is the best-value option because it packages several premium tools in one download.
About the Author
Built by PK – Microsoft Certified Professional with 15+ years of Excel, Google Sheets, and Power BI experience. Founder of NextGenTemplates, reaching 300K+ subscribers across YouTube channels. Every template is hand-built and tested before release.
Conclusion
If your team needs project visibility now, start with a template that matches the problem: PMO dashboard for portfolio control, Gantt chart for timeline planning, task tracker for ownership, issue tracker for blockers, and industry dashboards for smart city, electricity, or healthcare programs. For tutorials and walkthroughs, visit the NextGenTemplates YouTube channel.
Best next step: browse the Project Management Pro Bundle if you want the widest toolkit, or choose one of the eight templates above for a focused reporting problem.
Last updated: July 4, 2026.
Trimming SaaS costs across your stack? Our guide to Zoho CRM alternatives in Excel and Sheets covers affordable customer-tracking templates from $4.99.
Running sales beside delivery? Our guide to Pipedrive alternatives in Excel and Google Sheets shows one-time pipeline templates that replace Pipedrive from $9.99.
Watching costs? See our roundup of cheap Excel dashboard templates under $15 – 12 KPI dashboards across Excel, Google Sheets and Power BI from $11.99, with an honest bundle-vs-single breakdown.