

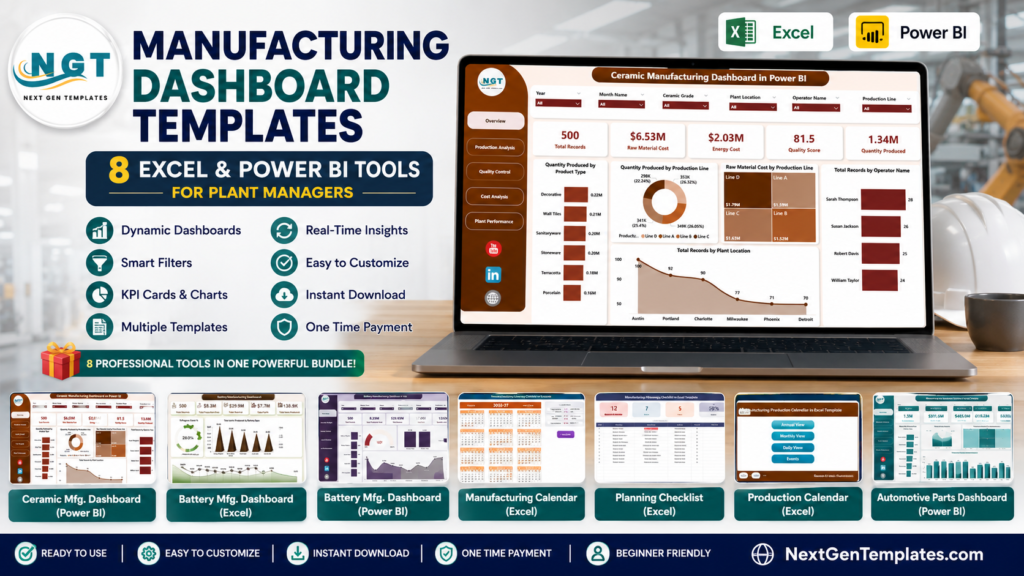
Manufacturing dashboard templates are becoming a practical middle path for plant managers who need OEE, downtime, scrap, production variance, and plant efficiency visibility without waiting on a long software rollout. U.S. factories are under pressure from labor constraints, reshoring expectations, material cost volatility, and tighter customer delivery windows. The reporting problem is familiar: production data sits in shift logs, ERP exports, Excel files, and Power BI models, while leadership wants one clear answer by 8 a.m.
New to the numbers behind these dashboards? Our guide to the 12 manufacturing KPIs to track in 2026 gives the exact formula and benchmark range for OEE, downtime, scrap and every metric these templates calculate.
The cost gap is also real. Microsoft lists Power BI Pro at $14 per user per month, so a five-user analytics setup can run $840 per year before anyone builds a manufacturing model. By contrast, several of the Power BI templates in this guide are $17.99 one-time downloads. This post compares 8 specific Excel and Power BI tools for plant managers, production supervisors, quality teams, and operations analysts.
| Template | Format | Best For | Price |
|---|---|---|---|
| Ceramic Manufacturing Dashboard in Power BI | Power BI | Interactive ceramic production, quality, cost, and plant analytics | $17.99 |
| Ceramic Manufacturing Dashboard in Excel | Excel | Ceramic production reporting with familiar spreadsheet controls | $17.99 |
| Battery Manufacturing Dashboard in Power BI | Power BI | Battery plants tracking output, QC pass rates, costs, revenue, and line efficiency | $17.99 |
| Battery Manufacturing Dashboard in Excel | Excel | Battery production teams that want a spreadsheet-based reporting file | $13.99 |
| Manufacturing Production Calendar in Excel | Excel | Production scheduling, events, maintenance windows, and shift planning | $4.99 |
| Automotive Parts Manufacturing Dashboard in Power BI | Power BI | Automotive production, defects, delayed orders, revenue, cost, and plant trends | $17.99 |
| Manufacturing Planning Checklist in Excel | Excel | Task ownership, deadlines, readiness checks, and production planning control | $1.99 |
| Automotive Parts Manufacturing Dashboard in Excel | Excel | Automotive operations teams that want Excel-based production and variance reporting | $13.99 |
Why Plant Managers Need a Manufacturing Dashboard Now
A production dashboard is not just a pretty chart page. It is the operating layer that helps managers connect output, labor, scrap, downtime, cost, and quality before the next shift starts. Five data points explain why this matters for U.S. manufacturers:
- $2.93 trillion in quarterly manufacturing value: NIST reported that manufacturers added $2.93 trillion to the U.S. economy in Q3 2024 and represented about 10% of GDP during that period.
- 15.0 million manufacturing employees: NIST also reports 15.0 million employees in U.S. manufacturing in 2024, equal to 9.3% of total U.S. employment.
- $2.90 trillion in 2025 value added: The National Association of Manufacturers notes that U.S. manufacturing value added reached $2.90 trillion in 2025, large enough to rank among the world’s biggest economies if measured separately.
- $14 per user per month is the BI license benchmark: Power BI Pro pricing makes shared analytics useful, but a template still saves model-building time before the first report is published.
- $1.99 to $17.99 is the template range in this roundup: For plants that already work in Excel or Power BI, a ready-made template can be the fastest way to start tracking OEE drivers, production variance, scrap, downtime, cost, and schedule reliability.
For broader plant benchmarking, pair this roundup with the Manufacturing Efficiency Dashboard in Power BI. For target-versus-actual variance reviews, the Manufacturing KPI Scorecard in Excel is a useful companion for monthly operations meetings.
 Launch offer
From your first Pivot Table to the Data Model, DAX, Power Query and a one-page KPI dashboard. 11h 51m of video by PK, with practice files, quizzes and a capstone.
8 Manufacturing Dashboard Templates for Plant Managers
Ceramic Manufacturing Dashboard in Power BI
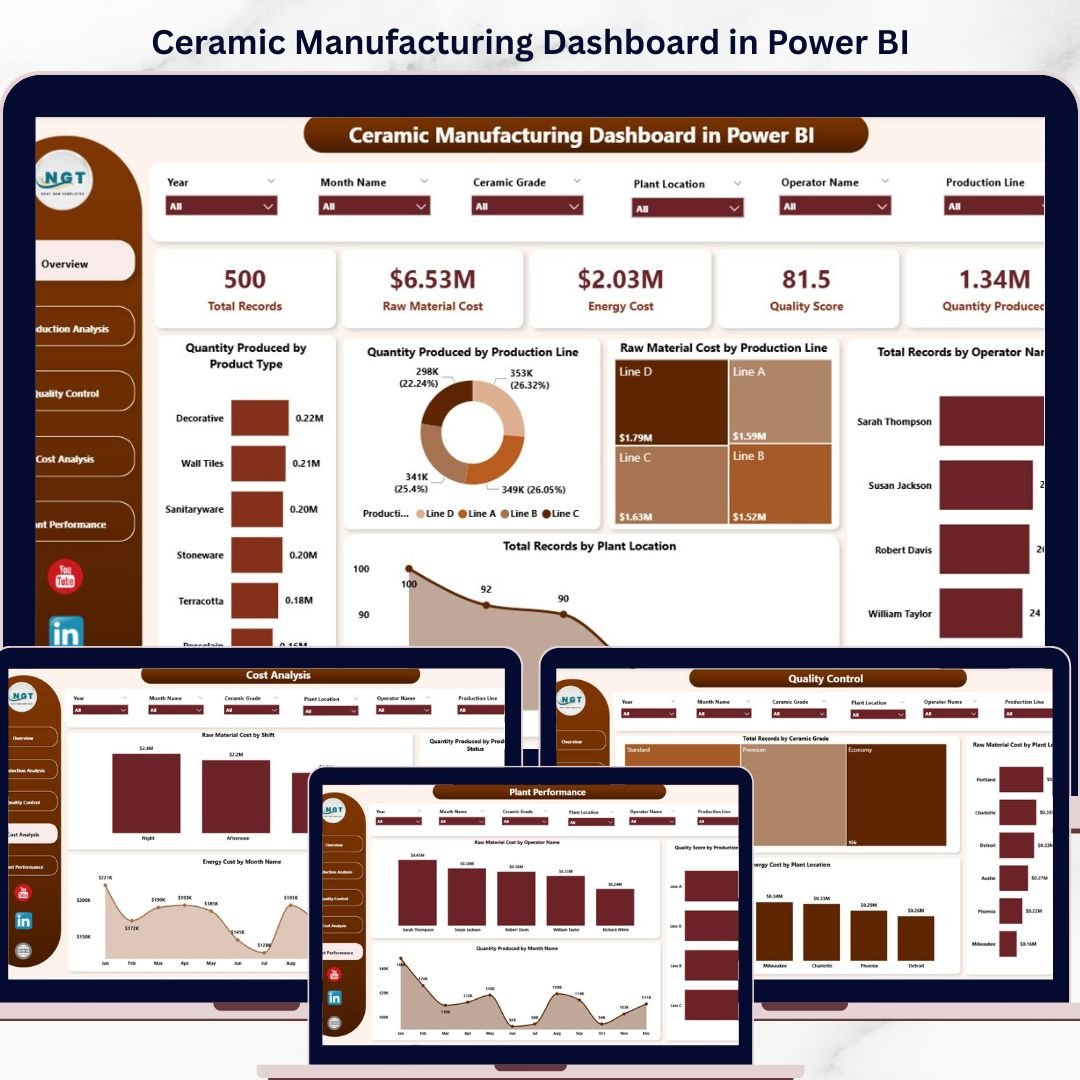
The Ceramic Manufacturing Dashboard in Power BI is a strong fit for plant managers who want interactive production analysis instead of a static spreadsheet summary. It is built around the core realities of ceramic manufacturing: quantity produced, defective units, quality score, raw material cost, energy cost, operators, shifts, product type, and plant performance. At $17.99, it gives teams a ready-made Power BI model that can be refreshed as new data is loaded.
Screenshot section: The product screenshots show a multi-page Power BI report with Overview, Production Analysis, Quality Control, Cost Analysis, and Plant Performance views. That structure is helpful when one stakeholder wants a fast KPI readout while another needs to investigate cost or quality issues by plant, operator, product, or month.
- Use it to compare output and quality across ceramic plants.
- Use it to monitor raw material and energy cost movement.
- Use it to identify operator or shift patterns behind defects.
- Use it to present a cleaner plant efficiency story in leadership reviews.
View the Power BI template – $17.99
Ceramic Manufacturing Dashboard in Excel
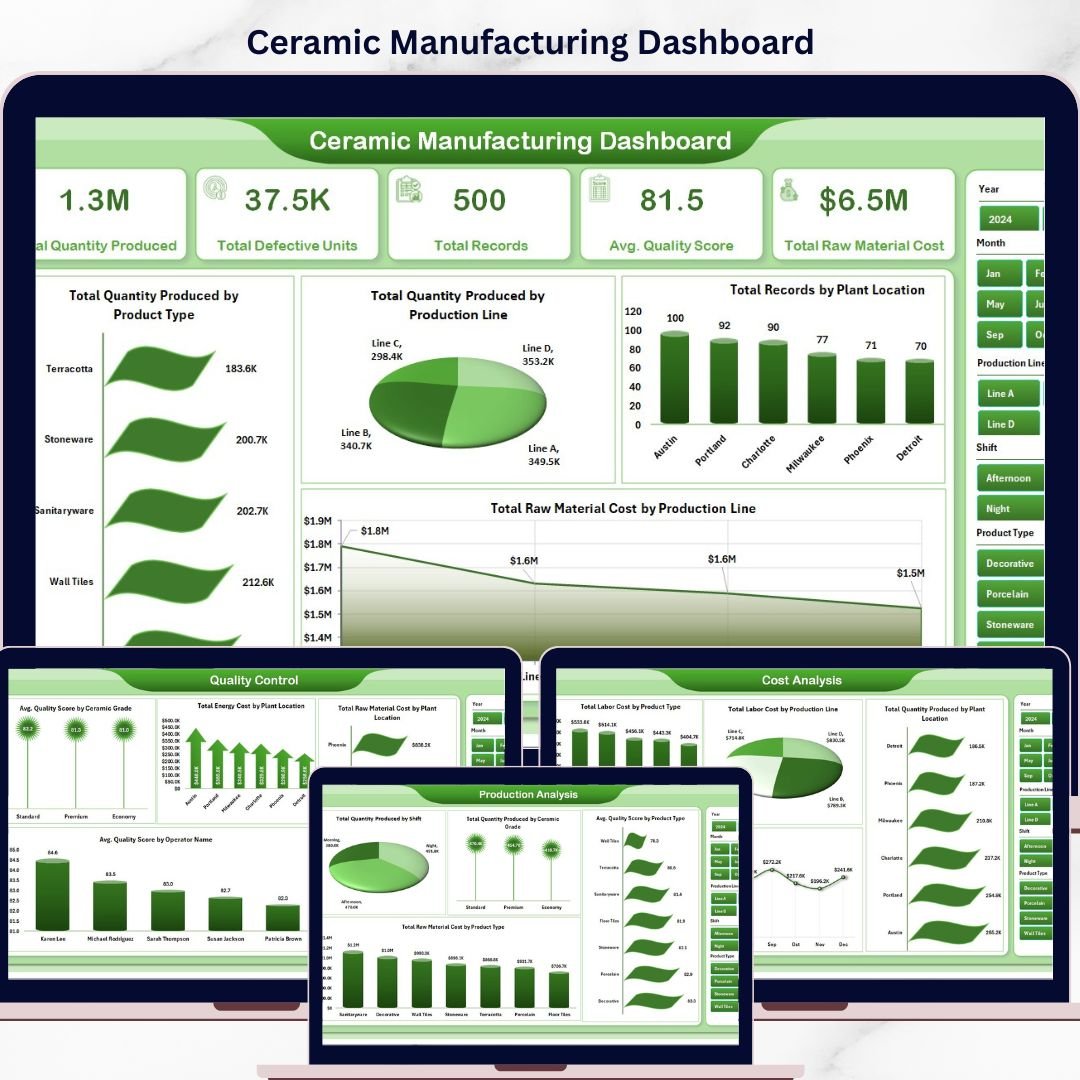
The Ceramic Manufacturing Dashboard in Excel is the spreadsheet-friendly version for factories that still rely on Excel exports, shift files, and plant-level workbooks. It costs $17.99 and focuses on the same operating questions as the Power BI version: What did we produce, where did defects rise, which costs changed, and which plant or line needs attention first?
Screenshot section: The screenshot set shows seven structured dashboard components, including overview, production analysis, quality control, cost analysis, plant performance, data sheet, and support sheet. The data sheet and support sheet are especially useful for teams that want the dashboard to update through familiar Excel workflows rather than a BI service.
- Use it as an OEE dashboard Excel starting point by adding availability, performance, and quality fields to the data sheet.
- Use it for ceramic production variance reviews against planned quantity or expected cost.
- Use it for monthly cost analysis by raw material, labor, and energy.
- Use it in plants where supervisors are more comfortable with Excel than Power BI.
View the Excel template – $17.99
Battery Manufacturing Dashboard in Power BI
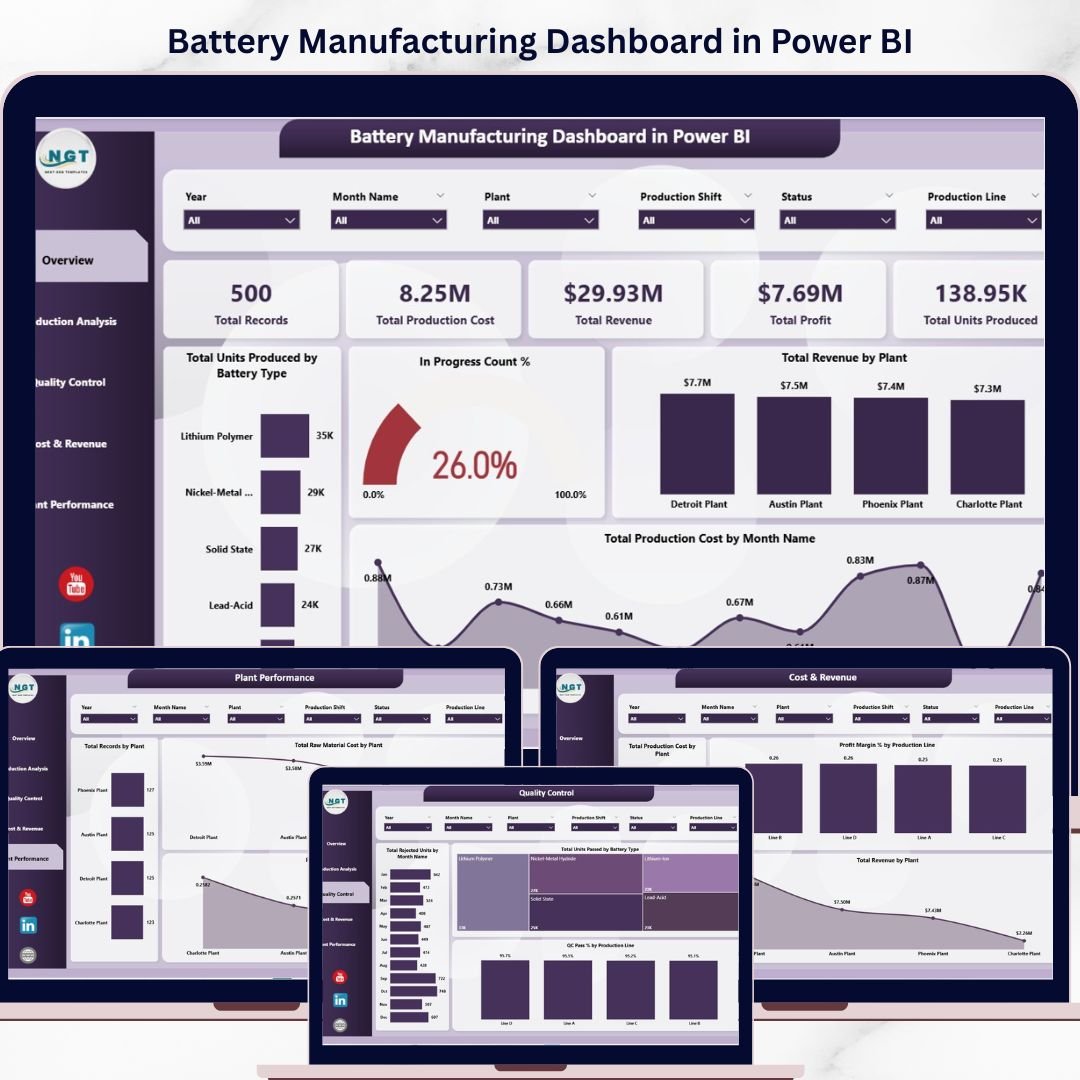
The Battery Manufacturing Dashboard in Power BI is built for battery producers who need to monitor production output, cost, revenue, profit, rejected units, QC pass rates, plant performance, and production line trends in one report. For $17.99, it gives operations and business analysts a Power BI file that can support recurring production meetings, cost reviews, and line performance discussions.
Screenshot section: The screenshots show five report pages plus a support tab: Overview, Production Analysis, Quality Control, Cost and Revenue, and Plant Performance. That coverage matters in battery manufacturing because small changes in scrap, rework, line yield, or quality pass rate can quickly affect margin and delivery reliability.
- Use it to compare battery production performance by plant, shift, line, and battery type.
- Use it to monitor rejected units and QC pass-rate trends.
- Use it to connect production output with cost, revenue, and profit.
- Use it to create a Power BI production dashboard for weekly leadership reviews.
View the Power BI template – $17.99
Battery Manufacturing Dashboard in Excel
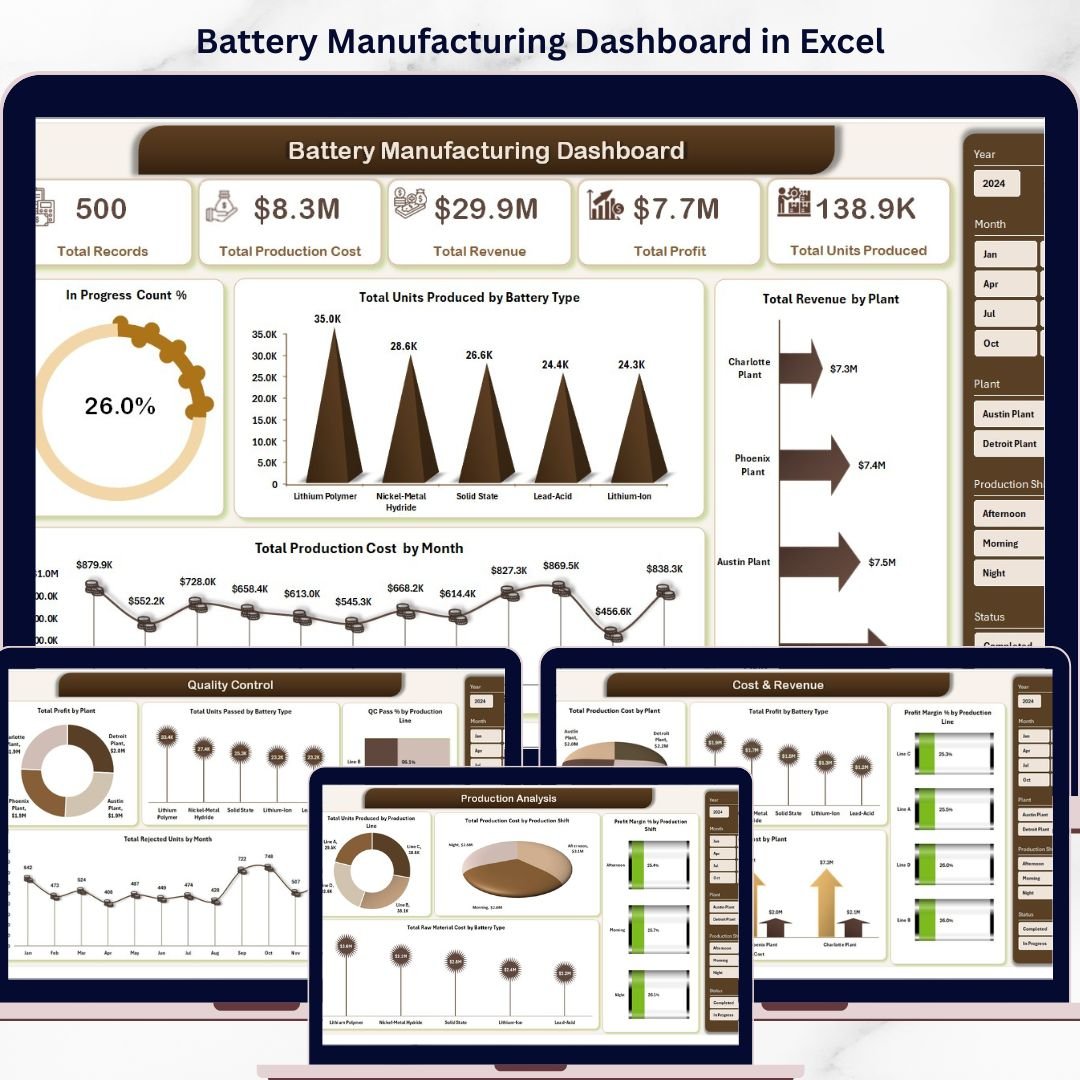
The Battery Manufacturing Dashboard in Excel is the better choice when your team wants quick spreadsheet adoption and does not need a published Power BI workspace. At $13.99, it gives production supervisors, analysts, and plant managers a practical Excel dashboard for tracking battery production cost, revenue, profit, units produced, QC pass rates, rejected units, and plant performance.
Screenshot section: The screenshots show seven structured sheets, including overview, production analysis, quality control, cost and revenue analysis, plant performance, data sheet, and support sheet. The data sheet makes it easier to replace sample data with actual production records, while support sheets help maintain pivot-driven reporting.
- Use it to run daily battery production performance reviews in Excel.
- Use it to analyze production variance between expected and actual output.
- Use it to track quality losses before they become customer-impacting issues.
- Use it as a lower-cost alternative when your team is not ready for Power BI.
View the Excel template – $13.99
Need one plant dashboard your team can use this week?
Start with the format your team already trusts. Choose Excel if supervisors update the file directly, or choose Power BI if you want interactive filters, published reports, and easier multi-plant review.
Manufacturing Production Calendar in Excel
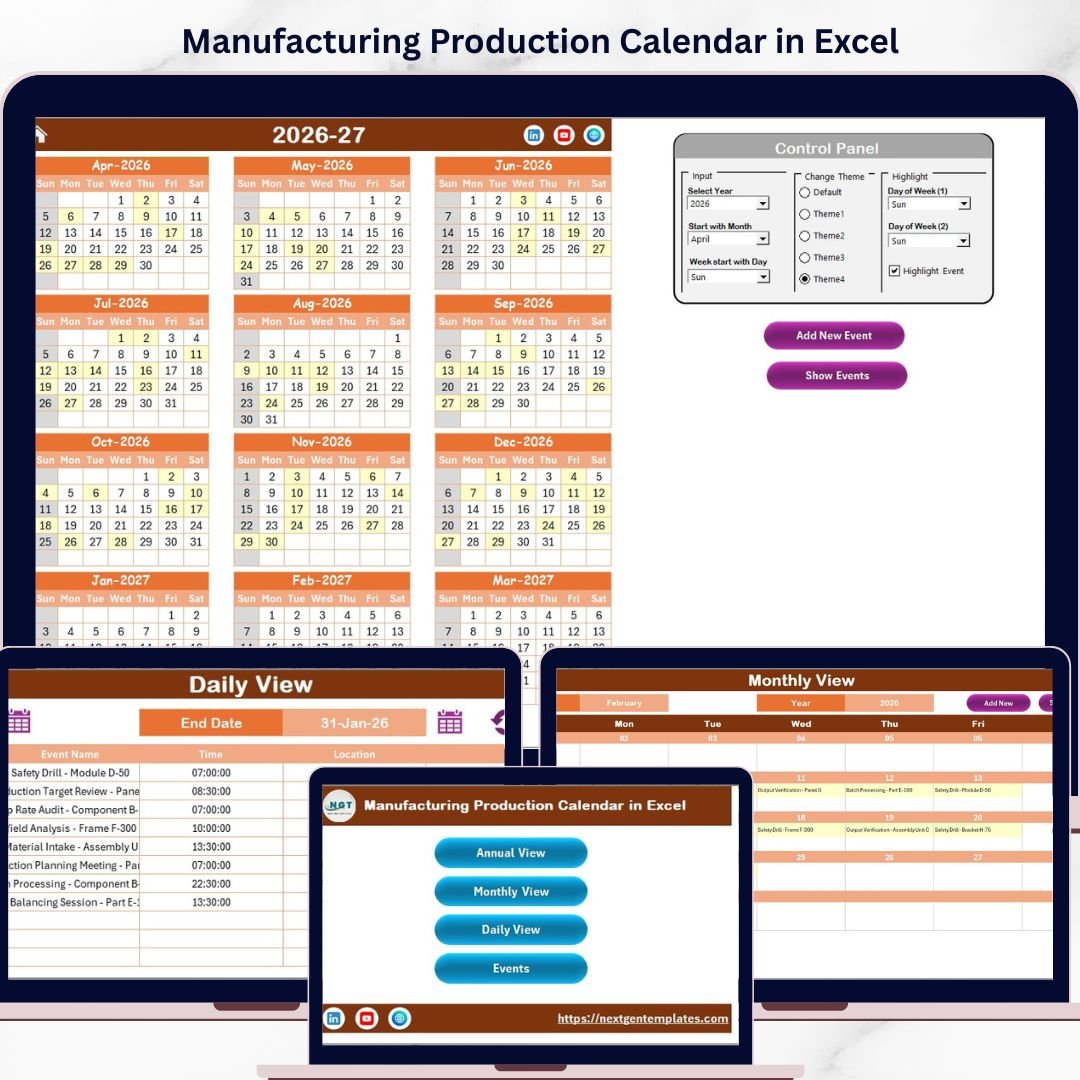
The Manufacturing Production Calendar in Excel is not a dashboard in the strict KPI sense, but it belongs in this roundup because plant efficiency often breaks down before production even starts. At $4.99, this calendar helps teams coordinate production events, maintenance windows, schedule changes, and important planning dates in one Excel file.
Screenshot section: The product images show annual, monthly, daily, and event-management views. The template includes Home, Annual View, Monthly View, Daily View, and Events sheets, with controls for year, start month, starting weekday, color themes, highlighted days, and event details. That makes it useful for scheduling the work that feeds the production dashboard.
- Use it to map planned production runs, shutdowns, and special events.
- Use it to coordinate maintenance days with production commitments.
- Use it to keep shift teams aligned on calendar changes.
- Use it to reduce schedule confusion before it becomes downtime.
View the calendar template – $4.99
Automotive Parts Manufacturing Dashboard in Power BI
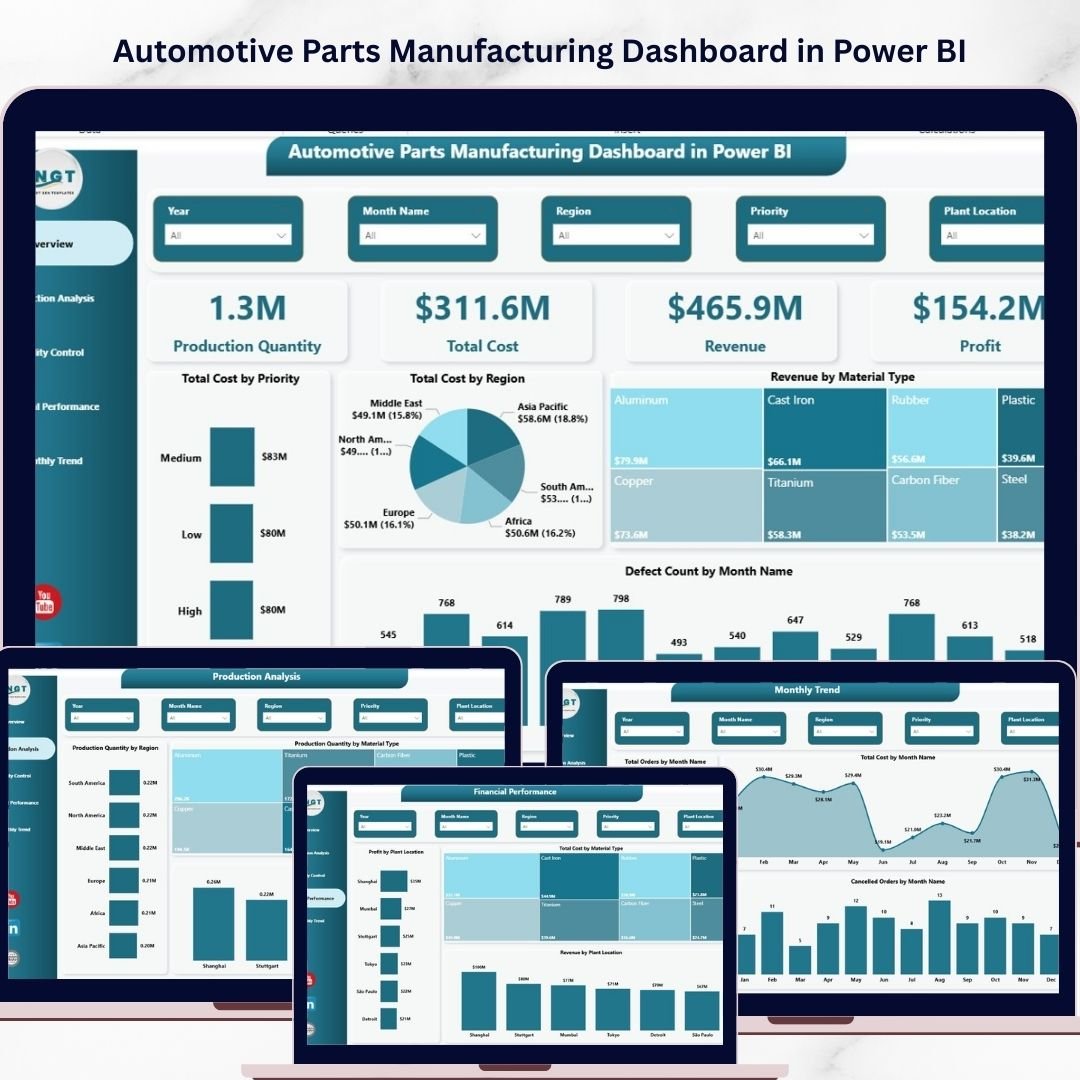
The Automotive Parts Manufacturing Dashboard in Power BI is designed for automotive parts operations where defects, delayed orders, cost, revenue, and monthly trends all matter. At $17.99, it is a practical Power BI template for teams that need to break down production quantity by material type, region, plant, and part category while also tracking quality and financial performance.
Screenshot section: The product screenshots show a multi-page report covering Overview, Production Analysis, Quality Control, Financial Performance, and Monthly Trend pages. Those pages help plant managers move from a high-level production dashboard into the root areas that affect efficiency: defect count, delayed orders, safety incidents, total cost, revenue, and lead time.
- Use it to compare production quantity by plant location and material type.
- Use it to monitor defects, delayed orders, and safety incidents.
- Use it to connect manufacturing performance with revenue and cost.
- Use it to create a polished Power BI report for automotive operations reviews.
View the Power BI template – $17.99
Manufacturing Planning Checklist in Excel
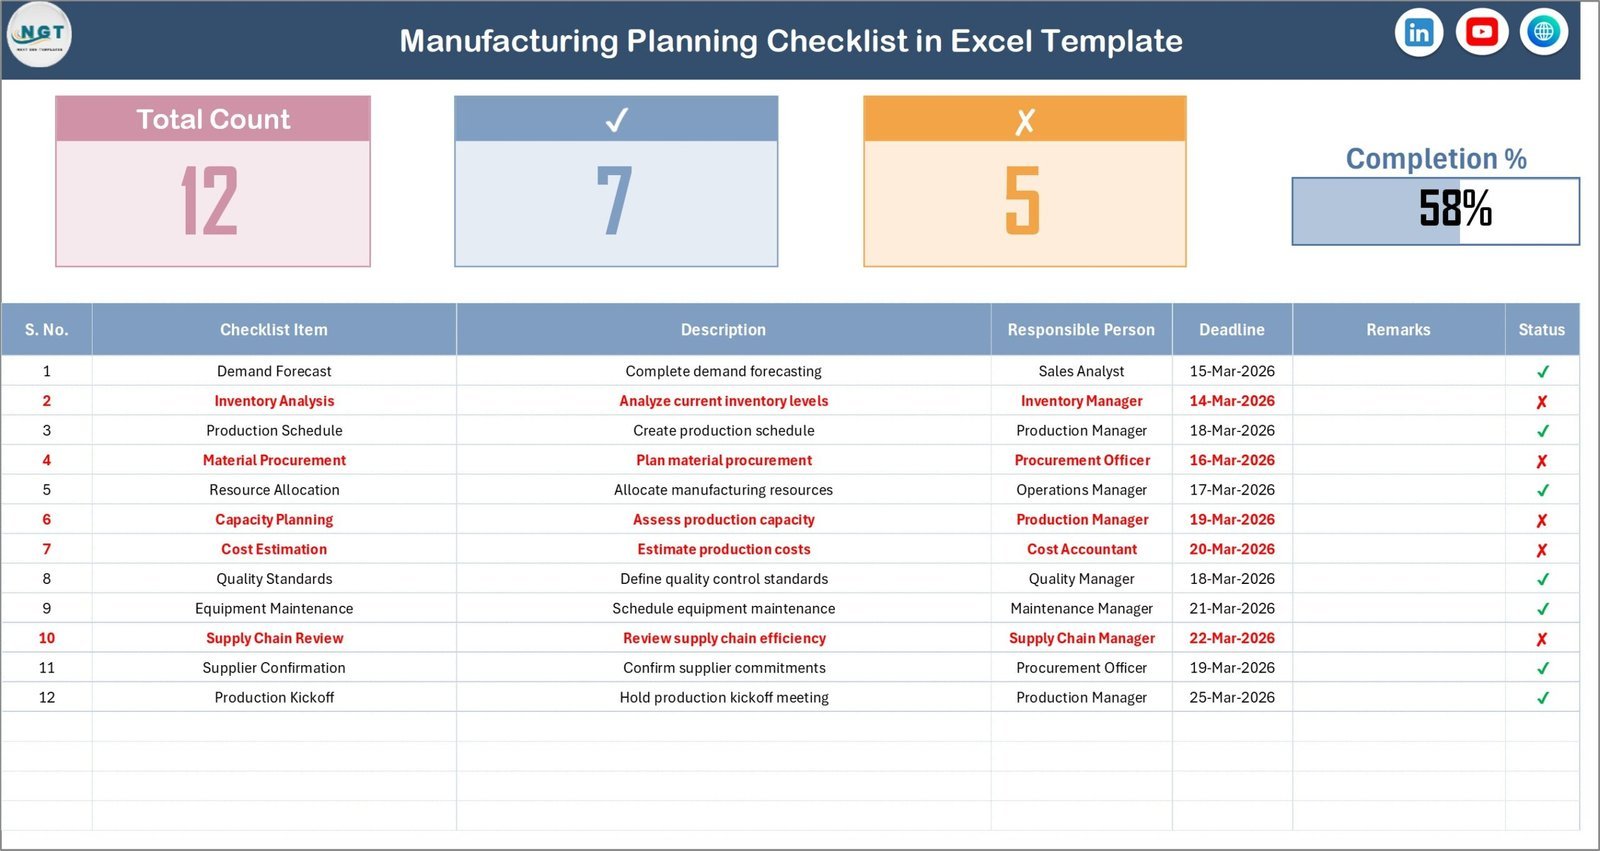
The Manufacturing Planning Checklist in Excel is the lowest-priced tool in this roundup at $1.99, but it solves a very real plant problem: accountability. Dashboards show what happened. Checklists help teams prevent missed tasks, unclear ownership, and late readiness steps before those issues show up as downtime, scrap, or schedule slippage.
Screenshot section: The screenshots show a checklist sheet with KPI counts, checked items, crossed items, progress tracking, responsible person assignment, deadlines, remarks, and task status. It also includes a list sheet for responsible-person dropdowns. That makes it useful for standard work, daily readiness checks, changeover planning, and pre-production task control.
- Use it to assign production planning tasks before a run starts.
- Use it to track open items by responsible person and deadline.
- Use it to add structure to shift handoffs and readiness meetings.
- Use it with a dashboard to explain why a KPI moved, not just that it moved.
View the checklist template – $1.99
Automotive Parts Manufacturing Dashboard in Excel
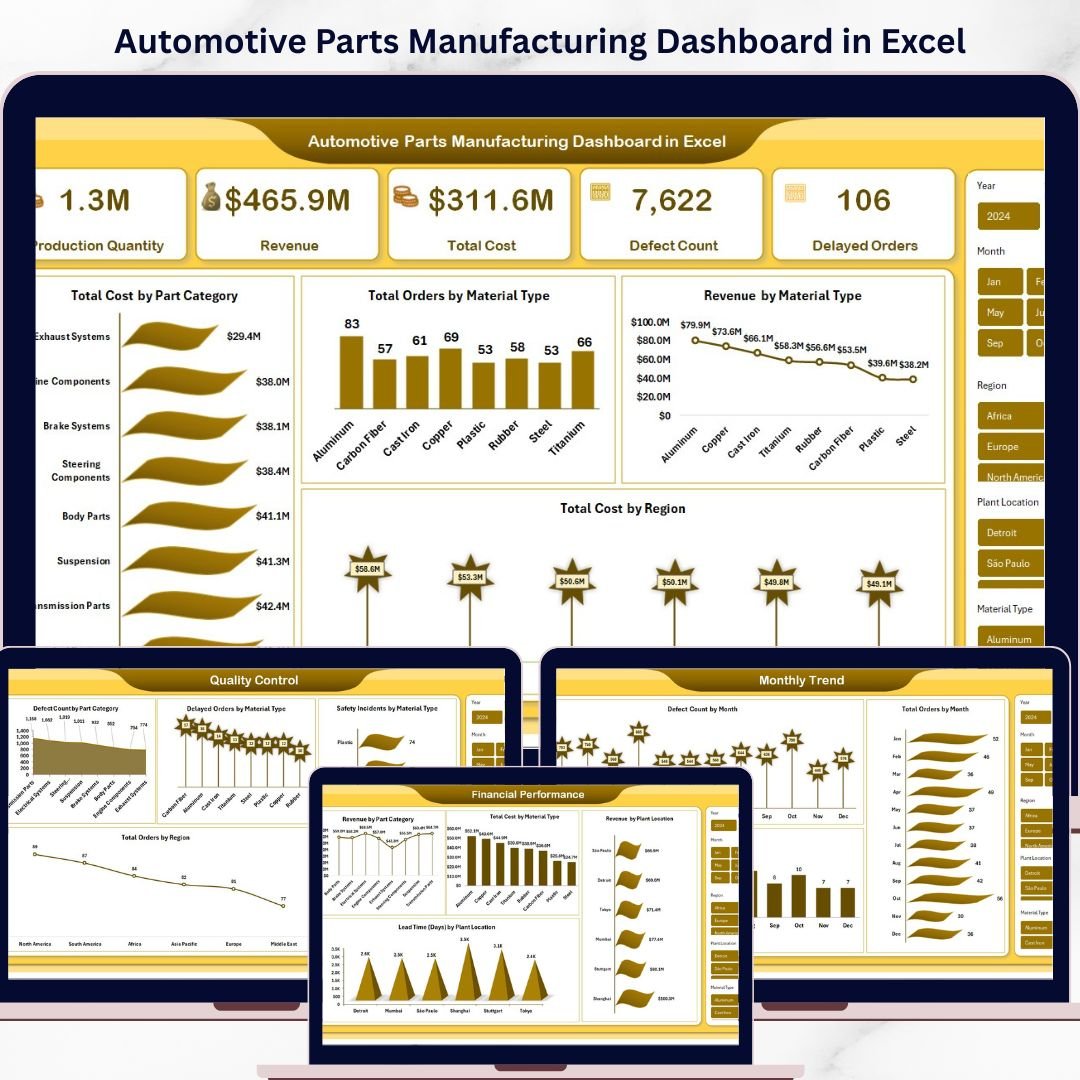
The Automotive Parts Manufacturing Dashboard in Excel gives automotive teams a spreadsheet-based way to review production quantity, revenue, total cost, defect count, delayed orders, safety incidents, lead time, and monthly trends. At $13.99, it is especially useful for plants that need production variance reporting but still operate from Excel exports rather than a shared BI model.
Screenshot section: The screenshot set shows a main overview plus analysis pages for production, quality control, financial performance, and monthly trends. The layout is practical for plant meetings because it lets managers start with KPI cards, then move into production quantity by category, material, region, and plant location.
- Use it to track production variance by plant, part category, and material type.
- Use it to watch defect count, safety incidents, and delayed orders together.
- Use it to review total cost, revenue, and lead time in the same file.
- Use it as the Excel alternative to the automotive Power BI template.
View the Excel template – $13.99
If you manage the whole site rather than one plant dashboard, see our operations manager tools stack: eight Excel, Google Sheets and Power BI templates for planning, maintenance, quality and weekly KPI reporting.
Want the whole toolkit rather than one dashboard? Our plant manager dashboard Excel template stack groups ten tools by the job they do (plan, track, report, present) and adds a 30-day rollout plan.
How to Choose the Right Production Dashboard Template
Start with the decision your plant needs to make, not with the software format. A manufacturing dashboard should reduce the time between a production problem and a management response. Use this framework:
- Choose Power BI for multi-plant visibility. If you want slicers, published reports, refresh workflows, or executive dashboards, pick one of the Power BI templates.
- Choose Excel for supervisor-owned reporting. If the same people who run the line also update the file, Excel is usually faster to adopt.
- Choose a specialized dashboard for industry-specific KPIs. Ceramic, battery, and automotive dashboards include more relevant dimensions than a generic production dashboard.
- Choose the calendar or checklist for planning control. If downtime is caused by missed tasks or poor scheduling, a checklist or production calendar may improve efficiency before a KPI dashboard does.
- Choose scorecards when leadership wants target-versus-actual variance. A dashboard explains performance; a scorecard grades it. Pair these templates with a variance-focused Excel process when monthly operations reviews need red, amber, and green status.
For consultants and operations leaders who need multiple formats, the Consultant’s Toolkit with Excel and Power BI dashboards can be a better bundle option than buying unrelated templates one by one.
Before you pick a dashboard, get the measurement right: our guide to the 10 OEE & downtime metrics and the OEE calculation Excel formulas gives you the exact formula and benchmark for every metric these dashboards track.
Manufacturing Dashboard FAQ
What is a manufacturing dashboard?
A manufacturing dashboard is a visual reporting tool that tracks production KPIs such as output, downtime, scrap, defects, quality score, cost, lead time, schedule adherence, and plant efficiency. The goal is to help plant managers see performance quickly and take action before small issues become larger production losses.
What should a production dashboard include?
A strong production dashboard should include total output, planned vs actual production, defect count, scrap rate, downtime, quality pass rate, cost by line or product, shift performance, plant comparison, and monthly trends. More advanced dashboards also include filters by product type, operator, plant, production line, and month.
Is Excel enough for an OEE dashboard?
Excel can be enough for an OEE dashboard when the plant has a manageable number of lines and a team that already maintains production data in spreadsheets. Add availability, performance, and quality fields to an Excel manufacturing dashboard, then calculate OEE as availability x performance x quality.
When should I use Power BI instead of Excel?
Use Power BI when you need interactive drilldowns, easier multi-plant reporting, published dashboards, scheduled refreshes, stronger data modeling, or access control. Use Excel when you need a quick, editable file that supervisors can update directly without setting up a BI workspace.
Which template is best for tracking scrap and defects?
For ceramic production, choose the Ceramic Manufacturing Dashboard in Excel or Power BI. For battery plants, choose the Battery Manufacturing Dashboard in Excel or Power BI. For automotive parts, choose the Automotive Parts Manufacturing Dashboard in Excel or Power BI because those templates include defect, delayed order, and quality-control views.
Can these templates replace a manufacturing execution system?
No. These templates are reporting and analysis tools, not a full manufacturing execution system. They do not replace machine integration, operator workflows, shop-floor dispatching, or automated data capture. They are best used as an affordable reporting layer for teams that already have production data exports.
How do I track production variance in Excel?
To track production variance in Excel, keep planned quantity, actual quantity, planned cost, actual cost, standard labor, actual labor, and scrap quantity in the data sheet. Then calculate variance as actual minus plan and show the result by product, line, shift, and month. The automotive and battery Excel dashboards are good starting points.
What KPIs matter most for plant efficiency?
The most useful plant efficiency KPIs are OEE, units produced, downtime hours, scrap rate, defect count, quality pass rate, schedule adherence, cost per unit, labor efficiency, and on-time delivery. For leadership, combine these into a small set of KPI cards and trend charts rather than a long spreadsheet of raw measures.
How often should a manufacturing dashboard be updated?
Daily updates are enough for many plant management routines, while high-volume environments may refresh each shift. Monthly trend pages should also be preserved so managers can compare current performance against prior months and identify recurring problems.
Which template should a small manufacturer buy first?
If you are a small manufacturer and your team works mostly in spreadsheets, start with the Excel dashboard that matches your industry. If you manage multiple plants or want interactive executive reporting, start with the matching Power BI dashboard. If planning discipline is the problem, start with the Manufacturing Planning Checklist or Manufacturing Production Calendar.
Final Recommendation for Plant Efficiency
Build the dashboard stack around your actual reporting workflow.
If your plant is Excel-first, buy the Excel version and make it the source of truth for production variance, scrap, and daily output. If your company is moving toward shared analytics, buy the Power BI version and connect it to your plant data model. Either path is far cheaper than waiting for a custom dashboard build before you can see the basics.
Built by PK – Microsoft Certified Professional with 15+ years of Excel, Google Sheets, and Power BI experience. Founder of NextGenTemplates, reaching 300K+ subscribers across YouTube channels. Every template is hand-built and tested before release.
For step-by-step dashboard tutorials, visit the NextGenTemplates YouTube channel.
If you are working to a tight budget, compare these with our roundup of affordable Power BI templates under $20.
Working in pharma specifically? See our focused roundup of the 8 best pharmaceutical manufacturing templates, ranked across Excel, Sheets and Power BI with prices from $9.99.