

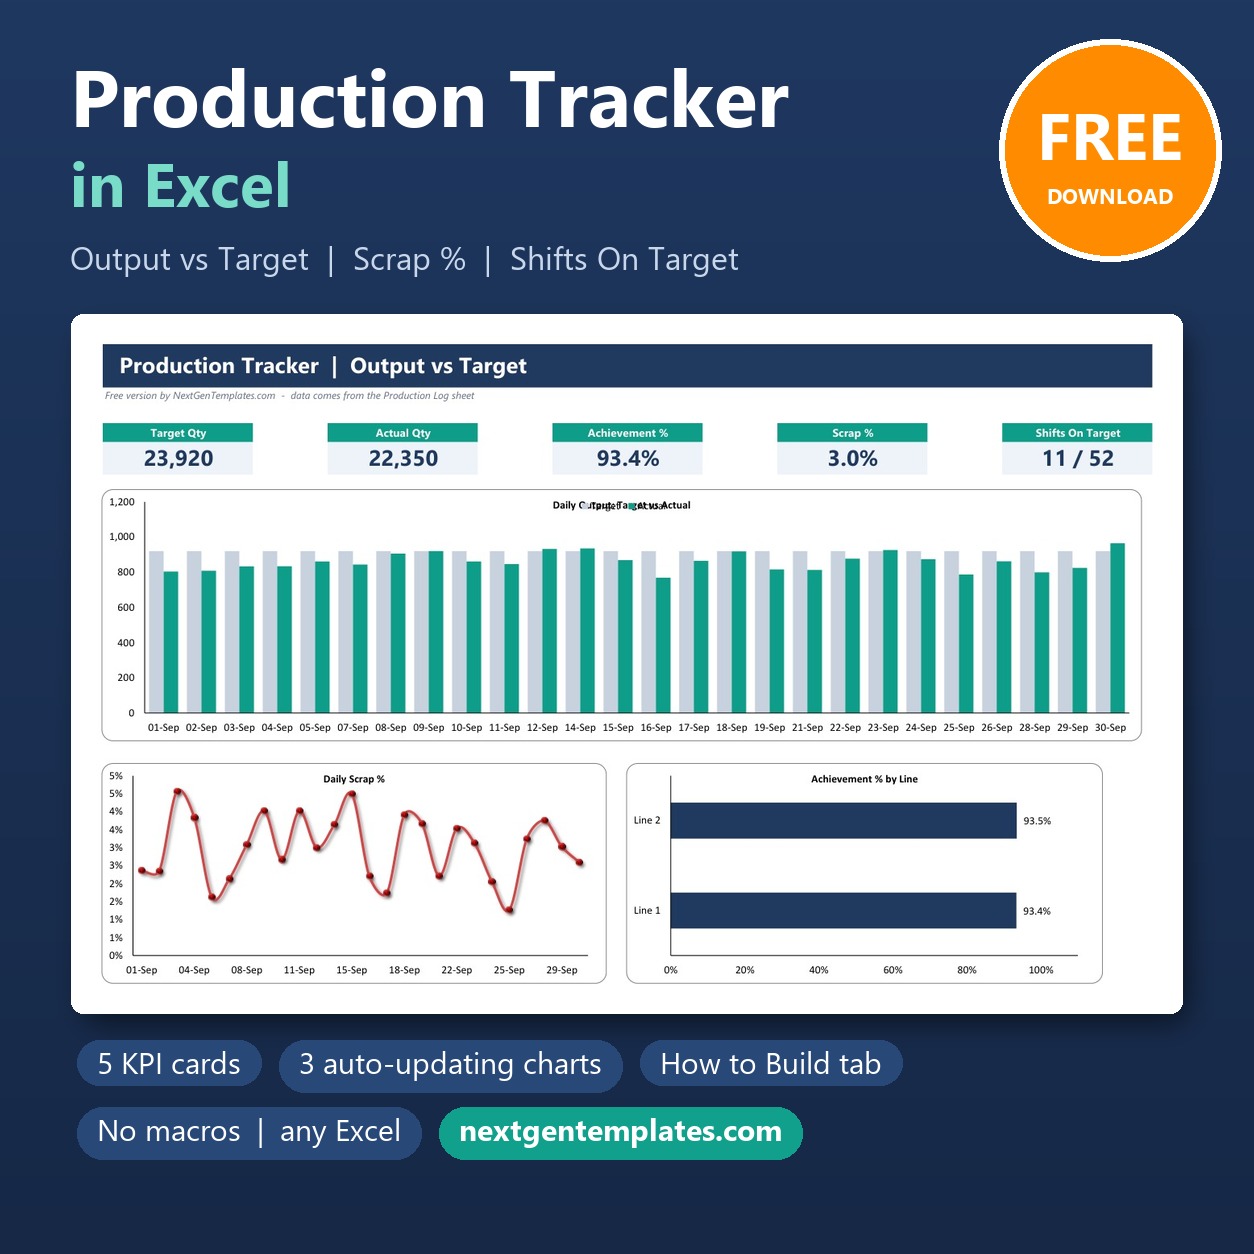
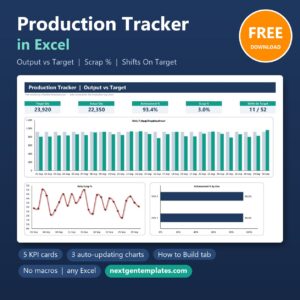
The Production Tracker in Excel is a free workbook that turns a simple shift log into an output vs target dashboard. It comes with 4 sheets, 5 KPI cards, 3 auto-updating charts and a 32-step How to Build guide, plus 52 sample shift entries covering September 2026 so you can see every formula working before you type your own data.
📥 It is a free download: no payment, no macros, no add-ins. Open the .xlsx in Microsoft Excel, clear the sample rows on the Production Log and start logging your own shifts the same day.
✅ Free download · Plain .xlsx · No macros · Instant access
🎥 Watch the Video Tutorial
In this 11-minute tutorial PK builds this tracker step by step: the calculated columns, dropdowns and status colours, the 5 KPI cards, the SUMIFS helper tables and the 3 charts.
🔑 Key Features of the Production Tracker in Excel
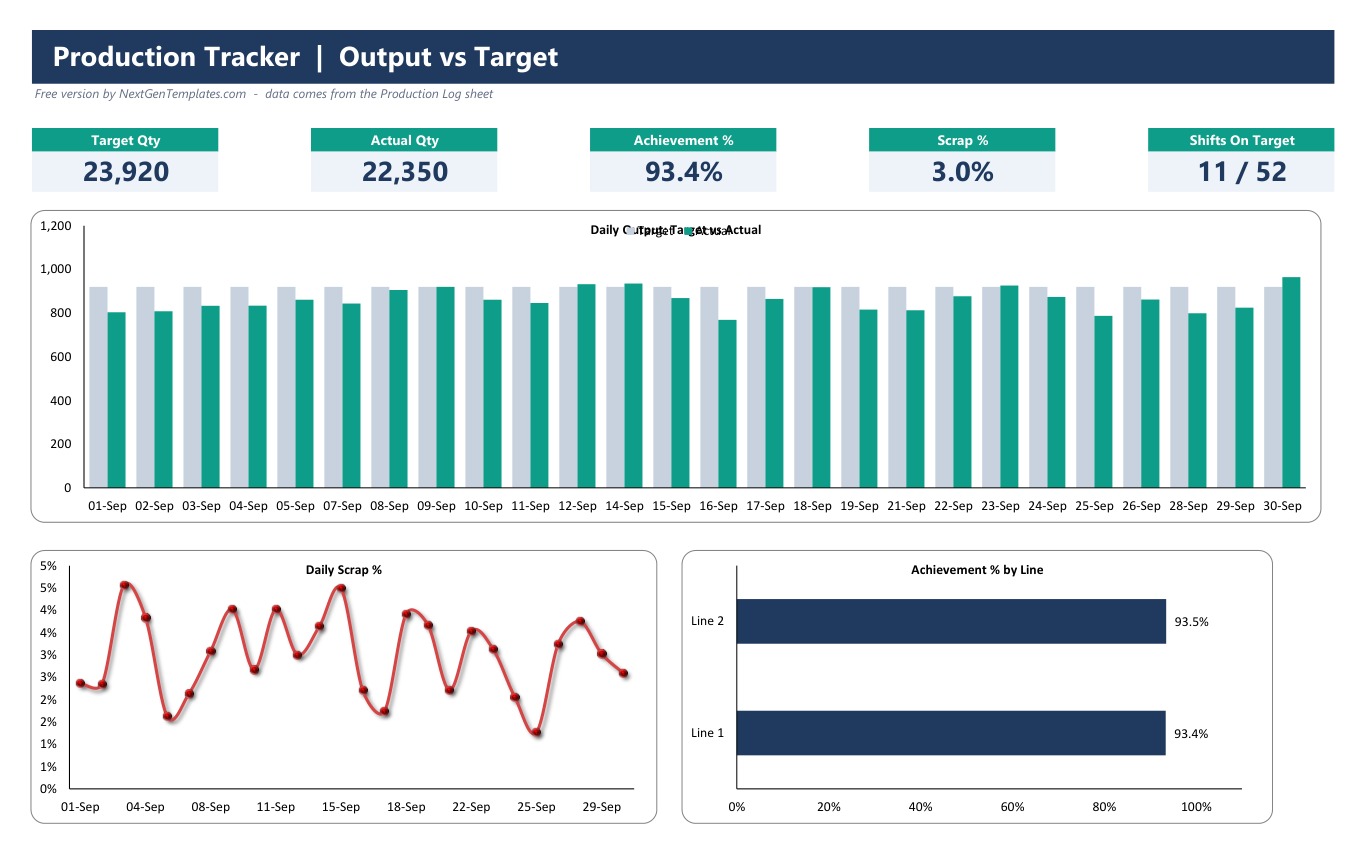
🎯 Output vs target KPI cards. The Dashboard shows five KPI cards: Target Qty, Actual Qty, Achievement %, Scrap % and Shifts On Target. With the sample data they read 23,920 target, 22,350 actual, 93.4% achievement, 3.0% scrap and 11 of 52 shifts on target.
📊 Three charts that update themselves. Daily Output: Target vs Actual, Daily Scrap % and Achievement % by Line all read from small helper tables, so a new row on the Production Log flows straight into the charts.
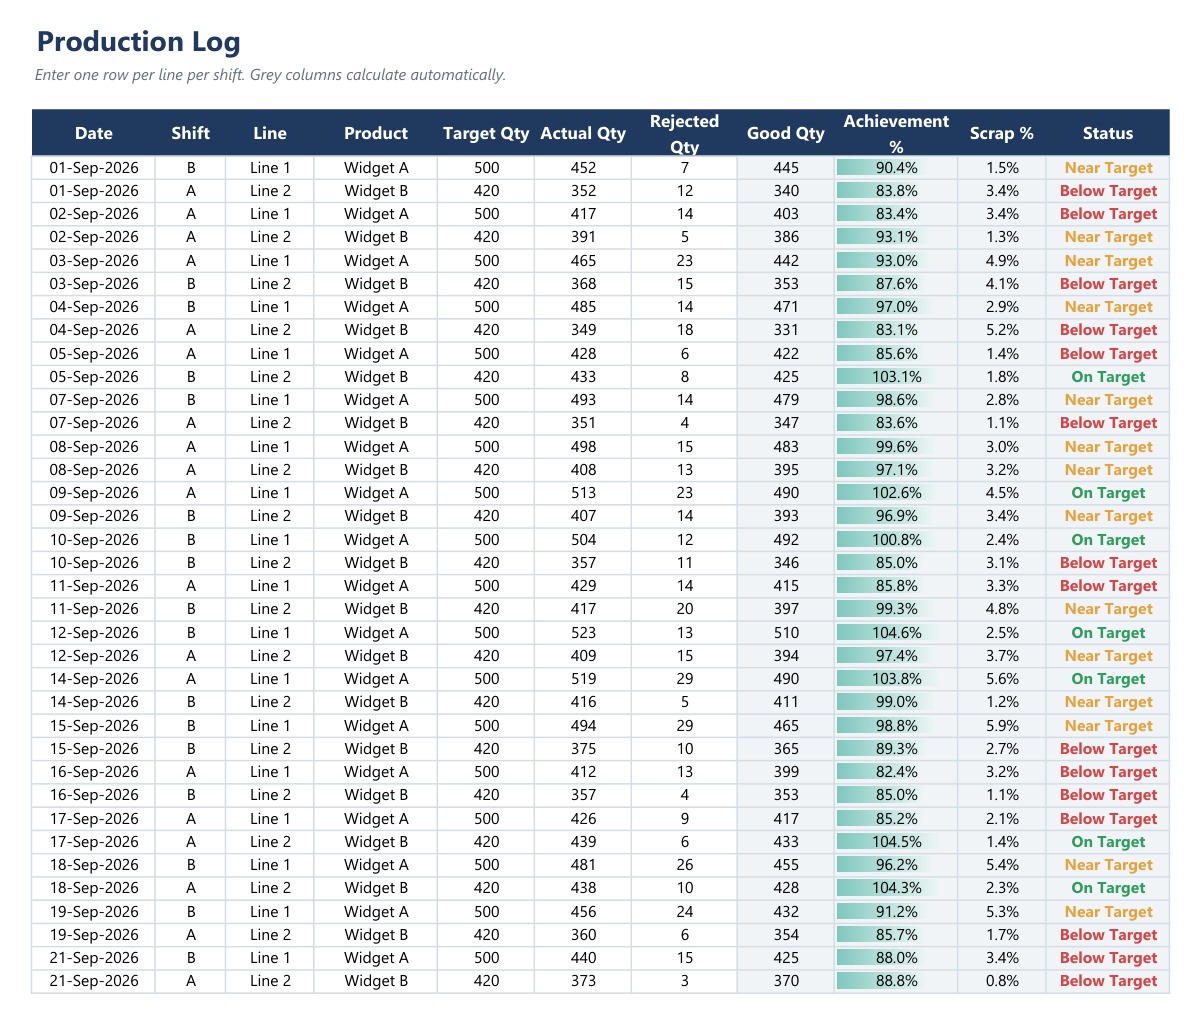
📝 A clean daily production report format in Excel. The Production Log records Date, Shift, Line, Product, Target Qty, Actual Qty and Rejected Qty. Good Qty, Achievement %, Scrap % and Status are calculated for you, with formulas already filled down to row 116.
🚦 Automatic status labels. Every shift is tagged On Target (100% or more of target), Near Target (90% to 99.9%) or Below Target (under 90%), and the Status column is colour coded green, amber and red.
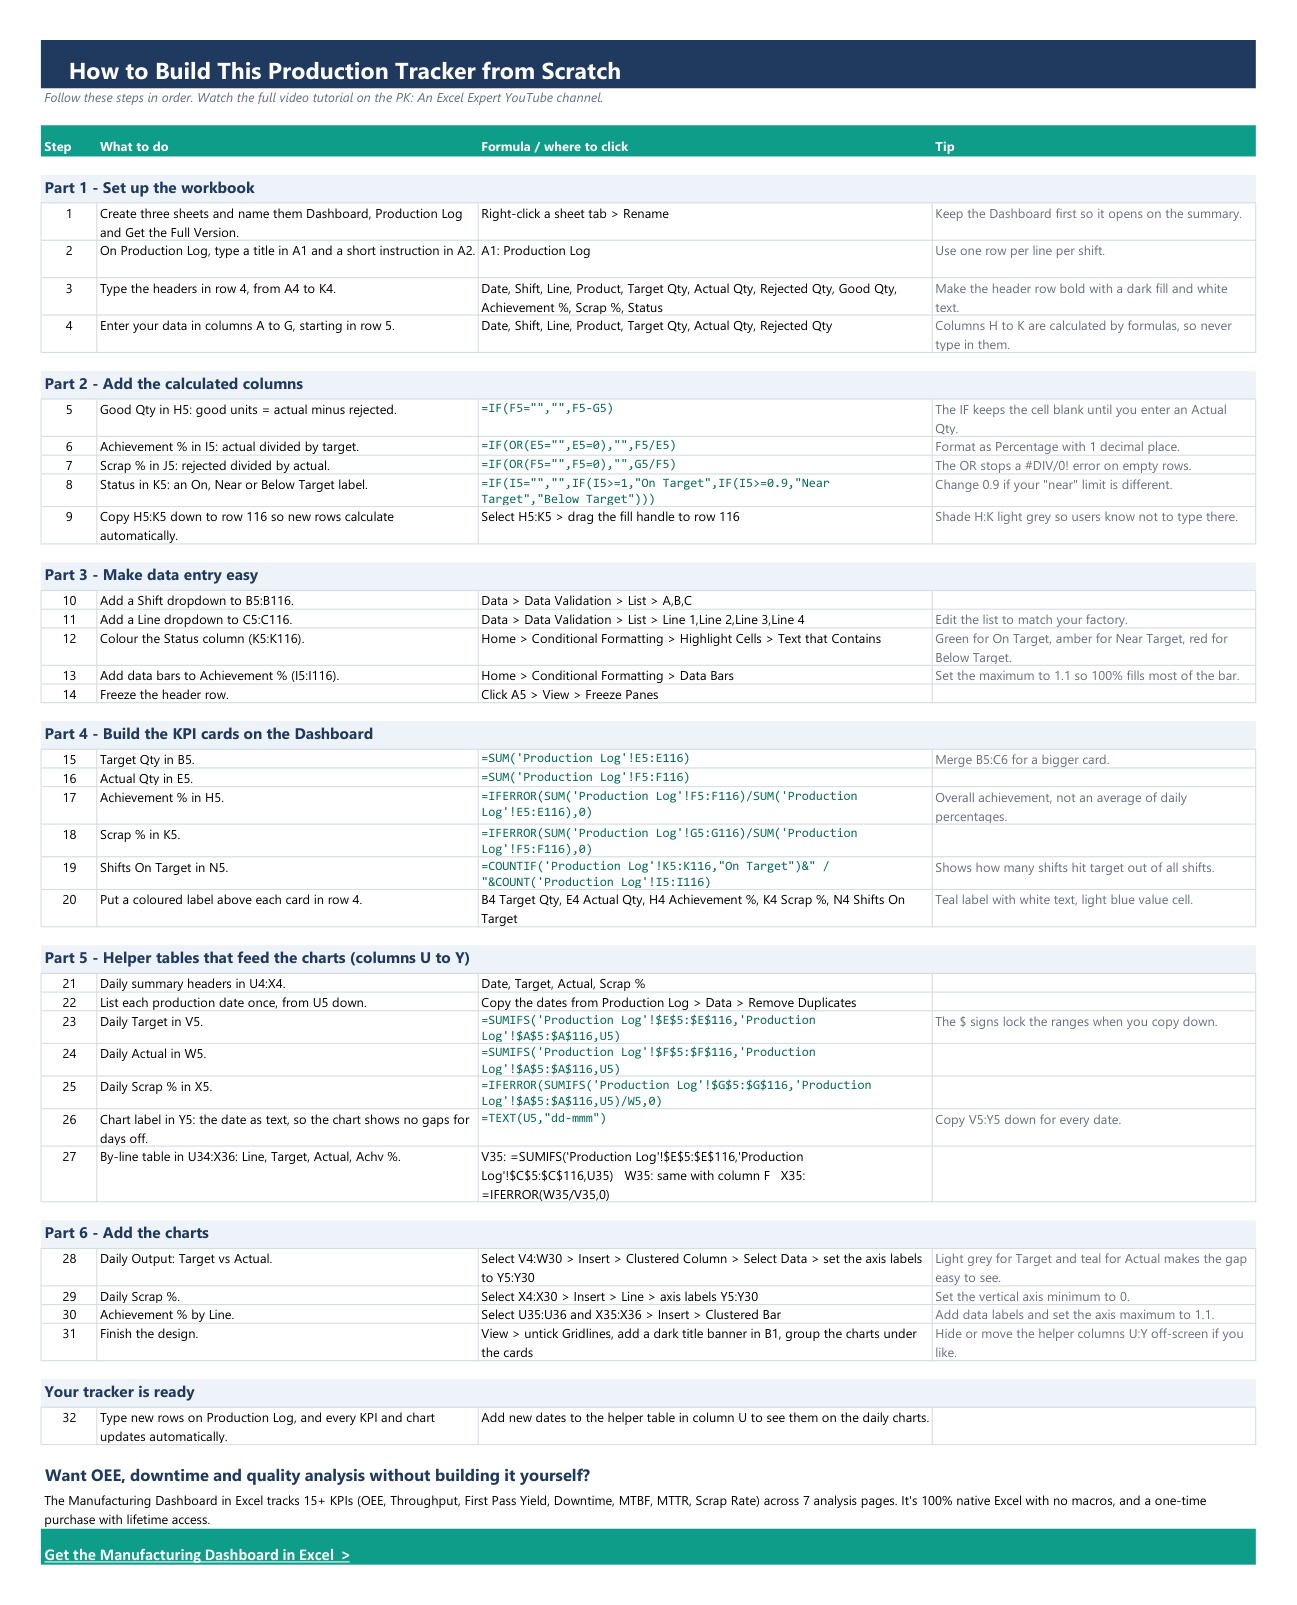
🧑🏫 Learn it, do not just use it. The How to Build sheet lists all 32 steps used to make this excel production tracking template, with the exact formula or menu path for each one, so you can rebuild or extend it yourself.
📦 What’s Inside the Production Tracker in Excel
The download is one Excel workbook with four sheets. Here is what each one does.
Sheet 1: Dashboard
The summary page. Five KPI cards across the top, the Daily Output: Target vs Actual column chart in the middle, and Daily Scrap % and Achievement % by Line underneath. In the sample, Line 1 runs at 93.4% and Line 2 at 93.5% of target.
Sheet 2: Production Log
This is the production tracking spreadsheet you fill in: one row per line per shift. Shift and Line have dropdowns, Achievement % has data bars, and the grey columns H to K calculate automatically so nobody types over a formula.
Sheet 3: How to Build
A step-by-step build guide in six parts: set up the workbook, add the calculated columns, make data entry easy, build the KPI cards, build the helper tables, and add the charts. Every formula is written out in full, for example =IF(OR(E5="",E5=0),"",F5/E5) for Achievement %.
Sheet 4: Get the Full Version
A short page explaining what the paid Manufacturing Dashboard in Excel adds on top of this free tracker.
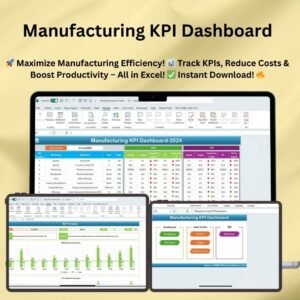
🚀 Need More Than Output vs Target? Get the Manufacturing Dashboard in Excel
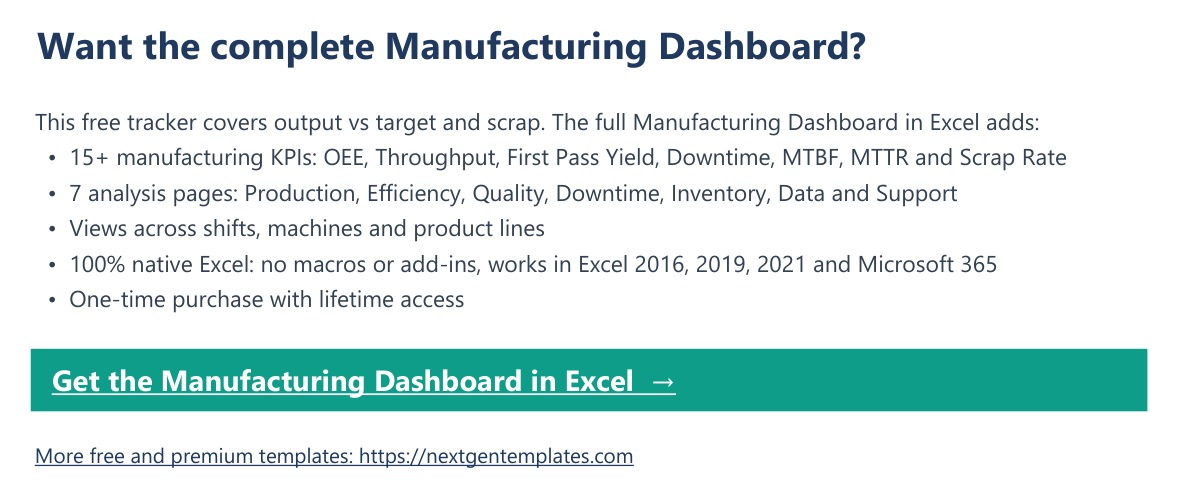
This free tracker answers one question well: did each line hit its target, and how much did we scrap? When you also need to know why output was lost, upgrade to the Manufacturing Dashboard in Excel:
- 📈 15+ manufacturing KPIs: OEE, Throughput, First Pass Yield, Downtime, MTBF, MTTR and Scrap Rate
- 🗂️ 7 analysis pages: Production, Efficiency, Quality, Downtime, Inventory, Data and Support
- 🏭 Views across shifts, machines and product lines
- 🔒 100% native Excel: no macros or add-ins, works in Excel 2016, 2019, 2021 and Microsoft 365
- 💳 One-time purchase with lifetime access
👉 Get the Manufacturing Dashboard in Excel
📊 Production Tracker in Excel vs. Manufacturing Dashboard vs. Paid Production Software
| Feature | Production Tracker in Excel | Manufacturing Dashboard in Excel | Paid MES / production software |
|---|---|---|---|
| Cost | ✅ Free | One-time purchase | Monthly subscription, often per user |
| Platform | ✅ Microsoft Excel (.xlsx) | Microsoft Excel | Web app, vendor hosted |
| Setup time | ✅ Minutes: clear the sample rows and type | Replace the sample data | Onboarding and configuration project |
| Macros or add-ins | ✅ None | ✅ None | Not applicable |
| Output vs target and scrap % | ✅ Yes | ✅ Yes | ✅ Yes |
| OEE, MTBF, MTTR, downtime analysis | No | ✅ Yes, 15+ KPIs | ✅ Usually |
| Learn-to-build guide with formulas | ✅ 32 steps | No | No |
| Live machine data feeds | No, manual entry | No, manual entry | ✅ Often |
| Year-1 cost at 5 users | ✅ Free | One-time price | Recurring licence fees |
Start with this free tracker; move to the Manufacturing Dashboard when you need OEE and downtime analysis; consider paid software only when you need live machine data.
👥 Who This Template Is For, and Who It’s Not For
✅ This free tracker is built for:
- Supervisors and shift leads who report daily output against target on two to four lines
- Small workshops replacing a paper or whiteboard production report
- Excel learners who want a real production tracker excel project with every formula explained
❌ It is NOT for:
- Plants that need OEE, MTBF, MTTR or downtime reasons (use the Manufacturing Dashboard in Excel)
- Teams that need live data from machines or an MES; this is manual entry
- Large logs: the formulas cover rows 5 to 116, and the daily chart table needs new dates added by hand
⚙️ How to Use This Free Tracker
- Download the zip, unzip it and open the workbook in Microsoft Excel.
- On Production Log, delete the sample values in columns A to G (leave H to K alone).
- Enter one row per line per shift: Date, Shift, Line, Product, Target Qty, Actual Qty, Rejected Qty.
- Edit the Line dropdown list to match your factory if you run more than Line 1 to Line 4.
- Add your production dates to the helper table in column U on the Dashboard so the daily charts pick them up.
- Open the Dashboard to read the KPI cards and charts.
💼 Real-World Use Cases
Ravi supervises two packing lines. At the end of each shift he logs target, actual and rejects. The Status column flags any shift under 90% of target, and he shares the Dashboard in the morning meeting instead of rewriting a paper report.
Maria runs a small furniture workshop. She uses the Production Log as her daily production report format in Excel and watches the Daily Scrap % chart to spot the days rework spikes.
Ankit is learning Excel for an operations role. He follows the How to Build sheet step by step, builds the tracker from a blank workbook, and then compares his version with the finished one.
❓ Frequently Asked Questions
Is the Production Tracker in Excel really free?
Yes. This tracker is a free download from NextGenTemplates. Add it to your cart, check out at zero cost and download the zip. There is no trial period and no locked features in the workbook.
Does this free tracker use macros?
No. It is a plain .xlsx file built only with formulas (SUM, SUMIFS, COUNTIF, IFERROR, TEXT), data validation, conditional formatting and standard charts, so there are no macros to enable.
How long does setup take?
A few minutes. Clear the sample values in columns A to G of the Production Log, type your own shifts, and add your dates to the helper table in column U. The KPI cards and charts recalculate on their own.
How is achievement and scrap calculated?
Achievement % is Actual Qty divided by Target Qty, and Scrap % is Rejected Qty divided by Actual Qty. The Dashboard totals use the whole log, so overall achievement is total actual over total target, not an average of daily percentages.
Can I learn to build this tracker myself?
Yes. The How to Build sheet lists 32 steps in six parts with every formula. The step-by-step video tutorial is live on the PK: An Excel Expert YouTube channel.
How does this compare to the Manufacturing Dashboard in Excel?
The free tracker covers output vs target and scrap. The paid Manufacturing Dashboard in Excel adds 15+ KPIs including OEE, Throughput, First Pass Yield, Downtime, MTBF and MTTR across 7 analysis pages, still with no macros and a one-time purchase.
👤 About the Author
Built by PK, Microsoft Certified Professional with 15+ years of Excel, Google Sheets, and Power BI experience. Founder of NextGenTemplates, reaching 300K+ subscribers across YouTube channels (@PKAnExcelExpert, @NextGenTemplates, @NeoTechNavigators). Every template is hand-built and tested before release.
🔗 Explore Related Templates
- 📊 Manufacturing Dashboard in Excel: the full upgrade with OEE, downtime and quality analysis.
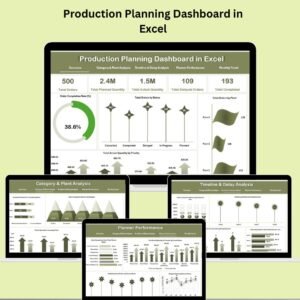
- 🗓️ Production Planning Dashboard in Excel: plan output before you track it.
- ⚙️ Manufacturing Efficiency Dashboard in Excel: efficiency analysis for the plant.
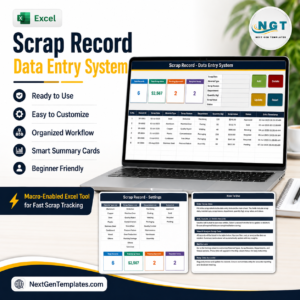
- ♻️ Scrap Record Data Entry System in Excel: a form-based scrap register.
💎 Running a whole plant? See the Manufacturing Excellence Bundle, or browse all Manufacturing Templates and Excel Trackers.
📖 Read the tutorial: How to Make a Production Tracker in Excel
🎥 Watch the step-by-step video tutorial
📅 Last updated: October 2026















Reviews
There are no reviews yet.