

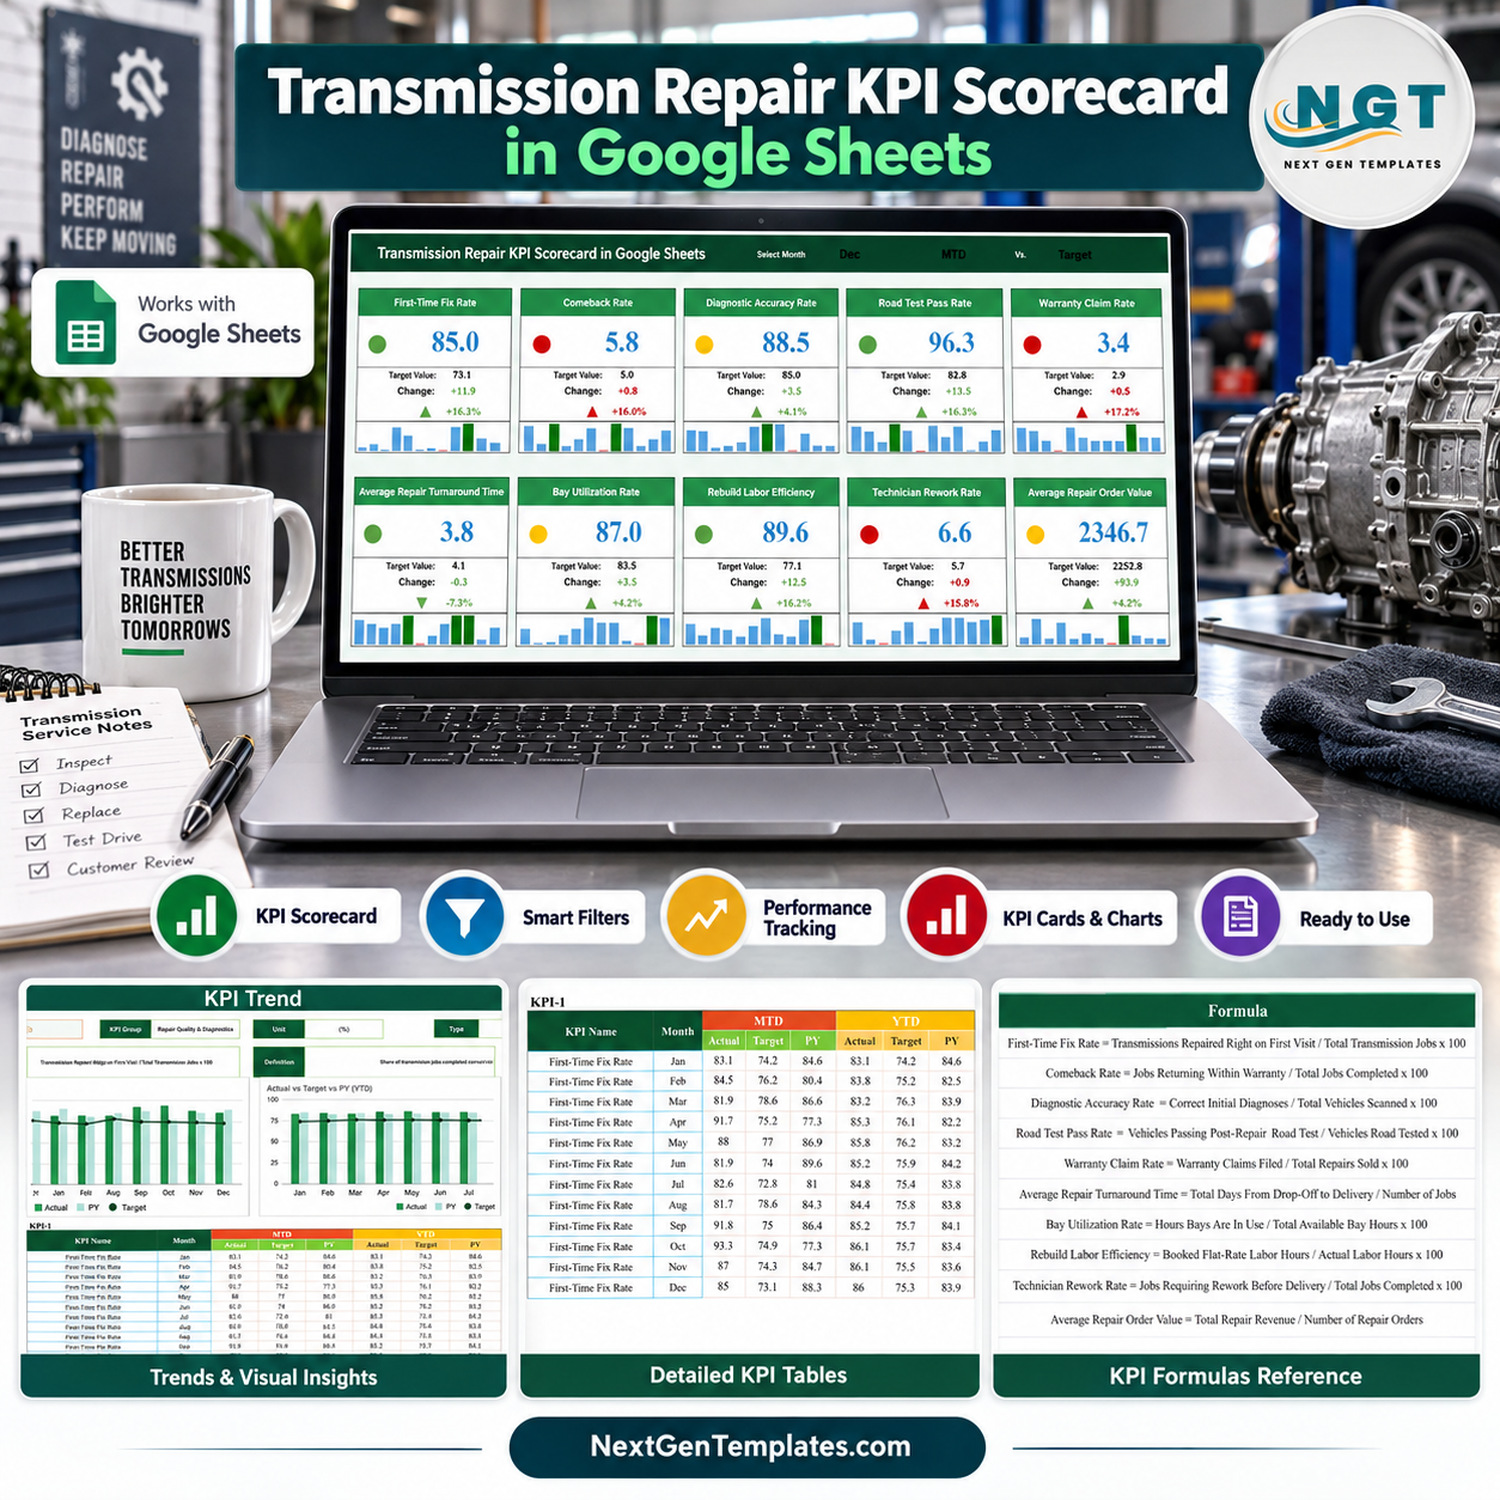
The Transmission Repair KPI Scorecard in Google Sheets tracks 10 transmission repair KPIs in four groups (Repair Quality & Diagnostics, Warranty & Rework, Shop Operations & Efficiency and Financial) on one page of traffic-light cards, each with a 12-month mini chart. A KPI Trend page charts any KPI against Target and prior year (PY), and the sample file ships with 120 monthly records.
This is the KPI scorecard edition: a month-picker scorecard plus a KPI Trend page, a different product from our analytical Google Sheets dashboards and the KPI Dashboard line. You buy it once and own the file.
✅ Instant download · One-time payment · No subscription · No per-user fees · Lifetime access
🔑 Key Features of the Transmission Repair KPI Scorecard
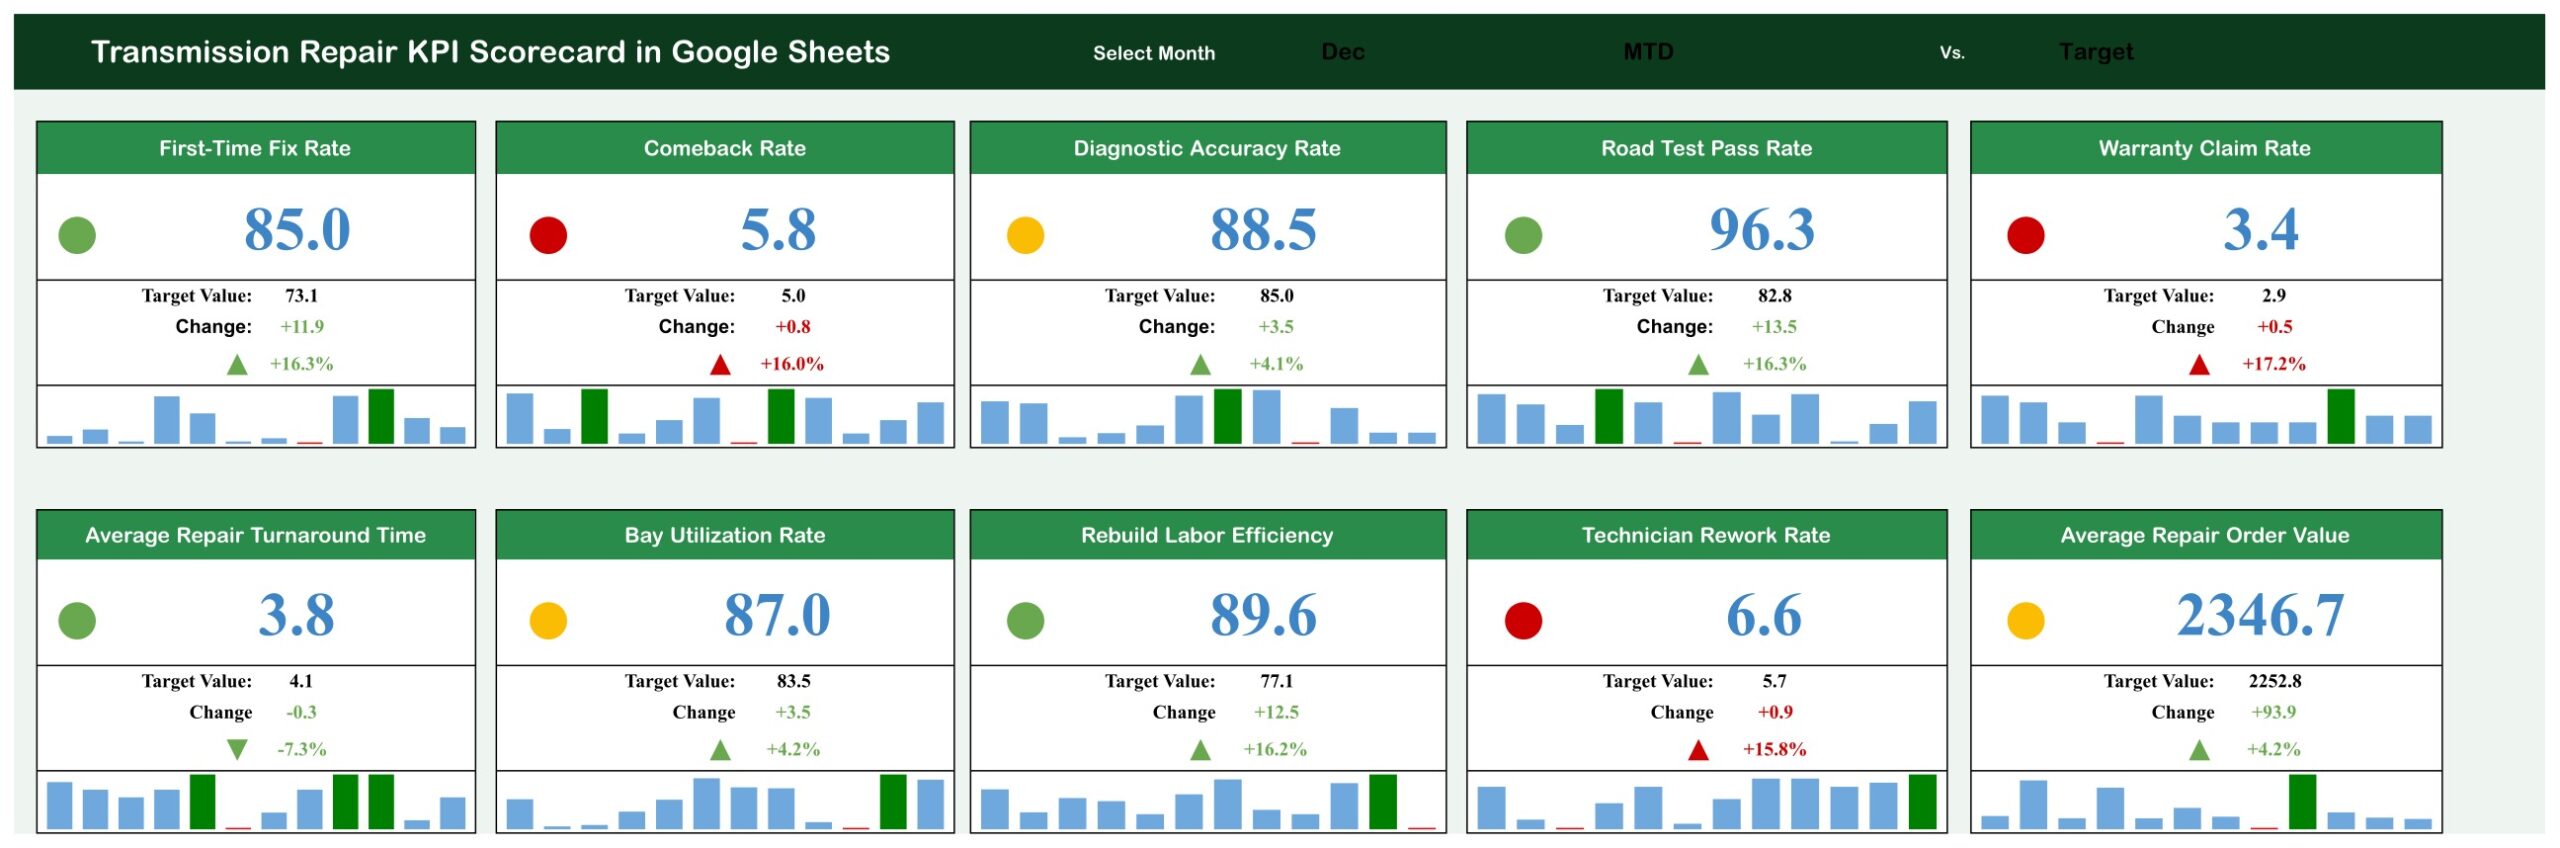
🎯 Three selectors on one page. Month (Jan to Dec), MTD or YTD, and Target or PY. Every card recalculates from the Input Data tab with ordinary formulas, with no scripts, macros or add-ons.
🚦 Direction-aware traffic lights. Six KPIs are upper-the-better (UTB) and four are lower-the-better (LTB): Comeback Rate, Warranty Claim Rate, Average Repair Turnaround Time and Technician Rework Rate. For UTB, a variance at or below 0% is red, up to 10% amber and above 10% green; LTB uses the mirror rule.
📈 Full detail on every card. Value, Target or PY, change, change %, an arrow and a 12-month mini column chart with the selected month highlighted in green.
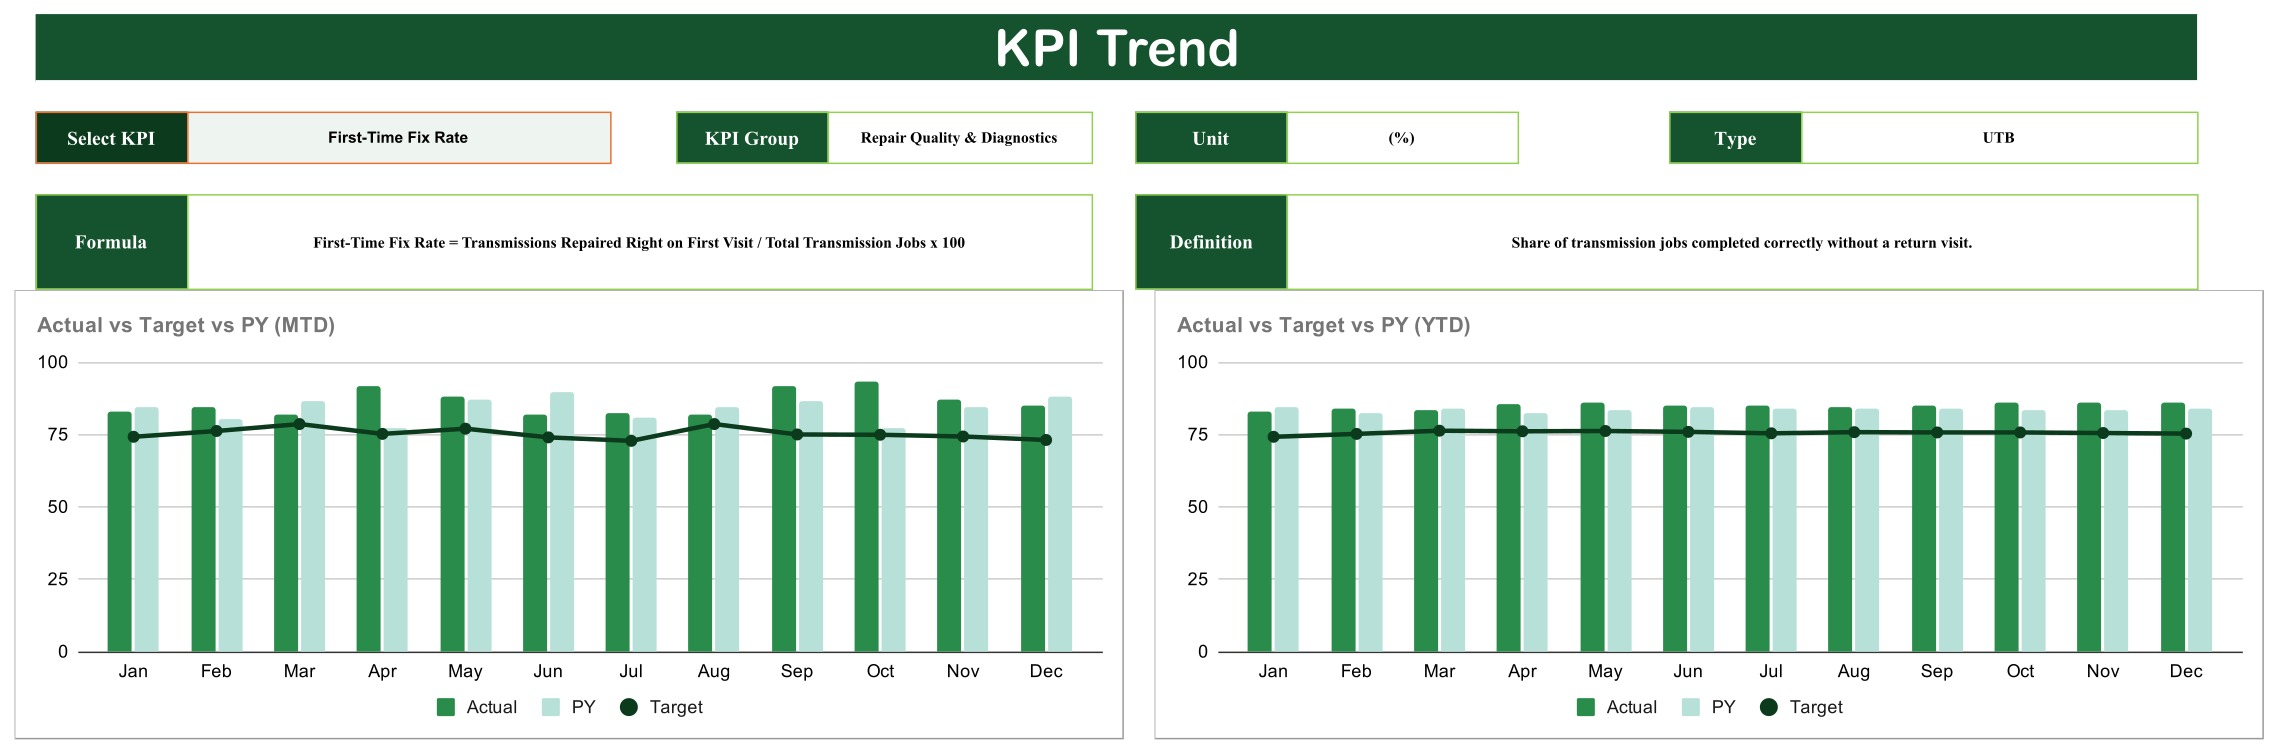
📊 KPI Trend page. Pick a KPI to see its group, unit, type, formula, definition and two charts: Actual vs Target vs PY (MTD) by Month and Actual vs Target vs PY (YTD) by Month.
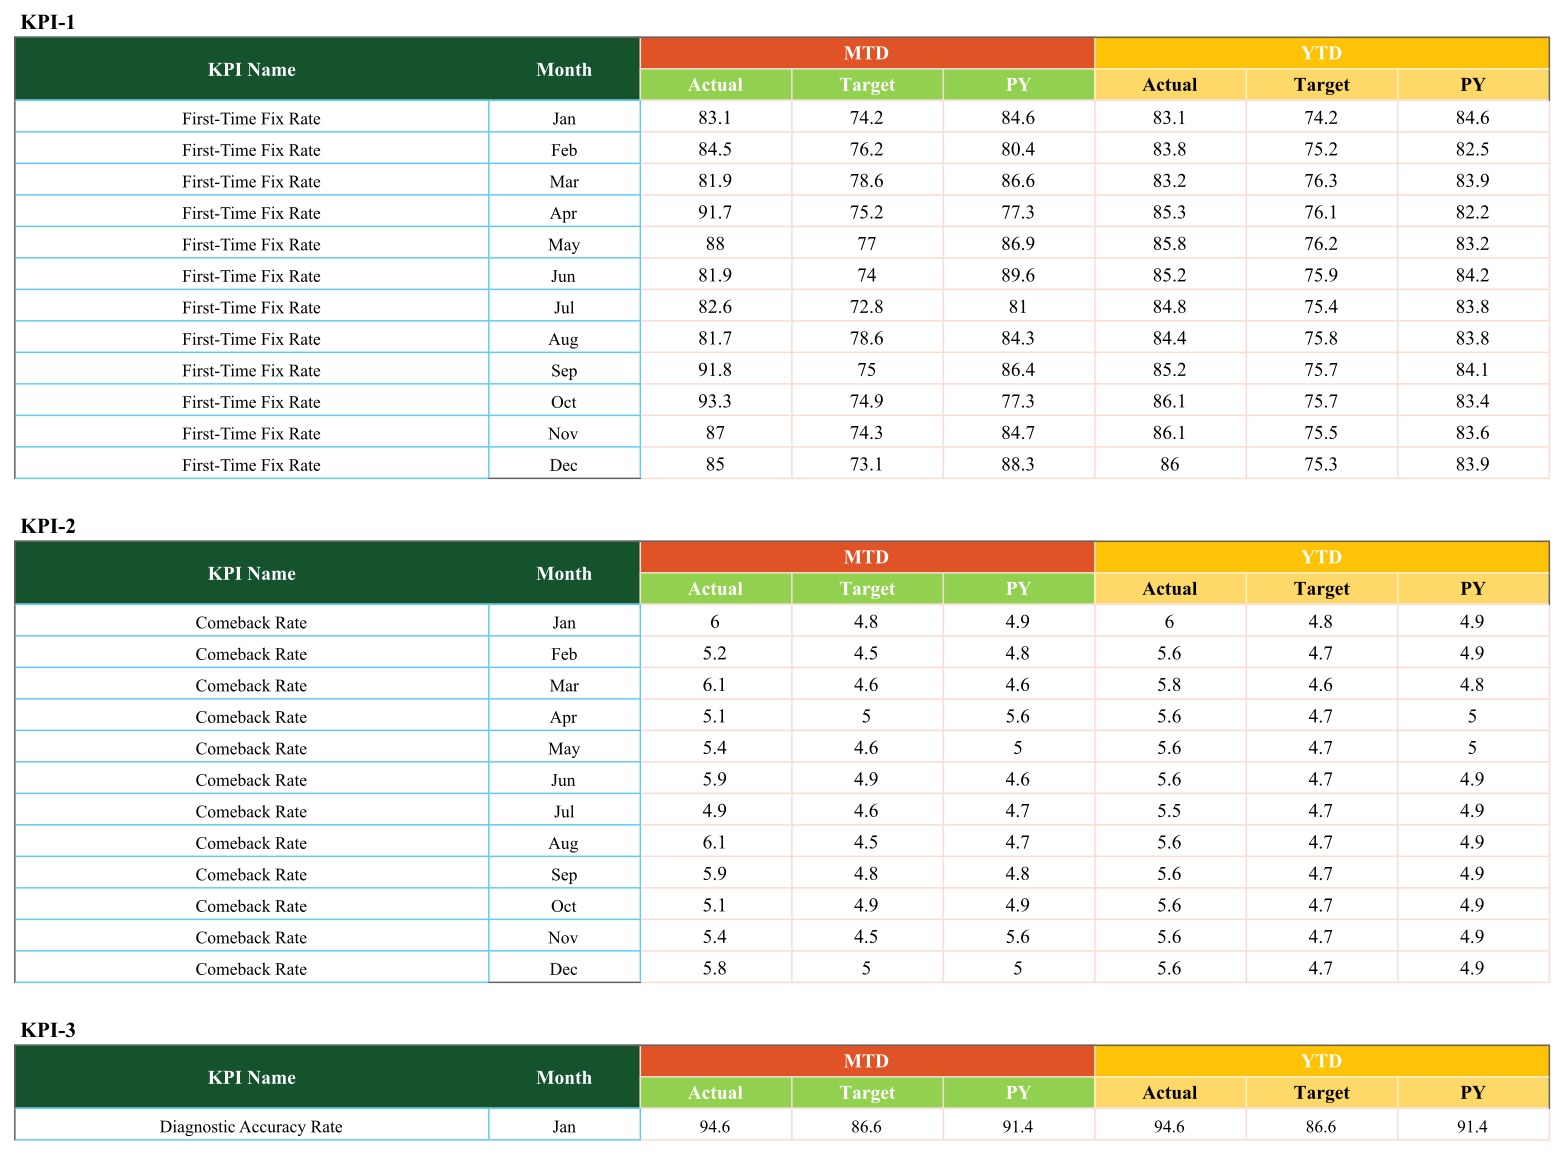
✏️ Simple monthly data entry. Input Data holds MTD and YTD Actual, Target and PY for each month of each KPI. YTD is typed, not calculated.
📦 What’s Inside the Transmission Repair KPI Scorecard in Google Sheets
- 🔧 Repair Quality & Diagnostics: First-Time Fix Rate (%), Comeback Rate (%, LTB), Diagnostic Accuracy Rate (%), Road Test Pass Rate (%)
- 🛡️ Warranty & Rework: Warranty Claim Rate (%, LTB), Technician Rework Rate (%, LTB)
- 🏭 Shop Operations & Efficiency: Average Repair Turnaround Time (days, LTB), Bay Utilization Rate (%), Rebuild Labor Efficiency (%)
- 💰 Financial: Average Repair Order Value ($)
Page 1: Scorecard
Ten cards in two rows of five. With December, MTD and Target selected, the sample shows 4 green, 3 amber and 3 red lights: First-Time Fix Rate reads 85.0 against 73.1 (green, up 16.3%), Average Repair Turnaround Time 3.8 days against 4.1 (green, because lower is better) and Comeback Rate 5.8 against 5.0 (red).
Page 2: KPI Trend
Select KPI, KPI Group, Unit, Type, Formula and Definition boxes sit above the MTD and YTD charts. The sample shows First-Time Fix Rate across all 12 months.
Page 3: KPI Definition
All 10 KPIs with KPI Group, Unit, Formula, Definition and Type, for example Rebuild Labor Efficiency = Booked Flat-Rate Labor Hours / Actual Labor Hours x 100.

Page 4: Input Data
Ten blocks, KPI-1 to KPI-10, each with 12 monthly rows. This is the only sheet you type into.
The file also has Read Me, Color Settings, Support and Trend_Support tabs.
⚠️ Known issues in this build: the Month drop-down lists “June” and “July” while Input Data uses “Jun” and “Jul”, so those two months show 0.0 on the cards until you edit the drop-down (step 2 below). The Read Me tab is empty. Color Settings is not linked to the lights; the bands live in the Support tab (Z4:AE6).
📊 Google Sheets Scorecard vs. Excel vs. Shop Management Software
| Feature | Transmission Repair KPI Scorecard (Google Sheets) | Excel KPI workbook | Shop management software (Tekmetric / Shopmonkey) |
|---|---|---|---|
| Cost | ✅ One-time payment | One-time, plus Excel licence | Recurring subscription |
| Platform | ✅ Browser, any OS | Desktop Excel | Vendor apps |
| Setup time | ✅ Minutes | Minutes | Days to weeks |
| Team sharing | ✅ Native link sharing | File attachment | Per-user seats |
| Year-1 cost at 5 users | ✅ One purchase, no seats | Template plus licences | Per-user or per-shop fees |
| Customisable KPIs | ✅ Names, units, formulas, UTB/LTB | ✅ Yes | Within vendor limits |
| Traffic-light monthly scorecard | ✅ Built in | ✅ Built in | Usually a custom report |
| Repair orders, estimates, invoicing | No, monthly totals only | No | ✅ Yes |
For a transmission shop that wants a clear monthly KPI review without paying for a shop management platform, this Google Sheets KPI scorecard sits in the sweet spot.
👥 Who This Template Is For, and Who It’s Not For
✅ Built for: owners and service managers of transmission repair and rebuild shops who hold a monthly review, and shop foremen or office managers who want fix, comeback, bay and labor figures on one shared page.
❌ Not for: shops that need repair orders, estimates, parts ordering, invoicing or warranty claim records, or several years of history in one file. It does not file or manage warranty claims; it only reports the rate you enter.
⚙️ How to Use the Scorecard
- Open the PDF in your download, click the Google Sheets link and choose Make a copy.
- On the Scorecard tab select cell N1, open Data > Data validation and change “June” and “July” to “Jun” and “Jul”.
- Edit the KPI Definition sheet to match your shop, keeping KPI names identical in Input Data.
- Replace the sample MTD and YTD Actual, Target and PY figures with your own.
- Pick a month, MTD or YTD and Target or PY, then open KPI Trend for any KPI’s history.
💼 Real-World Use Cases
Mike owns a four-bay transmission rebuild shop. At month end he flips between Target and PY to check First-Time Fix Rate and Comeback Rate, then shares the link with his lead rebuilder so both see the same lights.
Rosa manages the front office of a busy transmission repair centre. When Bay Utilization Rate turns amber she opens KPI Trend to see which months slipped and compares them with Average Repair Turnaround Time.
❓ Frequently Asked Questions
What transmission repair KPIs does it track?
Ten: First-Time Fix Rate, Comeback Rate, Diagnostic Accuracy Rate, Road Test Pass Rate, Warranty Claim Rate, Average Repair Turnaround Time, Bay Utilization Rate, Rebuild Labor Efficiency, Technician Rework Rate and Average Repair Order Value, each with a unit, formula and direction.
Is this the KPI Scorecard or the KPI Dashboard?
The Google Sheets KPI Scorecard: 10 traffic-light cards, a month picker and a KPI Trend page. KPI Dashboards are separate products with different layouts.
How long does setup take?
A minute to copy, a minute for the June/July fix, then as long as it takes to enter 12 months of figures for 10 KPIs.
Can I change the traffic-light thresholds?
Yes, in the Support tab RAG table (Z4:AE6). The Color Settings tab is not linked in this build.
Does it replace shop management software?
No. It reports monthly figures you enter; it does not write repair orders, track parts or invoice customers. The supplied figures are fictional sample data.
👤 About the Author
Built by PK, Microsoft Certified Professional with 15+ years of Excel, Google Sheets and Power BI experience. Founder of NextGenTemplates, reaching 300K+ subscribers across YouTube channels (@PKAnExcelExpert, @NextGenTemplates, @NeoTechNavigators). Every template is hand-built and tested before release.
🔗 Explore Related Templates
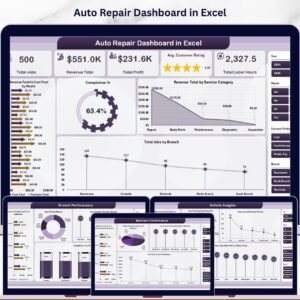
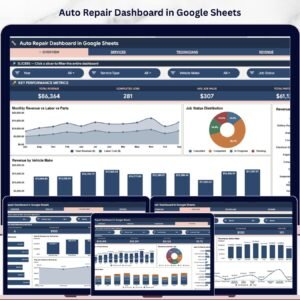
🚗 For deeper workshop analysis, see the Auto Repair Dashboard in Google Sheets and the Auto Repair Dashboard in Excel.
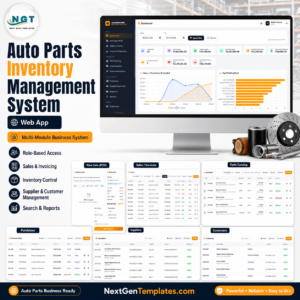
🧰 For day-to-day records, try the Vehicle Service Log Data Entry System in Excel, the Fleet Maintenance Calendar in Google Sheets or the Auto Parts Inventory Management System Web App.
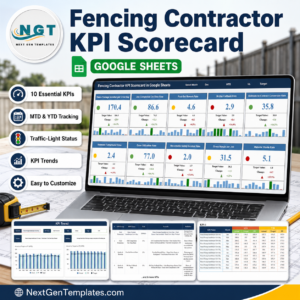
🛠️ Same scorecard layout for another repair trade: Appliance Repair Business KPI Scorecard in Google Sheets.
📂 Browse every Google Sheets KPI template.
📘 Google’s guide explains how to edit a drop-down list in Google Sheets.
📖 Click here to read the Detailed Blog Post
🎥 Visit our YouTube channel for step-by-step video tutorials
👉 YouTube.com/@NextGenTemplates
Watch the step-by-step video Demo:
📅 Last updated: September 2026






















Reviews
There are no reviews yet.