

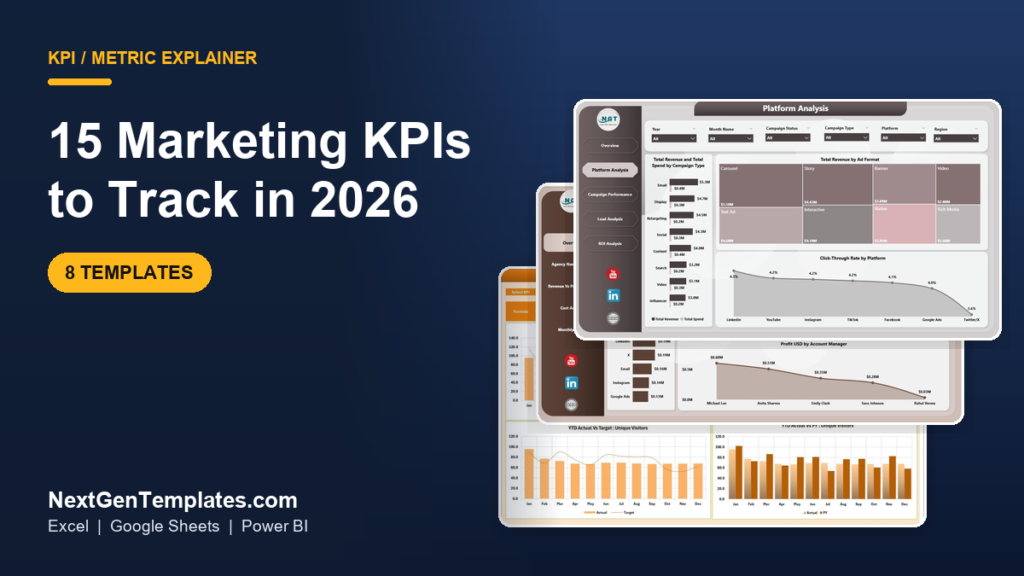
Marketing KPIs are the measurable numbers that show whether marketing is winning customers profitably. The 15 that matter most in 2026 are CAC, ROAS, marketing ROI, CPL, conversion rate, CTR, CPC, LTV, the LTV:CAC ratio, MQLs, lead-to-customer rate, email open rate, traffic by source, engagement rate, and social engagement rate. Track them in one dashboard, not ten tabs.
Last updated: September 2026
Key takeaways
- The 15 marketing KPIs below cover the full funnel: cost (CAC, CPL, CPC), efficiency (ROAS, marketing ROI, LTV:CAC), conversion (conversion rate, CTR, close rate), and engagement (open rate, engagement rate, social engagement).
- The single healthiest signal in the list is an LTV:CAC ratio of at least 3:1 — below 1:1 you lose money on every customer; above 5:1 you are under-investing in growth.
- Every metric here has an exact formula and a realistic 2026 benchmark, so you can score your own numbers today.
- All 15 KPIs are already calculated by 8 ready-made NGT templates, from the Digital Marketing Campaign Dashboard in Power BI at $17.99 down to the Email Marketing Campaign Calendar at $4.99.
- The most common reporting mistake is measuring last-click only — it over-credits bottom-funnel channels and hides what actually drives your marketing KPIs.
The 15 marketing KPIs at a glance
Use this table as your quick reference. Each metric is defined in full — formula, benchmark, and the mistake teams make — in the sections below.
| Marketing KPI | Formula | 2026 benchmark | Where to see it |
|---|---|---|---|
| 1. Customer Acquisition Cost (CAC) | Total sales & marketing spend ÷ new customers | SaaS $200–$600; e-commerce $30–$60 | Power BI / Excel dashboard |
| 2. Return on Ad Spend (ROAS) | Ad revenue ÷ ad spend | 4:1 healthy; 2:1 break-even | Digital Marketing Campaign Dashboard |
| 3. Marketing ROI | (Marketing revenue − cost) ÷ cost | 5:1 good; 10:1 exceptional | Marketing KPI dashboard |
| 4. Cost Per Lead (CPL) | Campaign spend ÷ leads generated | B2B $30–$200; B2C lower | Campaign submission tracker |
| 5. Conversion Rate | Conversions ÷ visitors × 100 | Site 2–5%; landing pages 10%+ | Content Performance KPI Scorecard |
| 6. Click-Through Rate (CTR) | Clicks ÷ impressions × 100 | Search 3–5%; display 0.5–1% | Digital Marketing dashboard |
| 7. Cost Per Click (CPC) | Ad spend ÷ clicks | Google Search $2–$4 avg | Campaign dashboard |
| 8. Customer Lifetime Value (LTV) | ARPU × gross margin ÷ churn rate | Depends; track the trend | Marketing KPI dashboard |
| 9. LTV:CAC Ratio | LTV ÷ CAC | 3:1 target; <1 unprofitable | Executive KPI scorecard |
| 10. Marketing Qualified Leads (MQLs) | Count of leads over scoring threshold | MQL→SQL ≈ 13% | Campaign submission tracker |
| 11. Lead-to-Customer Rate | Customers ÷ leads × 100 | Overall 5–10% | Campaign tracker / CRM |
| 12. Email Open Rate | Unique opens ÷ delivered × 100 | 20–30% (MPP-inflated) | Email Marketing Campaign Calendar |
| 13. Traffic by Source | Sessions segmented by channel (GA4) | Organic 40–60% of mix | Content dashboard |
| 14. Engagement Rate (site) | Engaged sessions ÷ total sessions | 55–65% good | Content Performance Scorecard |
| 15. Social Engagement Rate | (Likes+comments+shares) ÷ reach × 100 | 1–3% per post solid | Influencer campaign dashboard |
Acquisition and cost marketing KPIs
1. Customer Acquisition Cost (CAC)
Definition: the average amount you spend to win one new paying customer.
Formula: CAC = Total sales & marketing spend ÷ number of new customers acquired in the same period.
Benchmark: highly industry-dependent — roughly $200–$600 for B2B SaaS, $30–$60 for e-commerce. What matters is the trend and the ratio to LTV, not the absolute figure.
The mistake teams make: counting only ad spend. Real CAC includes salaries, agency fees, tools and content costs. Leave those out and your CAC looks half its true size, which flatters every downstream decision.
2. Return on Ad Spend (ROAS)
Definition: how much revenue each advertising dollar returns.
Formula: ROAS = Revenue attributed to ads ÷ ad spend (often shown as 4:1 or 400%).
Benchmark: a 4:1 ROAS is a common healthy target; many e-commerce accounts break even around 2:1 once cost of goods is included.
The mistake teams make: using last-click attribution, which hands all the credit to the final touch and starves upper-funnel campaigns that actually created demand.
3. Marketing ROI
Definition: the profit generated for every dollar of total marketing investment.
Formula: Marketing ROI = (Revenue attributable to marketing − marketing cost) ÷ marketing cost.
Benchmark: a 5:1 return is considered good and 10:1 exceptional; below 2:1 the programme is usually not sustainable.
The mistake teams make: crediting gross revenue instead of gross margin. A 5:1 revenue ROI on a 20%-margin product is barely break-even.
4. Cost Per Lead (CPL)
Definition: what it costs to generate one lead from a campaign or channel.
Formula: CPL = Campaign spend ÷ number of leads generated.
Benchmark: B2B CPL commonly lands between $30 and $200 depending on channel and deal size; B2C is usually far lower.
The mistake teams make: counting raw form fills. A cheap CPL full of unqualified leads costs sales more time than a higher CPL of qualified prospects — always pair CPL with lead quality.
5. Cost Per Click (CPC)
Definition: the average price you pay each time someone clicks a paid ad.
Formula: CPC = Ad spend ÷ total clicks.
Benchmark: Google Search averages roughly $2–$4 across industries, with legal and insurance far higher and e-commerce lower.
The mistake teams make: optimising for the lowest CPC. Cheap clicks on loosely-matched keywords can crush conversion rate and raise your true cost per customer.
Efficiency and value marketing KPIs
6. Customer Lifetime Value (LTV)
Definition: the total gross profit you expect from an average customer across their whole relationship.
Formula: LTV = Average revenue per user (ARPU) × gross margin ÷ churn rate. A simpler version is average order value × purchase frequency × customer lifespan.
Benchmark: there is no universal number — track your own trend and always read it next to CAC.
The mistake teams make: using revenue rather than gross-margin LTV, which overstates how much you can afford to spend on acquisition.
7. LTV:CAC Ratio
Definition: the single clearest test of whether growth is profitable — value created versus value spent to acquire it.
Formula: LTV:CAC = Customer lifetime value ÷ customer acquisition cost.
Benchmark: aim for at least 3:1. Below 1:1 you lose money on every customer; consistently above 5:1 usually means you are under-investing and leaving growth on the table.
The mistake teams make: ignoring the CAC payback period. A 3:1 ratio still hurts cash flow if it takes 18 months to recoup acquisition cost.
8. Marketing Qualified Leads (MQLs)
Definition: the count of leads that meet your scoring threshold and are ready to hand to sales.
Formula: MQLs = number of leads whose behaviour and fit score exceeds the agreed qualification bar.
Benchmark: across B2B, roughly 13% of MQLs convert to sales-qualified leads — use that to size how many MQLs you need.
The mistake teams make: loosening the scoring model to hit a volume target, which inflates MQLs and destroys sales’ trust in the number.
Conversion and funnel marketing KPIs
9. Conversion Rate
Definition: the share of visitors who complete the action you care about.
Formula: Conversion Rate = Conversions ÷ total visitors × 100.
Benchmark: 2–5% is typical site-wide; a focused landing page should clear 10%.
The mistake teams make: reporting one global conversion rate. Blending paid, organic and email hides which channel is broken — always segment by source.
10. Click-Through Rate (CTR)
Definition: how often people who see an ad, email or result actually click it.
Formula: CTR = Clicks ÷ impressions × 100.
Benchmark: paid search 3–5%, display 0.5–1%, marketing email 2–3%.
The mistake teams make: chasing CTR in isolation. A clickbait subject line lifts CTR and tanks conversion — read CTR and conversion rate together.
11. Lead-to-Customer Rate (Close Rate)
Definition: the percentage of leads that eventually become paying customers.
Formula: Lead-to-Customer Rate = New customers ÷ total leads × 100.
Benchmark: around 5–10% overall, and much higher when measured from sales-qualified leads.
The mistake teams make: measuring at the wrong funnel stage, so marketing and sales argue over a number they define differently.
Engagement and channel marketing KPIs
12. Email Open Rate
Definition: the share of delivered emails that recipients open.
Formula: Open Rate = Unique opens ÷ delivered emails × 100.
Benchmark: 20–30% is a common average, though Apple Mail Privacy Protection now inflates opens.
The mistake teams make: trusting open rate as a primary metric after 2021’s privacy changes. Lead with click rate and conversions; use open rate only for relative subject-line testing.
13. Traffic by Source
Definition: your website sessions broken out by the channel that sent them (organic, paid, social, email, referral, direct).
Formula: Traffic by Source = GA4 sessions segmented by the default channel grouping.
Benchmark: a resilient mix has organic search at roughly 40–60% of total sessions, so you are not dependent on paid.
The mistake teams make: reporting one big traffic number as a vanity metric instead of watching the source mix, which is where risk and opportunity actually live.
14. Engagement Rate (website)
Definition: GA4’s replacement for bounce rate — the share of sessions that were genuinely engaged.
Formula: Engagement Rate = Engaged sessions ÷ total sessions × 100 (an engaged session lasts 10+ seconds, has a conversion, or 2+ pageviews).
Benchmark: 55–65% is a healthy range for content sites. See Google’s own definition of engaged sessions in GA4.
The mistake teams make: comparing GA4 engagement rate to old Universal Analytics bounce rate — they are near-opposites and not interchangeable.
15. Social Engagement Rate
Definition: how actively your audience interacts with a social post relative to how many people saw it.
Formula: Social Engagement Rate = (Likes + comments + shares + saves) ÷ reach × 100.
Benchmark: 1–3% per post is solid on Instagram; influencer content is judged the same way.
The mistake teams make: dividing by follower count instead of reach, which punishes large accounts and makes cross-campaign comparison meaningless.
Stop rebuilding these formulas by hand. The Digital Marketing Campaign Dashboard in Power BI already calculates CAC, ROAS, CPC, CTR and conversion rate from your raw campaign export — $17.99, one-time.
The 8 marketing KPI dashboard templates compared
Every one of the 15 marketing KPIs above is already built into one of these ready-made templates. Prices are one-time; there is no subscription.
| Template | Format | Best for | Price |
|---|---|---|---|
| Digital Marketing Campaign Dashboard (Best overall) | Power BI | Full paid-media KPI set in one model | $17.99 |
| Content Marketing Agencies Dashboard | Power BI | Agencies reporting per client | $17.99 |
| Content Performance KPI Scorecard (Best value) | Excel | MTD/YTD scorecard with traffic lights | $14.99 |
| Influencer Marketing Campaign Dashboard | Google Sheets | Creator & social engagement ROI | $9.99 |
| Marketing Campaign Submission Tracker | Excel (VBA) | CPL, MQL and pipeline tracking | $6.99 |
| Marketing Campaign Submission Tracker | Google Sheets | Shared team campaign tracking | $6.99 |
| Marketing Campaign Calendar | Excel | Planning cadence across channels | $4.99 |
| Email Marketing Campaign Calendar | Excel | Email schedule, open & click planning | $4.99 |
How we picked these
We searched the NextGenTemplates catalogue of 1,000+ paid Excel, Google Sheets and Power BI products and shortlisted only templates that calculate marketing KPIs rather than just list them. Each had to compute at least one of the 15 metrics with a real formula, ship with sample data so you can see the maths, and work offline with no subscription. We deliberately excluded generic finance dashboards and any template that merely stores campaign names without deriving a metric. The eight below cover the full marketing funnel from planning calendar to executive scorecard.
The 8 best marketing KPI dashboard templates for 2026
1. Digital Marketing Campaign Dashboard in Power BI — best overall
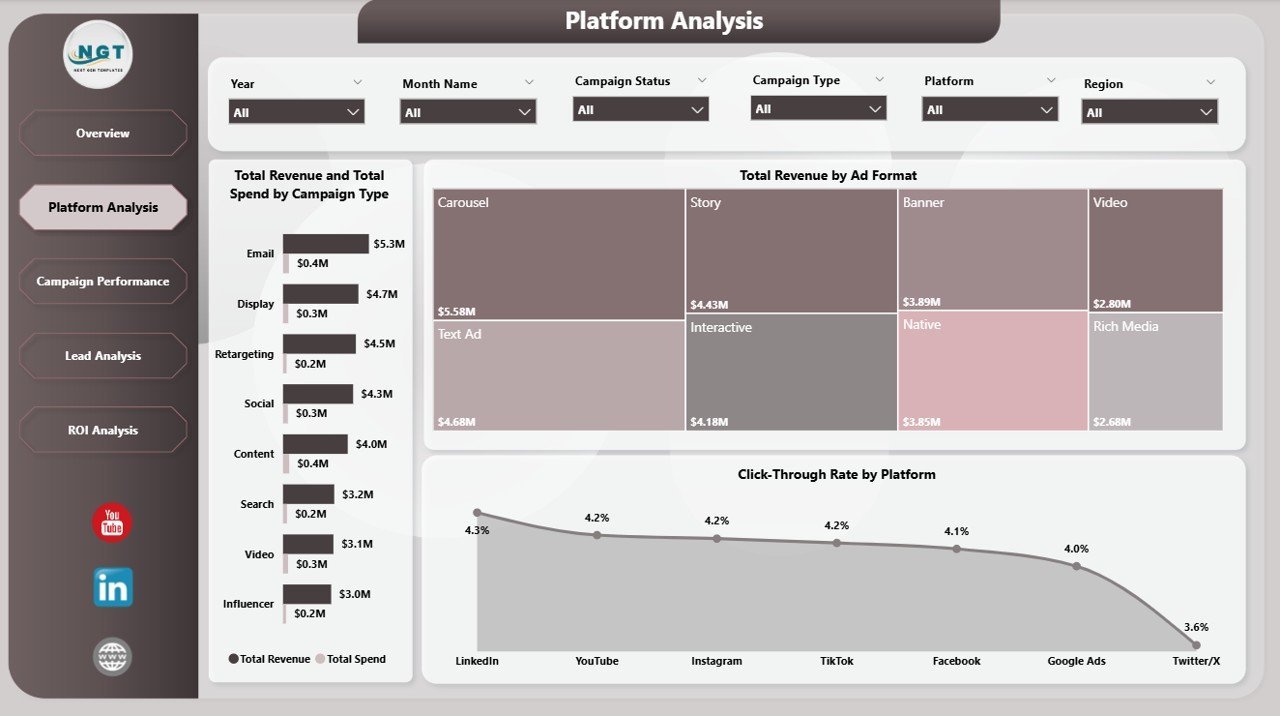
What it is: an interactive Power BI model that turns a raw campaign export into a full paid-media KPI dashboard. It is the most complete single answer to “how do I track my marketing KPIs?”.
Who it is for: in-house performance marketers and small agencies running multi-channel paid campaigns.
- Calculates CAC, ROAS, CPC, CTR and conversion rate automatically
- Spend and revenue split by campaign type, platform and region
- Slicers for year, month, campaign status and channel
- Click-through-rate-by-platform and profit-by-manager visuals built in
Load a month of Google, Meta and LinkedIn data and you immediately see which platform has the best ROAS, where CPC is climbing, and which region is dragging conversion. A team spending $50k/month typically finds one underperforming channel worth reallocating in the first afternoon.
Price: $17.99 — get the Digital Marketing Campaign Dashboard.
Best for: one place to watch every paid-media marketing KPI.
2. Content Marketing Agencies Dashboard in Power BI — best for agencies

What it is: a Power BI dashboard built for agencies that must report content performance and revenue per client.
Who it is for: content and SEO agencies presenting monthly results to multiple accounts.
- Revenue vs spend and profit by account manager
- Traffic, leads and content-attributed revenue by client
- Cost analysis and monthly trend views
- Overview page that doubles as a client-ready report
An agency running ten retainers can swap client data in minutes and hand over a branded performance view instead of building slides by hand. It pays for itself the first time it saves a reporting afternoon.
Price: $17.99 — get the Content Marketing Agencies Dashboard.
Best for: agencies reporting content KPIs per client.
3. Content Performance KPI Scorecard in Excel — best value
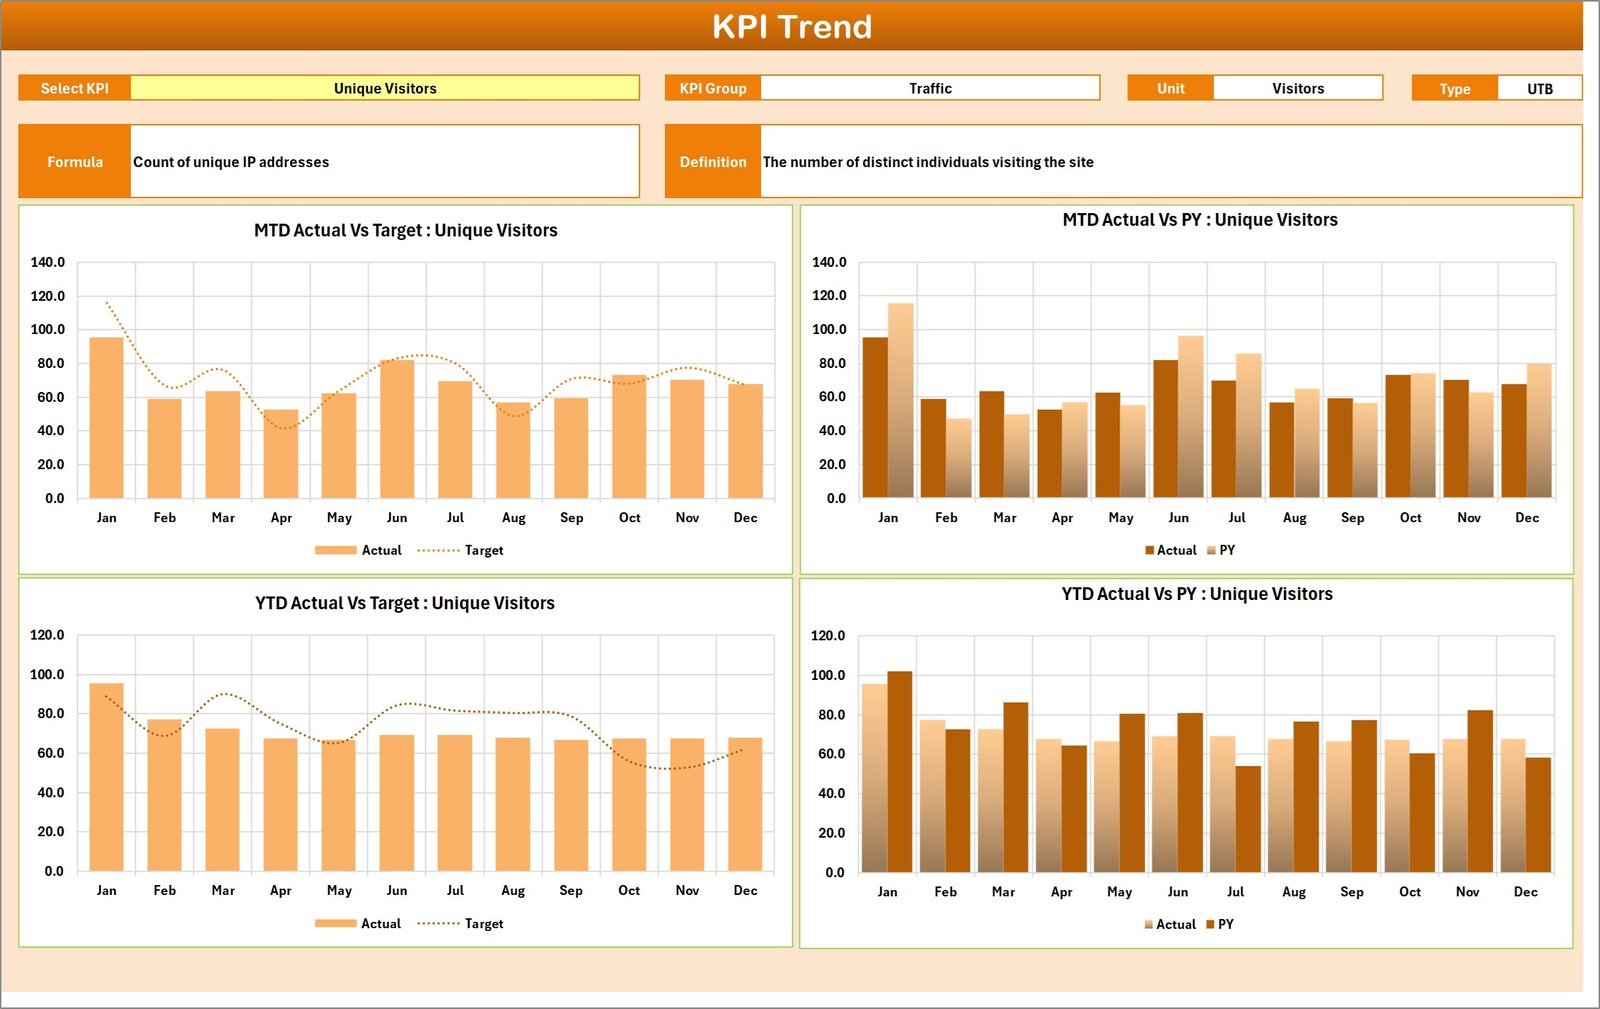
What it is: a month-picker Excel scorecard that grades content KPIs — traffic, conversion rate, engagement — against targets with red/amber/green traffic lights.
Who it is for: content leads and solo marketers who want an executive scorecard without Power BI.
- MTD and YTD actual-vs-target for every metric
- Automatic traffic-light status per KPI
- Trend and analysis pages driven by formulas, not manual charts
- Works in any Excel, no add-ins
For under $15 you get a genuine KPI scorecard that a founder can read in 30 seconds. It is the best value on this list because it delivers the executive view at an entry price.
Price: $14.99 — get the Content Performance KPI Scorecard.
Best for: a traffic-light scorecard on a budget.
4. Influencer Marketing Campaign Performance Dashboard in Google Sheets
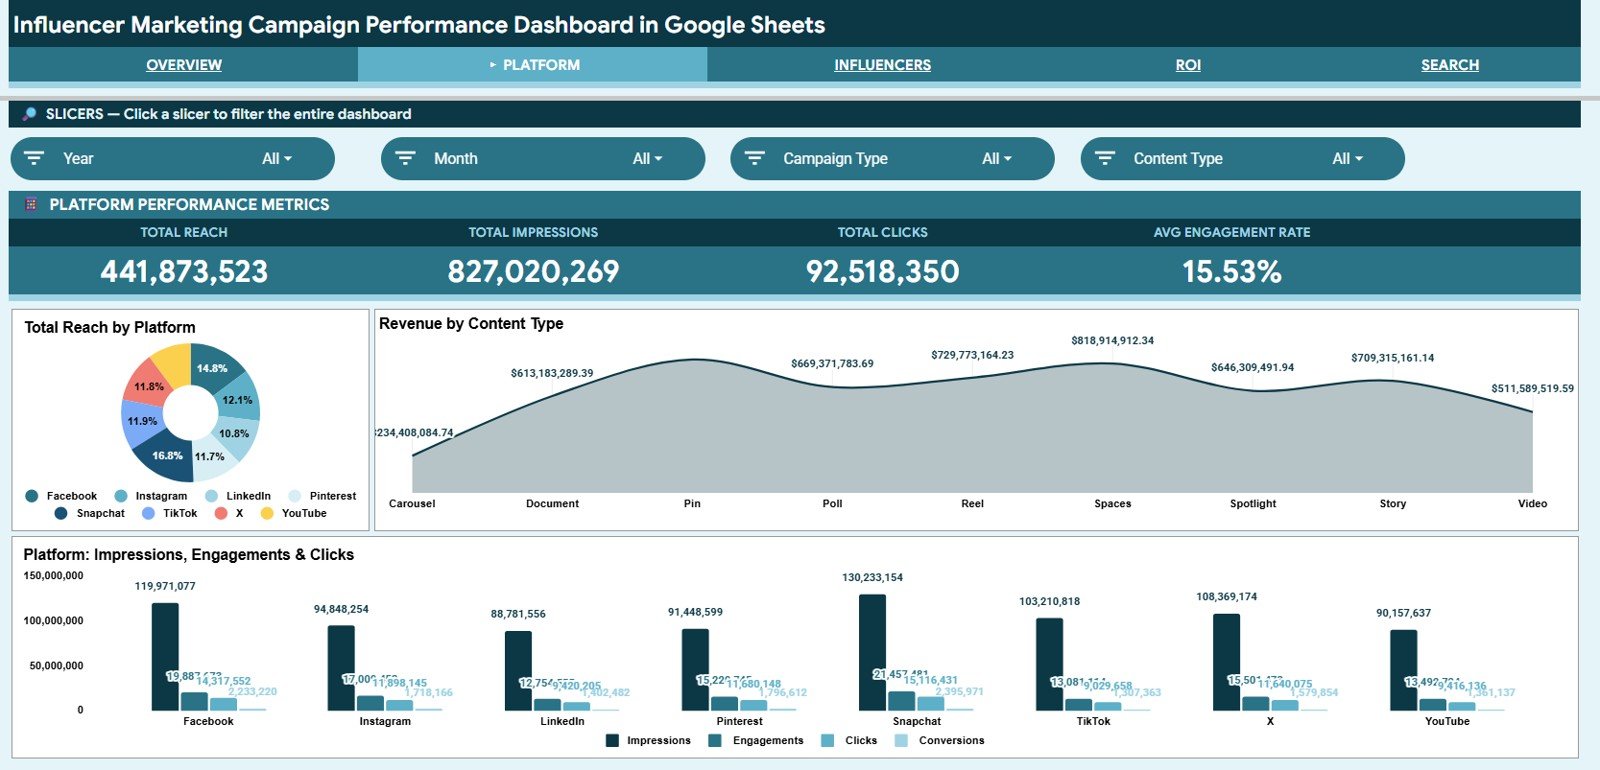
What it is: a Google Sheets dashboard for measuring creator and influencer campaigns — engagement rate, reach, CPL and ROI per creator.
Who it is for: social and influencer marketers coordinating multiple creators.
- Engagement rate and reach per influencer
- Cost, CPL and ROI comparison across creators
- Live in Google Sheets for easy sharing with agencies
- Sample data included to see the calculations
Run five creators side by side and you quickly see which one delivers engagement per dollar, so the next brief goes to the performer, not the biggest follower count.
Price: $9.99 — get the Influencer Marketing Dashboard.
Best for: social engagement and creator ROI.
5. Marketing Campaign Submission Tracker in Excel
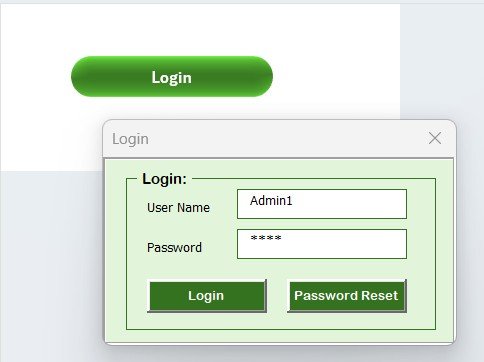
What it is: a VBA-powered Excel tracker that logs every campaign, its status, spend and leads — the raw input layer that feeds CPL, MQL and lead-to-customer rate.
Who it is for: teams that need a structured campaign log before they build dashboards.
- Add, update and delete campaigns via a simple form
- Status pipeline from submitted to live to closed
- Spend and lead fields that roll up into CPL
- Filterable table for quick reporting
It is the cheapest way to stop tracking campaigns in scattered emails and start capturing the data your marketing KPIs depend on.
Price: $6.99 — get the Excel Campaign Tracker.
Best for: the campaign data layer under your KPIs.
6. Marketing Campaign Submission Tracker in Google Sheets

What it is: the same campaign tracker in Google Sheets, built for teams that live in a shared browser workspace.
Who it is for: distributed marketing teams and agencies collaborating in real time.
- Cloud-shared campaign log with live edits
- Status, spend and lead capture per campaign
- Dropdown-driven data entry to keep records clean
- No software install — works anywhere
Pick this over the Excel version when three people need to update the same tracker at once without emailing files back and forth.
Price: $6.99 — get the Google Sheets Campaign Tracker.
Best for: shared, real-time campaign tracking.
7. Marketing Campaign Calendar in Excel
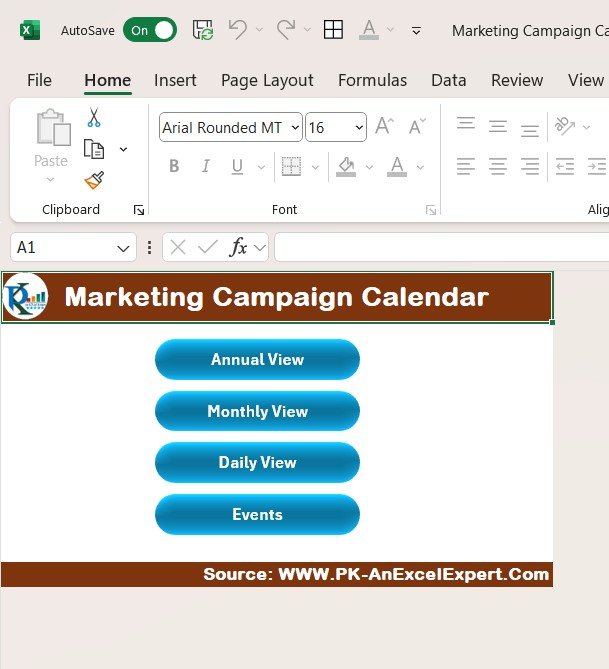
What it is: a planning calendar that maps campaigns across channels and months so your KPI reporting has a clean cadence to measure against.
Who it is for: marketers who want to plan the year before they measure it.
- Annual and monthly campaign views
- Channel-by-channel scheduling
- Colour-coded status and owner columns
- Feeds naturally into the trackers above
Good measurement starts with a plan; this calendar gives you the timeline your conversion and engagement KPIs are judged against.
Price: $4.99 — get the Marketing Campaign Calendar.
Best for: planning the campaign cadence.
8. Email Marketing Campaign Calendar in Excel
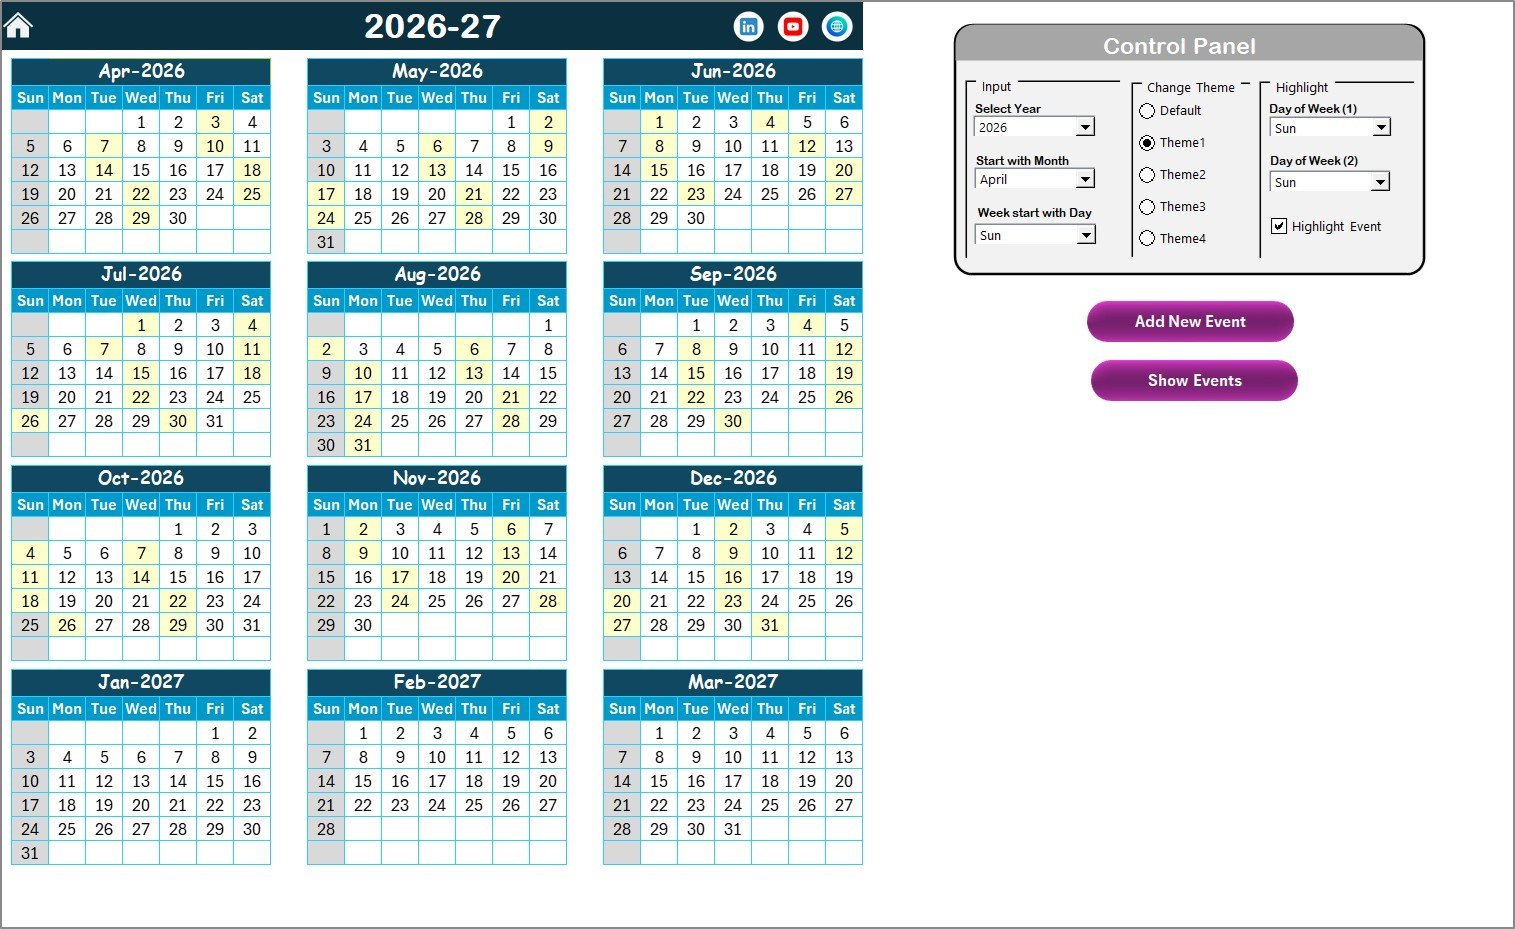
What it is: a dedicated email calendar for scheduling sends and planning the open-rate and click-rate testing behind them.
Who it is for: email and lifecycle marketers running a regular send schedule.
- Send calendar by segment and campaign
- Subject-line and offer planning columns
- Space to log open and click results for testing
- Simple, printable monthly layout
Because email open rate is now unreliable on its own, this calendar helps you structure proper subject-line tests and track click rate over time instead.
Price: $4.99 — get the Email Marketing Calendar.
Best for: planning email sends and open/click tests.
How to choose between them
Match the tool to where you are, not to the biggest feature list:
- You run paid media and want every KPI in one view → Digital Marketing Campaign Dashboard (Power BI, $17.99).
- You report to multiple clients → Content Marketing Agencies Dashboard (Power BI, $17.99).
- You want an executive scorecard without Power BI → Content Performance KPI Scorecard (Excel, $14.99).
- You run creator campaigns → Influencer Marketing Dashboard (Google Sheets, $9.99).
- You just need to capture campaign data first → a Campaign Submission Tracker (Excel or Sheets, $6.99).
- You are still planning the year → a Marketing Campaign Calendar ($4.99).
For deeper metric libraries in other functions, see our guides to 15 HR KPIs to track in 2026 and 12 manufacturing KPIs to track in 2026.
When a template is NOT the right answer
A spreadsheet or Power BI file is the right tool for reporting and analysis, but not for everything:
- Real-time multi-touch attribution — if you need automated, always-on attribution across dozens of channels, a dedicated platform beats any manual dashboard. Compare options in our HubSpot alternatives guide.
- Live data piping from ad platforms — templates work from exports; if you refuse to export data, you want a connected BI stack instead.
- Hundreds of users editing at once — a shared sheet strains past a certain team size; move to a database-backed tool.
- Regulated attribution or forecasting models — statistical media-mix modelling belongs in specialist software, not a scorecard.
For most teams under $5M in spend, though, a well-built template tracks every marketing KPI they actually act on — at a one-time price instead of a monthly seat.
Extending your measurement beyond one department? See our guide to the 12 social media KPIs to track in 2026.
Frequently asked questions
What are the most important marketing KPIs to track in 2026?
The highest-leverage marketing KPIs are CAC, LTV, the LTV:CAC ratio, ROAS and conversion rate. Together they answer whether you are acquiring customers profitably and converting demand efficiently. Everything else — CTR, CPL, open rate — explains why those headline numbers move.
What is a good LTV:CAC ratio?
Aim for at least 3:1, meaning each customer returns three times what you spent to acquire them. Below 1:1 you lose money on every sale. Consistently above 5:1 usually signals you are under-investing in growth and could safely spend more on acquisition.
How do you calculate marketing ROI?
Marketing ROI = (revenue attributable to marketing − marketing cost) ÷ marketing cost. Use gross-margin revenue, not top-line revenue, so a low-margin product does not look more profitable than it is. A 5:1 return is good; 10:1 is exceptional.
What is a healthy ROAS?
A 4:1 return on ad spend (400%) is a common healthy target, though the real break-even depends on your margins. Many e-commerce accounts need around 2:1 just to cover product costs, so always set a ROAS goal against your own unit economics.
Why is email open rate no longer reliable?
Apple Mail Privacy Protection, rolled out in 2021, pre-loads images and registers opens even when nobody read the email, inflating open rates. Use open rate only for relative subject-line testing and judge performance on click rate and conversions instead.
What is the difference between CAC and CPL?
CPL (cost per lead) is what you pay to generate one lead; CAC (customer acquisition cost) is what you pay to win one paying customer. CAC is always higher because only a fraction of leads convert. Track both to see where the funnel leaks.
Which marketing KPI dashboard should a small team start with?
Start with the Content Performance KPI Scorecard in Excel at $14.99 — it gives you a traffic-light executive view with no Power BI needed. As paid spend grows, add the Digital Marketing Campaign Dashboard in Power BI at $17.99 for full channel-level detail.
Do these templates work in Google Sheets and Power BI?
Yes. The set spans formats deliberately: Power BI dashboards for interactive analysis, Excel scorecards and trackers for offline work, and Google Sheets versions for shared, real-time collaboration. Pick the format your team already uses so there is no learning curve.
How often should I review my marketing KPIs?
Review acquisition and efficiency KPIs (CAC, ROAS, LTV:CAC) monthly, and channel KPIs (CTR, CPC, conversion rate) weekly during active campaigns. The scorecard and dashboard templates here are built with MTD and YTD views precisely so both cadences read from one file.
Are one-time template purchases better than a subscription tool?
For teams that export their data and want control, yes — a one-time $5–$18 template avoids per-seat monthly fees and never locks your history behind a paywall. Subscriptions win only when you need live connectors and automated attribution at scale.
Get more marketing KPI templates
Track all 15 marketing KPIs from day one. Start with the Digital Marketing Campaign Dashboard in Power BI ($17.99) for full paid-media KPIs, or the Content Performance KPI Scorecard in Excel ($14.99) for a traffic-light executive view. Both are one-time purchases with sample data included.
Browse more KPI dashboards and scorecards, and subscribe to NextGenTemplates on YouTube for step-by-step build tutorials.