

The 12 inventory KPIs worth tracking in 2026 are inventory turnover, days inventory outstanding, sell-through rate, stockout rate, inventory accuracy, carrying cost, GMROI, order fill rate, backorder rate, dead-stock rate, shrinkage rate and weeks of supply. Each has a fixed formula and a benchmark range, and every one is already calculated inside the NGT dashboards below.
Last updated: September 2026
Key takeaways
- Track a balanced set of inventory KPIs: turnover and days inventory outstanding for speed, GMROI and carrying cost for profit, fill rate and stockout rate for service.
- Inventory turnover of 4–8x per year and inventory accuracy of 97%+ are the two benchmarks most warehouses fail first.
- Every formula in this guide uses average inventory, not ending inventory — the single most common calculation mistake.
- The Inventory & Warehouse Master Kit bundles 8 Excel, Google Sheets and VBA templates for $69.99 and is the best-value way to calculate all 12 metrics.
- Single-purpose dashboards start at $11.99, so you can buy just the format you use — Excel, Google Sheets or Power BI.
Inventory KPI dashboard templates compared
| Template | Format | Best for | Price |
|---|---|---|---|
| Inventory & Warehouse Master Kit (8-in-1) | Excel + Sheets + VBA | Best value — every metric, every format | $69.99 |
| Finance & Accounting Inventory KPI Dashboard | Excel | Best overall single dashboard — GMROI & carrying cost | $14.99 |
| Retail Inventory KPI Dashboard | Excel | Sell-through and stock-cover for stores | $12.99 |
| Retail Inventory KPI Dashboard | Google Sheets | Cloud teams that live in Sheets | $12.99 |
| Healthcare Inventory KPI Dashboard | Excel | Expiry, par-levels and shrinkage in clinics | $14.99 |
| Education & Learning Inventory KPI Dashboard | Excel | Campus asset and supply tracking | $14.99 |
| CS & Support Inventory KPI Dashboard | Excel | Spare-parts and RMA stock | $14.99 |
| Inventory Accuracy KPI Dashboard | Power BI | Cycle-count accuracy at scale | $11.99 |
Prices are current NextGenTemplates store prices in USD and were verified the day this guide was updated. Prefer to compare full inventory systems rather than KPI dashboards? See our ranked roundup of inventory management Excel and VBA templates.
How we picked these inventory KPIs
We searched the full NextGenTemplates catalogue of more than 3,000 paid templates for every product that calculates an inventory metric, then cross-checked the 12 KPIs those dashboards report against the definitions used by the standard financial and supply-chain literature. A metric earned a place only when it had a single agreed formula, a defensible benchmark range, and at least one NGT template that already computes it. We excluded vanity counts (like “total SKUs”) that describe inventory without measuring performance, and we excluded metrics no template in the catalogue actually tracks, so every KPI here maps to a dashboard you can buy today.
The 12 inventory KPIs to track in 2026
Each KPI below gives you a one-sentence definition, the exact formula, a realistic 2026 benchmark range, and the mistake teams most often make. Use the reference table first, then read the detail on any metric your numbers are missing.
| # | Metric | Formula | Benchmark | Where to see it |
|---|---|---|---|---|
| 1 | Inventory Turnover Ratio | COGS ÷ Average Inventory | 4–8× / year | Finance & Accounting dashboard |
| 2 | Days Inventory Outstanding (DIO) | (Average Inventory ÷ COGS) × 365 | 30–60 days | Finance & Accounting dashboard |
| 3 | Sell-Through Rate | (Units Sold ÷ Units Received) × 100 | 40–80% / month | Retail Inventory dashboard |
| 4 | Stockout Rate | (Out-of-stock SKUs ÷ Total SKUs) × 100 | Under 5% | Retail Inventory dashboard |
| 5 | Inventory Accuracy (IRA) | (Matching counts ÷ Total counts) × 100 | 97%+ | Inventory Accuracy (Power BI) |
| 6 | Carrying Cost of Inventory | (Annual Holding Cost ÷ Avg Inventory Value) × 100 | 15–30% / year | Finance & Accounting dashboard |
| 7 | GMROI | Gross Margin $ ÷ Average Inventory Cost | Above 1.0 (retail 2–4) | Retail Inventory dashboard |
| 8 | Order Fill Rate | (Complete orders ÷ Total orders) × 100 | 95%+ | CS & Support dashboard |
| 9 | Backorder Rate | (Backordered orders ÷ Total orders) × 100 | Under 10% | CS & Support dashboard |
| 10 | Dead / Obsolete Stock Rate | (Dead-stock value ÷ Total inventory value) × 100 | Under 5% | Healthcare / Education dashboards |
| 11 | Shrinkage Rate | ((Recorded − Actual) ÷ Recorded) × 100 | Under 1.5% of sales | Healthcare dashboard |
| 12 | Weeks of Supply | Average On-hand ÷ Average Weekly Usage | 4–8 weeks | Retail Inventory dashboard |
1. Inventory Turnover Ratio
How many times you sell and replace your entire stock in a period. Formula: COGS ÷ Average Inventory. Benchmark: 4–8× per year for general retail and distribution; grocery and fast fashion run far higher, heavy machinery far lower. Common mistake: dividing by ending inventory instead of average ((opening + closing) ÷ 2), which inflates the ratio in any month you happened to end low. Turnover is the single best early-warning metric for cash tied up in the wrong SKUs.
2. Days Inventory Outstanding (DIO)
The average number of days a unit sits in stock before it sells. Formula: (Average Inventory ÷ COGS) × 365. Benchmark: 30–60 days for most sectors; it is simply turnover expressed in days (365 ÷ turnover). Common mistake: comparing your DIO to another industry’s — a 45-day DIO is excellent for furniture and alarming for fresh produce. Track the trend against your own history, not a universal target.
3. Sell-Through Rate
The share of received stock that sells within a set window, usually a month. Formula: (Units Sold ÷ Units Received) × 100. Benchmark: 40–80% per month depending on category and season. Common mistake: measuring over too short a window so slow-but-healthy lines look like failures. Pair sell-through with weeks of supply before you mark anything down.
4. Stockout Rate
How often customers find an item unavailable. Formula: (Out-of-stock SKUs ÷ Total SKUs) × 100, sampled daily. Benchmark: under 5%; best-in-class retailers hold it under 2% on core lines. Common mistake: measuring only at month-end, which hides the mid-month gaps that actually lose sales. A daily snapshot averaged across the month is the honest number.
5. Inventory Record Accuracy (IRA)
How closely your system’s stock figures match a physical count. Formula: (Locations counted with matching quantity ÷ Total locations counted) × 100. Benchmark: 97%+ is the accepted floor for a functioning operation; 99%+ for automated warehouses. Common mistake: only counting fast-movers during cycle counts, which flatters the score. Rotate every ABC class through the count schedule.
6. Carrying Cost of Inventory
The full annual cost of holding stock, as a percentage of its value. Formula: (Storage + Capital + Insurance + Shrinkage + Obsolescence ÷ Average Inventory Value) × 100. Benchmark: 15–30% of inventory value per year. Common mistake: leaving out the cost of capital — the return you forgo by having cash sit on a shelf — which is often the largest component. Carrying cost is what makes “just hold more safety stock” an expensive answer.
7. Gross Margin Return on Investment (GMROI)
The gross profit you earn for every dollar invested in inventory. Formula: Gross Margin $ ÷ Average Inventory Cost. Benchmark: above 1.0 means you make more than a dollar per dollar invested; healthy retail sits at 2–4. Common mistake: confusing GMROI with gross margin percentage — a high-margin line that never sells can still have a terrible GMROI. This is the KPI that tells buyers which products deserve more open-to-buy.
8. Order Fill Rate
The share of orders you ship complete and on time from stock. Formula: (Orders shipped complete ÷ Total orders) × 100. Benchmark: 95%+ for order fill; line fill rate is usually a point or two higher. Common mistake: reporting line fill (individual items) and calling it order fill (whole orders) — the two diverge sharply once orders contain many lines. Decide which one your customers actually feel.
9. Backorder Rate
How much demand you cannot satisfy immediately. Formula: (Backordered orders ÷ Total orders) × 100. Benchmark: under 10%, and ideally under 5% on A-class items. Common mistake: not separating chronic backorders (a real supply problem) from seasonal spikes (a forecasting choice). A flat rate hides both; split it by SKU class and cause.
10. Dead / Obsolete Stock Rate
The proportion of inventory value that has stopped moving. Formula: (Value of stock with no sales in N days ÷ Total inventory value) × 100. Benchmark: under 5%; over 10% signals a markdown and buying problem. Common mistake: having no aging threshold at all, so obsolete stock never gets flagged until a physical count trips over it. Set N (often 90, 180 or 365 days) per category and hold to it.
11. Shrinkage Rate
Inventory lost to theft, damage, spoilage or admin error. Formula: ((Recorded Inventory − Actual Inventory) ÷ Recorded Inventory) × 100, or expressed as a percentage of sales. Benchmark: under 1.5% of sales is typical; grocery and pharmacy watch it far more tightly. Common mistake: assuming shrinkage means theft — clerical and receiving errors usually account for more of it, and those are fixable with process, not cameras.
12. Weeks of Supply
How long current stock will last at the current sales rate. Formula: Average On-hand Inventory ÷ Average Weekly Usage. Benchmark: 4–8 weeks for most retail and distribution. Common mistake: using an annual average usage rate for seasonal goods, which understates cover before a peak and overstates it after. Use a trailing 4–8 week usage rate that moves with demand.
The 8 inventory KPI dashboards that calculate these metrics
Every formula above is already built, formatted and charted inside the NextGenTemplates dashboards below. Buy the format your team uses — Excel, Google Sheets or Power BI — or take the bundle and get all of them.
1. Inventory & Warehouse Master Kit — best overall & best value
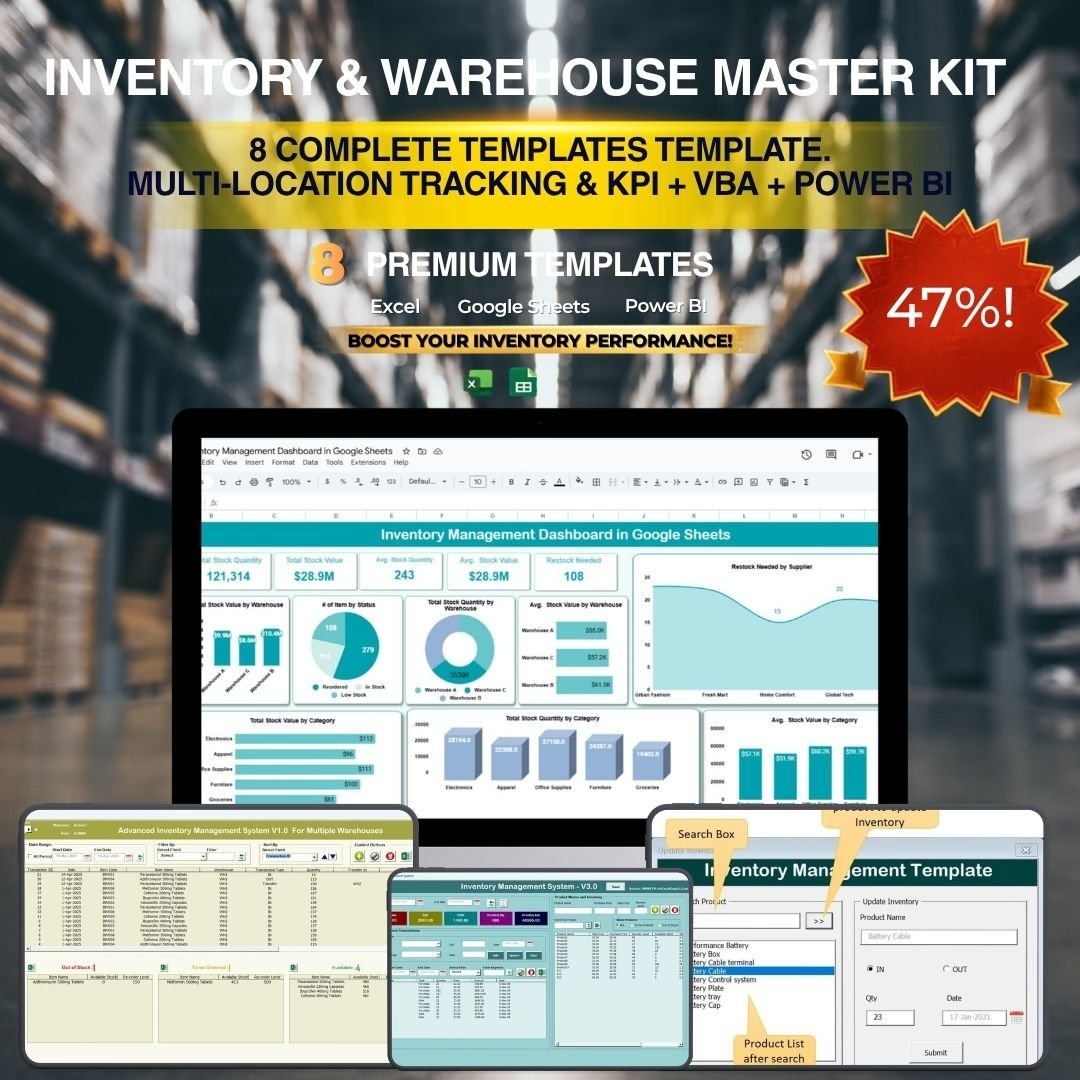
What it is: an 8-in-1 bundle of premium Excel, Google Sheets and VBA inventory templates, sold together at a 36% saving over buying the tools individually. Who it is for: operations leads and finance teams who want every inventory KPI in one place without stitching separate files together.
- Covers turnover, DIO, GMROI, carrying cost, fill rate and stock cover in one kit
- Both Excel and Google Sheets versions, so office and cloud teams work from the same logic
- VBA automation for reorder points and stock movements
- Formatted dashboards and print-ready reports out of the box
For a distributor tracking 2,000 SKUs, the kit replaces three or four single-purpose files and keeps every metric on one definition. It is the cheapest route to all 12 KPIs. Price: $69.99. Get the Inventory & Warehouse Master Kit.
Best for: anyone who wants the complete inventory KPI stack in one purchase.
2. Finance & Accounting Inventory Management KPI Dashboard (Excel) — best single dashboard

What it is: a single-file Excel dashboard focused on the money side of inventory — turnover, days inventory outstanding, carrying cost and GMROI. Who it is for: finance and accounting teams who report inventory performance to management each month.
- Turnover and DIO calculated on average inventory automatically
- Carrying-cost model with capital, storage and obsolescence inputs
- GMROI by product line to guide open-to-buy decisions
Price: $14.99. Get the Finance & Accounting Inventory KPI Dashboard. Best for: month-end inventory reporting in Excel.
3. Retail Inventory KPI Dashboard (Excel)
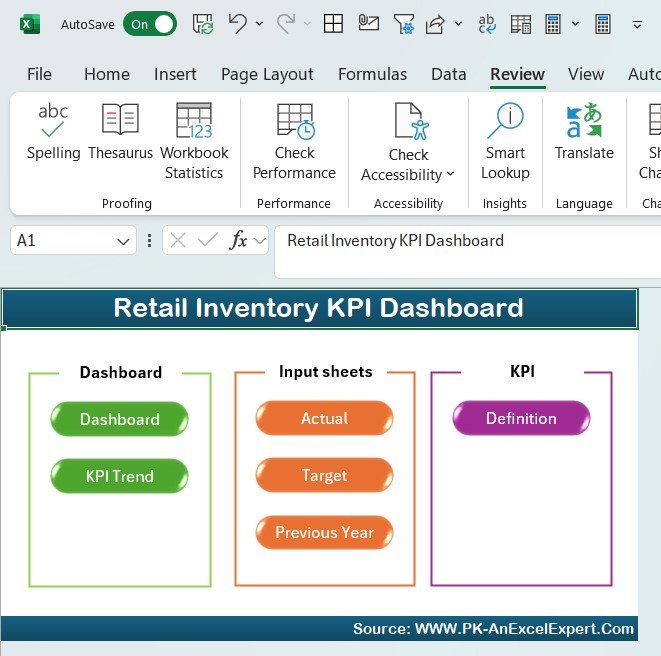
What it is: a store-focused Excel dashboard built around sell-through rate, stockout rate, GMROI and weeks of supply. Who it is for: retail buyers and store managers deciding what to reorder and what to mark down.
- Sell-through and weeks-of-supply by SKU and category
- Stockout tracking with a low-stock alert view
- GMROI ranking to protect margin, not just volume
Price: $12.99. Get the Retail Inventory KPI Dashboard for Excel. Best for: single-store and small-chain retail buying.
4. Retail Inventory KPI Dashboard (Google Sheets)
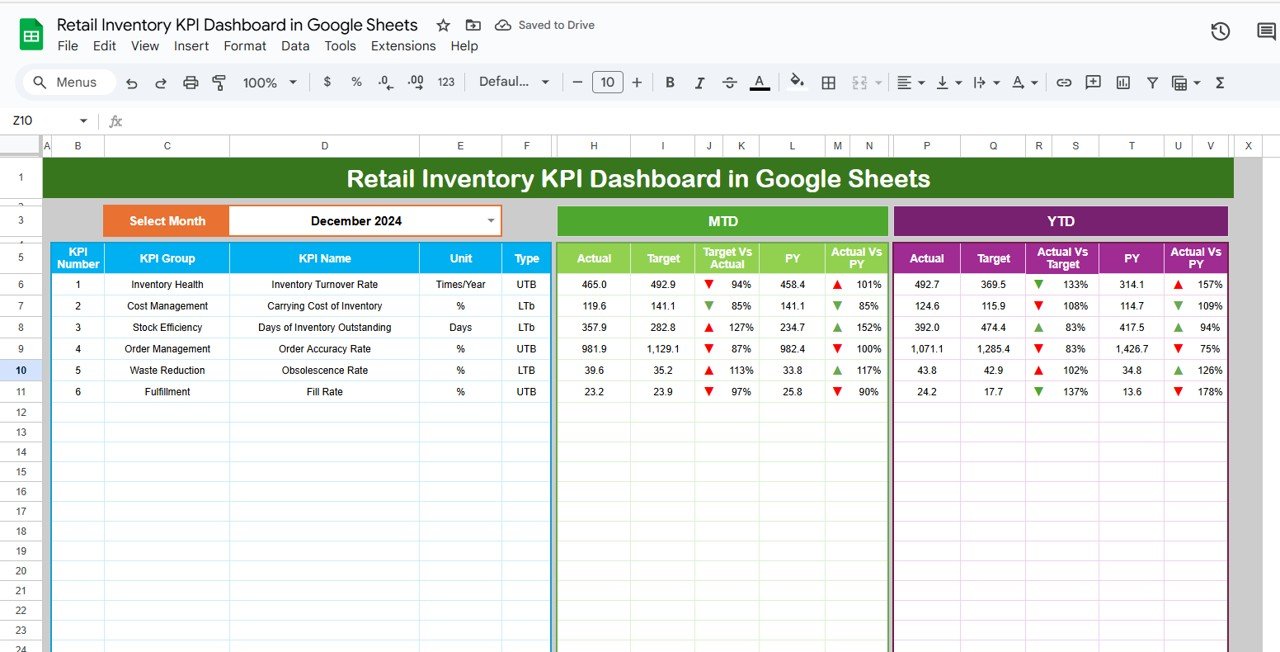
What it is: the same retail KPI logic as the Excel version, rebuilt natively for Google Sheets so a distributed team can share one live file. Who it is for: cloud-first retailers and franchises who collaborate in Sheets.
- Live shared editing — no version emailed around
- Sell-through, stockout and weeks-of-supply calculated with Sheets formulas
- Works from any browser, no desktop Excel needed
Price: $12.99. Get the Google Sheets Retail Inventory KPI Dashboard. Best for: teams that already run on Google Workspace.
5. Healthcare Inventory Management KPI Dashboard (Excel)

What it is: an Excel dashboard tuned for clinical supply — par-level tracking, expiry, shrinkage and stockout on critical items. Who it is for: clinics, pharmacies and hospital storerooms where a stockout is a patient-safety issue.
- Par-level and reorder monitoring by item
- Expiry and dead-stock aging to cut waste
- Shrinkage tracking for controlled and high-value supplies
Price: $14.99. Get the Healthcare Inventory KPI Dashboard. Best for: medical and pharmacy stock control.
6. Education & Learning Inventory Management KPI Dashboard (Excel)
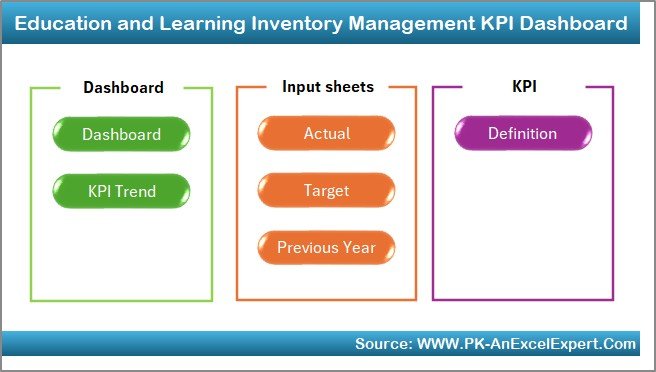
What it is: an Excel dashboard for schools, colleges and training providers tracking assets, consumables and lab supplies. Who it is for: facilities and procurement staff on a campus with distributed storerooms.
- Asset and consumable tracking across departments
- Reorder alerts for teaching and lab supplies
- Dead-stock and utilisation views for budget planning
Price: $14.99. Get the Education Inventory KPI Dashboard. Best for: campus and training-provider supply tracking.
7. CS & Support Inventory Management KPI Dashboard (Excel)

What it is: an Excel dashboard for spare-parts and returns inventory, built around fill rate, backorder rate and stock cover on service parts. Who it is for: customer-support and field-service teams that ship replacement parts.
- Order fill rate and backorder rate on service parts
- RMA and replacement stock tracking
- Reorder points sized to service-level targets
Price: $14.99. Get the CS & Support Inventory KPI Dashboard. Best for: spare-parts and after-sales stock.
8. Inventory Accuracy KPI Dashboard (Power BI)
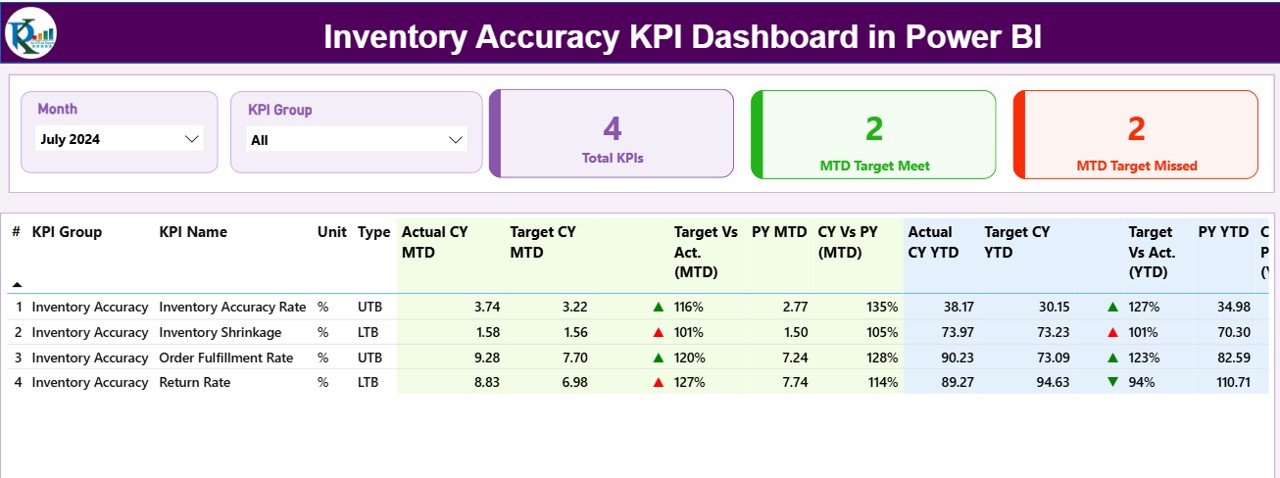
What it is: a Power BI report dedicated to inventory record accuracy and cycle-count performance across locations. Who it is for: multi-site operations that need IRA visualised and refreshed automatically rather than counted by hand in a spreadsheet.
- IRA by location, ABC class and count cycle
- Variance drill-down to find the SKUs dragging the score down
- Auto-refresh from your data source, at $11.99 the lowest-priced option here
Price: $11.99. Get the Inventory Accuracy KPI Dashboard for Power BI. Best for: cycle-count accuracy across many locations.
How to choose between them
Match the dashboard to your role and your file format:
- Want all 12 KPIs and both formats? Buy the Master Kit — it is cheaper than four single dashboards.
- Report inventory to finance each month? The Finance & Accounting dashboard owns turnover, DIO, carrying cost and GMROI.
- Run a store or small chain? Pick the Retail dashboard in Excel or Google Sheets depending on where your team works.
- Accuracy is your problem? The Power BI Inventory Accuracy dashboard is purpose-built for IRA and cycle counts.
- Specialised sector? Healthcare, Education and CS & Support versions add the par-levels, expiry and spare-parts logic those settings need.
When a KPI dashboard is NOT the right answer
A spreadsheet or Power BI dashboard reports your inventory KPIs; it does not run your warehouse. If you have more than a few thousand SKUs turning over daily, real-time multi-location stock, barcode or RFID scanning, or you need automatic purchase orders raised the moment stock hits a reorder point, you have outgrown a dashboard and should be looking at a dedicated inventory management system. These templates are ideal for calculating and reporting the metrics, for planning, and for month-end review — but a live transactional system is the tool that keeps the numbers current between reports. If you are weighing that trade-off, our guides to Fishbowl alternatives and Cin7 alternatives compare template-based and software approaches honestly. For a broader starting point, see our best inventory management Excel templates.
Frequently asked questions
What are the most important inventory KPIs to track?
The five that matter most are inventory turnover, days inventory outstanding, inventory accuracy, order fill rate and GMROI. Together they cover speed, service and profit. Turnover and DIO show how fast cash cycles, accuracy and fill rate show service reliability, and GMROI shows whether the stock is actually earning its keep.
What is a good inventory turnover ratio?
For most retail and distribution businesses, 4–8 turns per year is healthy. Grocery, fresh food and fast fashion run much higher, while machinery, furniture and luxury goods sit lower. Compare your turnover to your own history and your direct sector, not to a universal number — the right target depends on margin and shelf life.
How do you calculate days inventory outstanding?
Days inventory outstanding equals (Average Inventory ÷ Cost of Goods Sold) × 365. It is the same information as inventory turnover expressed in days, so you can also compute it as 365 ÷ turnover ratio. A DIO of 45 means, on average, stock sits for 45 days before it sells.
What is the difference between inventory turnover and GMROI?
Turnover measures how many times you sell your stock; GMROI measures how much gross profit each dollar invested in that stock returns. A product can turn quickly on a thin margin and still have a poor GMROI. Buyers use GMROI to decide where to invest open-to-buy, because it blends speed and margin.
What is a good inventory accuracy rate?
97% is the accepted minimum for a functioning operation, and automated or best-in-class warehouses target 99% or higher. Accuracy below 95% means your system figures cannot be trusted for reordering, and you will either overstock defensively or run avoidable stockouts. Cycle counting across all ABC classes is how you raise it.
How is inventory carrying cost calculated?
Add annual storage, cost of capital, insurance, taxes, shrinkage and obsolescence, then divide by average inventory value and multiply by 100. The result is usually 15–30% per year. The cost of capital — the return you give up by holding stock instead of investing the cash — is the component teams most often forget, and often the largest.
Can I track inventory KPIs in Excel or Google Sheets?
Yes. Every KPI in this guide is a straightforward formula on transaction and stock data, which is exactly what Excel and Google Sheets do well. The dashboards above pre-build the formulas, charts and benchmarks so you only paste in your data. Power BI adds automatic refresh and location-level drill-down for larger operations.
How often should inventory KPIs be reviewed?
Review service metrics like stockout and fill rate weekly, financial metrics like turnover, DIO, carrying cost and GMROI monthly, and structural metrics like dead stock and inventory accuracy at least quarterly. Cycle-count accuracy should be sampled continuously rather than in one annual count, which is why a live dashboard beats a once-a-year stocktake.
What is the difference between order fill rate and line fill rate?
Order fill rate is the percentage of orders shipped complete; line fill rate is the percentage of individual order lines fulfilled. On a multi-line order, one missing item fails the whole order but only one line, so order fill is always the stricter number. Report whichever your customers actually experience.
Which inventory KPI dashboard should a small retailer buy?
Start with the Retail Inventory KPI Dashboard in Excel or Google Sheets at $12.99. It covers sell-through, stockout, GMROI and weeks of supply — the metrics that drive reorder and markdown decisions. If you also need turnover and carrying-cost reporting for finance, the $69.99 Master Kit works out cheaper than buying dashboards separately.
Get more inventory KPI templates
The best-value option is the Inventory & Warehouse Master Kit — 8 Excel, Google Sheets and VBA templates for $69.99, covering all 12 KPIs in this guide in one purchase. Prefer to track operational metrics from the factory floor instead? See our companion guide to the 12 manufacturing KPIs to track in 2026, or browse the full ranked list of inventory management Excel and VBA templates.
For walkthroughs of these dashboards in action, subscribe to NextGenTemplates on YouTube.
People-team metrics too? See our guide to the 15 HR KPIs to track in 2026.
Related reading: 10 recruitment KPIs to track in 2026 — with formulas, benchmark ranges and 8 ready-made dashboard templates.