

The 12 social media KPIs worth tracking in 2026 are engagement rate, follower growth rate, reach rate, impressions, amplification rate, video view-through rate, click-through rate, conversion rate, cost per click, cost per mille, social share of voice, and social media ROI. Each pairs a plain formula with a realistic benchmark so you know when a number is good.
Last updated: September 2026
Key takeaways
- A healthy organic engagement rate by reach sits between 1% and 5% on Instagram and Facebook, and 4%–8% on TikTok — anything measured against follower count instead of reach is inflated.
- Track social media KPIs in four buckets — awareness, engagement, conversion, and efficiency — not as one long vanity list.
- Organic reach rate has fallen to roughly 20%–35% of your followers per post, so paid amplification is now a measurement variable, not an afterthought.
- The eight NextGenTemplates dashboards in this guide calculate these metrics for you in Excel, Google Sheets, and Power BI, priced from $4.99 to $14.99.
- The Influencer Marketing KPI Dashboard in Excel ($14.99) is the most complete full-funnel option; the Social Media Influencer Tracking Dashboard in Google Sheets ($9.99) is the best value.
Social media KPI dashboards compared
| Template | Format | Best For | Price |
|---|---|---|---|
| Influencer Marketing KPI Dashboard (Best overall) | Excel | Full-funnel campaign measurement, reach to ROI | $14.99 |
| Influencer Engagement KPI Dashboard | Excel | Deep engagement and content analysis | $14.99 |
| Social Media Influencer Tracking Dashboard (Best value) | Google Sheets | Cloud, collaborative team tracking | $9.99 |
| Fan Engagement KPI Dashboard | Excel | Community, creator and media-brand audiences | $14.99 |
| Influencer Engagement KPI Dashboard | Power BI | Interactive, drill-down BI reporting | $11.99 |
| Customer Engagement KPI Dashboard | Power BI | Cross-channel engagement incl. social + CRM | $11.99 |
| Influencer Engagement KPI Dashboard | Google Sheets | Lightweight, free-to-run cloud tracking | $9.99 |
| Social Media Influencer Outreach Calendar | Excel | Campaign planning and outreach scheduling | $4.99 |
The 12 social media KPIs, with formulas and benchmarks
Every metric below follows the same pattern: a one-sentence definition, the exact formula, a realistic 2026 benchmark range, and the single mistake teams most often make with it. Skim the master table first, then read the notes on any metric your team argues about.
| Metric | Formula | 2026 benchmark | Where to see it |
|---|---|---|---|
| Engagement rate (by reach) | (Total engagements ÷ Reach) × 100 | 1%–5% (TikTok 4%–8%) | Engagement dashboard |
| Follower growth rate | (Net new followers ÷ Starting followers) × 100 | 1%–3% per month | Trend page |
| Reach rate | (Reach ÷ Total followers) × 100 | 20%–35% organic per post | Awareness KPIs |
| Impressions | Sum of all content views (incl. repeats) | Impressions-to-reach 1.5×–2.5× | Awareness KPIs |
| Amplification rate | (Shares ÷ Reach) × 100 | 0.5%–1%+ | Engagement dashboard |
| Video view-through rate | (Avg. watch time ÷ Video length) × 100 | 25%–35% average view | Content KPIs |
| Click-through rate (CTR) | (Link clicks ÷ Impressions) × 100 | 0.5%–1.5% | Conversion KPIs |
| Conversion rate | (Conversions ÷ Clicks from social) × 100 | 1%–3% | Conversion KPIs |
| Cost per click (CPC) | Ad spend ÷ Total clicks | $0.40–$1.00 (Meta) | Spend / efficiency |
| Cost per mille (CPM) | (Ad spend ÷ Impressions) × 1000 | $5–$12 (Meta) | Spend / efficiency |
| Social share of voice | (Your mentions ÷ Total category mentions) × 100 | Aim 20%–30%+ | Competitive KPIs |
| Social media ROI | ((Revenue − Cost) ÷ Cost) × 100 | Positive floor; 300%–500% mature | ROI summary |
1. Engagement rate (by reach)
The share of people who saw a post and then interacted with it. Divide total engagements (likes, comments, shares, saves) by reach and multiply by 100. A 1%–5% rate is healthy on Instagram and Facebook, while TikTok routinely runs 4%–8%. The mistake teams make is dividing by follower count instead of reach, which quietly hides declining organic distribution behind a big audience number.
2. Follower growth rate
How fast your audience is compounding, expressed as a percentage rather than a raw count. Take net new followers over the period, divide by the follower count you started with, and multiply by 100. For established accounts, 1%–3% per month is sustainable. The mistake is celebrating gross adds while ignoring unfollows — a net rate exposes churn that a running total conceals.
3. Reach rate
The percentage of your followers a post actually reached. Divide reach by total followers and multiply by 100. In 2026, organic reach rate typically lands at 20%–35% per post and keeps drifting down as feeds prioritise recommended content. The mistake is confusing reach with impressions; reach counts unique accounts, impressions count total views, and treating them as interchangeable overstates your true audience.
4. Impressions
The total number of times your content was displayed, including the same person seeing it more than once. There is no division — it is a running sum from the platform. A healthy impressions-to-reach ratio is roughly 1.5× to 2.5×; much higher and you are hitting the same small group repeatedly (ad frequency above 3–4 signals fatigue). The mistake is reporting impressions as if each one is a distinct person.
5. Amplification rate
How often your audience shares your content, which is the clearest signal that a post is spreading beyond your own followers. Divide shares by reach and multiply by 100. Anything at or above 0.5%–1% is strong for organic content. The mistake is optimising only for likes; likes flatter the post, but shares are what actually expand reach and feed the algorithm’s distribution.
6. Video view-through rate (VTR)
The percentage of a video the average viewer actually watches. Divide average watch time by total video length and multiply by 100. In feed environments, a 25%–35% average view is respectable, and a three-second view rate above 30% means your hook is landing. The mistake is counting a one-second auto-play as a “view” and reporting inflated totals that say nothing about retention.
7. Click-through rate (CTR)
The share of impressions that produced a link click to your site or offer. Divide link clicks by impressions and multiply by 100. Organic social CTR usually sits at 0.5%–1.5%, with well-targeted paid social in a similar band. The mistake is lumping profile taps, likes, and hashtag clicks into “clicks”; only link clicks belong in this number, or your funnel math breaks downstream.
8. Conversion rate
The percentage of social visitors who complete the action you care about — a purchase, sign-up, or lead. Divide conversions by clicks from social and multiply by 100. A 1%–3% rate is typical for social traffic, which converts lower than search because intent is weaker. The mistake is failing to tag links with UTM parameters, so conversions get misattributed to “direct” and social looks like it drives nothing.
9. Cost per click (CPC)
What you pay, on average, for one click on a paid post. Divide total ad spend by total clicks. On Meta, $0.40–$1.00 is a normal range; LinkedIn runs far higher at $5–$8 because of its audience. The mistake is chasing the lowest possible CPC and buying cheap, low-intent clicks that never convert — always read CPC next to conversion rate, never alone.
10. Cost per mille (CPM)
The cost to serve one thousand impressions, the standard currency for awareness campaigns. Divide ad spend by impressions and multiply by 1,000. Meta CPMs commonly fall between $5 and $12, while LinkedIn can reach $25–$35. The mistake is judging an awareness campaign on CPC or conversions; when the goal is reach, CPM and reach rate are the honest scoreboard.
11. Social share of voice (SSoV)
Your slice of the total conversation in your category. Divide your brand mentions by all mentions of you plus your named competitors, then multiply by 100. A share above 20%–30% signals category leadership. The mistake is measuring your own volume in isolation; share of voice is only meaningful relative to competitors, so tracking mentions without a denominator tells you nothing about position.
12. Social media ROI
Whether the whole programme makes money. Subtract total cost (ad spend plus tooling and time) from attributed revenue, divide by cost, and multiply by 100. A positive number is the floor; mature programmes target 300%–500% (a 3x–5x return). The mistake is counting only ad spend as “cost” and ignoring the labour hours, which makes an unprofitable programme look healthy on paper.
How we picked these dashboards
We searched the NextGenTemplates catalogue of 900+ paid templates for tools that calculate the twelve metrics above without manual spreadsheet surgery. We required each pick to ship with pre-built formulas, a trend view, and input sheets separating actuals from targets, and we deliberately included Excel, Google Sheets, and Power BI so a team can match the tool to the stack it already runs. Planning-only or single-metric files were excluded; every dashboard here computes engagement, reach, and efficiency KPIs out of the box.
The 8 best social media KPI dashboard templates for 2026
1. Influencer Marketing KPI Dashboard in Excel — best overall

A full-funnel campaign dashboard that maps spend all the way to return. It is the most complete option because it covers every bucket of social media KPIs — reach and impressions at the top, engagement and amplification in the middle, and CPC, CPM, and ROI at the bottom.
- Who it is for: marketing managers running paid and influencer campaigns who report to a budget owner.
- What is inside: a KPI summary page, a trend view, actual-vs-target input sheets, and campaign-level ROI roll-ups.
- Track cost per click against conversion rate side by side so a cheap-click campaign cannot hide a weak funnel.
- Roll a $10,000 monthly budget across five creators and see blended CPM and ROI in one cell.
- Benchmark this quarter’s engagement rate against last quarter without rebuilding a single formula.
Price: $14.99. Get the Influencer Marketing KPI Dashboard in Excel →
Best for: teams that need one file from ad spend to ROI.
2. Influencer Engagement KPI Dashboard in Excel — best for engagement depth
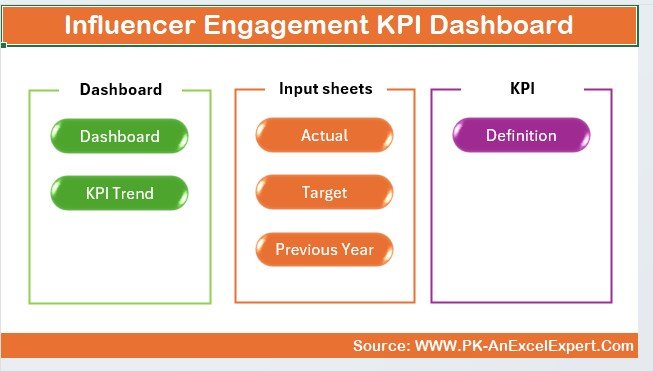
This dashboard drills into engagement and content quality rather than spend. If your reporting question is “which posts and creators actually earn interaction,” this is the sharper tool.
- Who it is for: content and community teams optimising creative, not just budget.
- What is inside: engagement-rate and amplification-rate calculations, a KPI trend page, and per-post input sheets.
- Compare average engagement rate across creators to renew the ones beating the 1%–5% band.
- Spot the amplification-rate outliers — the posts being shared, not just liked.
Price: $14.99. Get the Influencer Engagement KPI Dashboard in Excel →
Best for: content teams focused on engagement quality.
3. Social Media Influencer Tracking Dashboard in Google Sheets — best value

A cloud-native tracker built for teams that live in Google Workspace. At $9.99 it delivers the core social media KPIs with the collaboration and zero-install advantages of Sheets, which is why it is our best-value pick.
- Who it is for: distributed teams and agencies who need multiple editors in one live file.
- What is inside: engagement, reach, and follower-growth tracking with charts that update as rows are added.
- Share view-only links with clients without exporting a single screenshot.
- Log posts from a phone and watch the KPI cards recalculate instantly.
Price: $9.99. Get the Social Media Influencer Tracking Dashboard in Google Sheets →
Best for: collaborative teams on Google Workspace.
4. Fan Engagement KPI Dashboard in Excel — best for community audiences

Purpose-built for creators, sports properties, and media brands whose asset is an engaged community. It frames the same engagement and growth metrics around audience loyalty rather than campaign spend.
- Who it is for: creators and media brands measuring community health.
- What is inside: engagement rate, growth rate, and interaction-mix tracking with a trend page.
- Watch whether your most loyal segment’s engagement is holding as the audience scales.
- Separate reach-driven spikes from durable, repeat engagement.
Price: $14.99. Get the Fan Engagement KPI Dashboard in Excel →
Best for: creators and community-led brands.
5. Influencer Engagement KPI Dashboard in Power BI — best for interactive BI
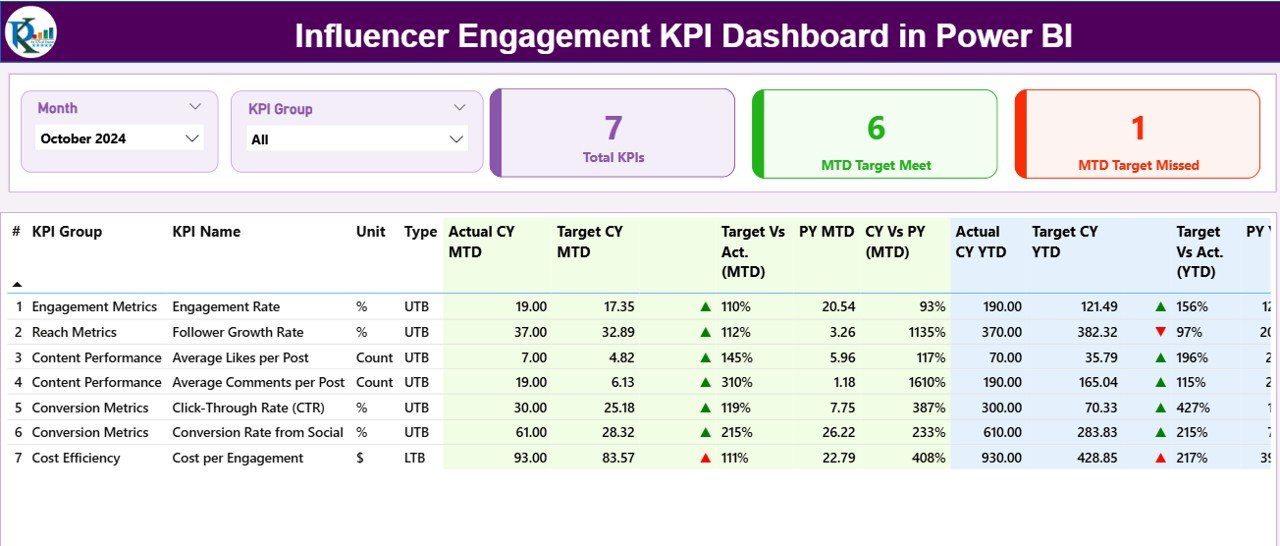
The same engagement model as our Excel pick, rebuilt for Power BI so you can slice, filter, and drill without touching a formula. Ideal when leadership wants an interactive report, not a static grid.
- Who it is for: data-mature teams already standardised on Power BI.
- What is inside: a semantic model, KPI tiles, trend visuals, and drill-through pages.
- Filter engagement rate by platform, creator, or month with a single click.
- Publish to the Power BI service for always-current executive dashboards.
Price: $11.99. Get the Influencer Engagement KPI Dashboard in Power BI →
Best for: interactive, drill-down reporting.
6. Customer Engagement KPI Dashboard in Power BI — best for cross-channel view

When social is one channel inside a wider engagement picture, this dashboard connects social interaction to overall customer engagement, so you can see how social contributes rather than reporting it in a silo.
- Who it is for: lifecycle and CRM teams blending social with email and product engagement.
- What is inside: multi-channel engagement KPIs, trend analysis, and segment breakdowns.
- See whether social-sourced audiences engage more or less than other channels.
- Tie engagement movements to retention rather than to a single post.
Price: $11.99. Get the Customer Engagement KPI Dashboard in Power BI →
Best for: cross-channel engagement analysis.
7. Influencer Engagement KPI Dashboard in Google Sheets — best lightweight cloud option

A no-install, browser-based version of the engagement dashboard for teams that want a free runtime and quick sharing without buying Excel or Power BI licences.
- Who it is for: freelancers and lean teams who want engagement tracking with zero software cost.
- What is inside: engagement and growth KPIs, auto-updating charts, and simple input tabs.
- Duplicate the sheet per client to keep engagements cleanly separated.
- Run it entirely in the browser on any device.
Price: $9.99. Get the Influencer Engagement KPI Dashboard in Google Sheets →
Best for: lean, browser-first teams.
8. Social Media Influencer Outreach Calendar in Excel — best budget planning companion
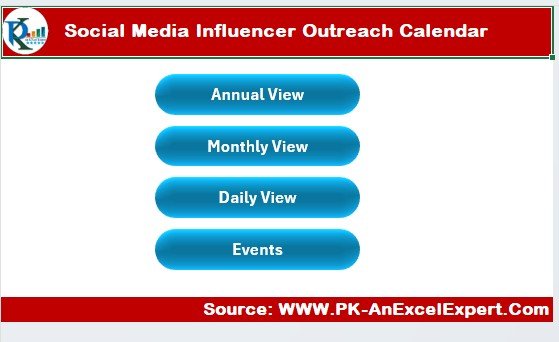
At $4.99, this is the planning layer that feeds your KPI dashboard. You cannot measure campaigns you never scheduled, and this calendar keeps outreach, posting cadence, and follow-ups organised before the numbers ever land.
- Who it is for: anyone coordinating multiple creators or a busy content calendar.
- What is inside: an outreach tracker, scheduling grid, and status columns.
- Sequence campaign launches so your reach and engagement data is clean to analyse.
- Pair it with any dashboard above as the input-planning front end.
Price: $4.99. Get the Social Media Influencer Outreach Calendar in Excel →
Best for: planning campaigns on a budget.
How to choose between them
| If you need… | Choose | Price |
|---|---|---|
| One file from spend to ROI | Influencer Marketing KPI Dashboard (Excel) | $14.99 |
| Deep engagement analysis in Excel | Influencer Engagement KPI Dashboard (Excel) | $14.99 |
| Cloud collaboration on a budget | Social Media Influencer Tracking Dashboard (Sheets) | $9.99 |
| Interactive, filterable reporting | Influencer Engagement KPI Dashboard (Power BI) | $11.99 |
| Social inside a cross-channel view | Customer Engagement KPI Dashboard (Power BI) | $11.99 |
| Just to plan the campaign first | Social Media Influencer Outreach Calendar (Excel) | $4.99 |
Rule of thumb: pick the format your team already opens daily. A Power BI dashboard nobody publishes is worth less than a Google Sheet everyone updates. If you are unsure, start with the Google Sheets tracker and graduate to Excel or Power BI when your reporting outgrows it.
When a social media KPI dashboard is NOT the right answer
A spreadsheet dashboard is the right tool for a team measuring a handful of accounts and campaigns on a weekly or monthly cadence. It is the wrong tool in three cases. First, if you manage dozens of accounts and need real-time alerting, a dedicated platform such as Sprout Social or Hootsuite — billed per seat monthly — will pull data automatically where a spreadsheet needs manual entry. Second, if you require live API pulls from every network with no copy-paste, buy software, not a template. Third, if your only question is “did this one post do well,” the native in-app analytics answer it for free. Templates win when you need a consistent, owned, cross-platform scorecard that survives a tool cancellation — which is exactly why balanced buyers keep both.
Frequently asked questions
What are the most important social media KPIs to track in 2026?
The essentials are engagement rate, reach rate, follower growth rate, click-through rate, conversion rate, and social media ROI. Together they cover awareness, engagement, and return. Vanity totals like raw follower count matter far less than rate-based metrics that show whether your distribution and conversion are actually improving over time.
How do you calculate social media engagement rate?
Divide total engagements (likes, comments, shares, and saves) by reach, then multiply by 100. Using reach rather than follower count is important because it measures the people who genuinely saw the post. A result between 1% and 5% is healthy on most networks, while TikTok commonly runs higher at 4% to 8%.
What is a good engagement rate on social media?
On Instagram and Facebook, an organic engagement rate of 1% to 5% by reach is considered healthy, and above 6% is excellent. TikTok tends to run higher at 4% to 8% because of its recommendation engine. Always compare against your own historical baseline and your specific industry, not a single global average.
What is the difference between reach and impressions?
Reach counts the number of unique accounts that saw your content, while impressions count the total number of times it was displayed, including repeat views by the same person. Impressions will always be equal to or higher than reach. A ratio of roughly 1.5 to 2.5 times reach is normal; much higher suggests you are repeatedly hitting a small audience.
How do you measure social media ROI?
Subtract total cost — ad spend plus tooling and labour — from the revenue attributed to social, divide by that cost, and multiply by 100. A positive number is the minimum bar, and mature programmes target 300% to 500%. Accurate attribution through UTM tracking is essential, or revenue will be credited to the wrong channel.
Which social media KPIs matter for paid advertising?
For paid campaigns, focus on cost per click, cost per mille, click-through rate, conversion rate, and ROI. CPM tells you the cost of awareness, CPC the cost of interest, and conversion rate whether that interest turns into action. Reading CPC alongside conversion rate stops you from buying cheap clicks that never convert.
How often should I report on social media KPIs?
Most teams review engagement and reach weekly to catch content trends, and report the full KPI set — including ROI and share of voice — monthly to leadership. Daily monitoring only pays off during active paid campaigns or launches. A ready-made dashboard makes the monthly roll-up a copy-paste exercise rather than an afternoon of manual work.
Can I track social media KPIs in Excel or Google Sheets?
Yes. A pre-built template like the NextGenTemplates dashboards in this guide calculates engagement, reach, conversion, and ROI from data you paste in, in Excel, Google Sheets, or Power BI. Spreadsheets suit teams tracking a handful of accounts on a weekly or monthly cadence; dedicated software makes more sense only at large account volumes needing real-time API pulls.
What is social share of voice and how is it calculated?
Social share of voice is your percentage of the total conversation in your category. Divide your brand mentions by the combined mentions of you and your named competitors, then multiply by 100. A share above 20% to 30% signals category leadership. Because it is relative, tracking your mentions without a competitor denominator tells you nothing about your position.
Which dashboard should a small team start with?
Start with the Social Media Influencer Tracking Dashboard in Google Sheets at $9.99. It runs free in the browser, supports multiple editors, and covers the core metrics. Upgrade to the Excel or Power BI dashboards when you need deeper analysis or interactive, drill-down reporting for stakeholders.
Get more social media KPI templates
Measuring the right social media KPIs is the difference between a report that gets ignored and one that changes the next campaign. The eight NextGenTemplates dashboards above hand you the formulas and benchmarks already wired in, from the $4.99 outreach calendar to the $14.99 Influencer Marketing KPI Dashboard in Excel. Pick the format your team lives in and you will spend your time acting on the numbers instead of building the sheet.
Explore related KPI guides across the catalogue: 15 marketing KPIs to track in 2026, 15 sales KPIs to track, 10 CRM metrics to track, 10 recruitment KPIs, 10 procurement KPIs, and 12 manufacturing KPIs. For benchmark context, the Rival IQ Social Media Industry Benchmark Report publishes engagement-rate figures by industry each year.
Watch build walkthroughs and template demos on the NextGenTemplates YouTube channel.