

The best publishing dashboard for most media and publishing teams in 2026 is the Publishing KPI Dashboard in Excel ($14.99): one sheet tracks advertising, audience engagement, content production, conversion, email and subscriber growth KPIs against target and last year. For printing-heavy publishers, the Publishing Industry KPI Dashboard in Power BI costs $11.99. Six more ranked picks follow.
Last updated: October 2026
Key takeaways
- Best overall media publishing dashboard template: the Publishing KPI Dashboard in Excel at $14.99, covering advertising, audience, content production, conversion, email and growth KPIs in one view.
- Best value: the Publishing Industry KPI Dashboard in Power BI at $11.99, with 14 production, quality, delivery and margin KPIs for print publishers.
- All eight templates are one-time purchases between $11.99 and $14.99; audience-analytics platforms for publishers usually sell on annual, quote-based contracts.
- Three formats are covered (Excel, Google Sheets and Power BI), so a newsroom, a magazine and a media agency can each use the tool it already knows.
- Every pick compares month-to-date and year-to-date actuals against target and previous year, with green and red arrows that show which KPI moved.
Publishing dashboard templates compared
| Template | Format | Best For | Price |
|---|---|---|---|
| Publishing KPI Dashboard | Excel | Best overall: digital publishers tracking ads, audience and subscribers | $14.99 |
| Publishing Industry KPI Dashboard | Power BI | Best value: print publishers tracking production, quality and margin | $11.99 |
| Content Marketing KPI Dashboard | Excel | Content teams and brand publishers measuring traffic and ROI | $14.99 |
| Mass Media KPI Dashboard | Power BI | Broadcasters and media houses across TV, radio, print and online | $11.99 |
| Media Planning KPI Dashboard | Excel | Media planners comparing reach, CTR and ROI across channels | $14.99 |
| Media Buying KPI Dashboard | Google Sheets | Media buyers controlling ad spend, CPC and CTR as a team | $12.99 |
| SEO Content Performance KPI Dashboard | Excel | Online publishers whose traffic depends on organic search | $14.99 |
| Social Media ROI KPI Dashboard | Google Sheets | Social desks proving the revenue return of social channels | $12.99 |
How we picked these media and publishing templates
We searched the full NextGenTemplates catalogue of Excel, Google Sheets and Power BI products for publishing, media, content, advertising and audience tools, then kept the eight that a media business would open every month. Each pick had to track real media KPIs (not decorative charts), compare actuals against both target and the previous year, and be editable without a consultant.
We left out generic sales dashboards with no audience or advertising logic, and duplicate editions of the same file in another format. Prices are the current one-time list prices on each product page. KPI definitions follow standard industry usage; where Google Analytics 4 defines a metric differently from older tools, we follow Google’s own GA4 definition of engagement rate and bounce rate.
Why media and publishing teams need a dashboard template
A typical publisher’s numbers live in five places: Google Analytics for audience, an ad server for impressions and revenue, a subscription platform for sign-ups and churn, an email tool for newsletter growth, and a spreadsheet of production costs. Every month someone rebuilds the same report by hand, and by the time it is finished the month is over.
The alternative most teams look at is a dedicated audience-analytics platform such as Chartbeat or Parse.ly. Those tools are excellent for real-time editorial decisions, but they are sold on annual, quote-based contracts and they do not know your print costs, your ad targets or last year’s subscription numbers. A media publishing dashboard template fills that gap: it holds the monthly business KPIs, sets them against target and previous year, and shows which numbers need attention, for a one-time price under $15.
The 8 best media and publishing dashboard templates for 2026
1. Publishing KPI Dashboard in Excel (best overall)
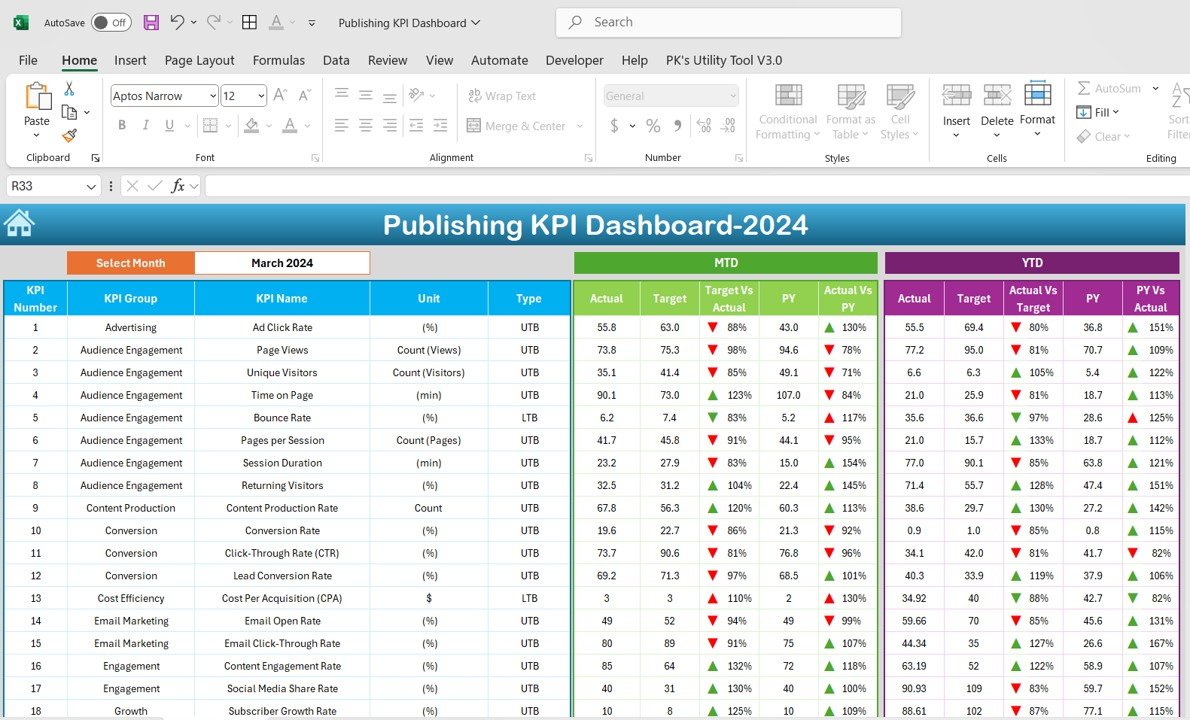
This is the most complete publishing dashboard in the roundup, which is why it ranks first. It is the only pick that brings advertising, audience engagement, content production, conversion, cost efficiency, email marketing and subscriber growth into one KPI table, so an editor-in-chief and a commercial director read the same page.
Who it is for: digital publishers, magazine and newsletter businesses, and editorial teams that report monthly to an owner or board and already work in Excel.
- KPIs grouped by Advertising, Audience Engagement, Content Production, Conversion, Cost Efficiency, Email Marketing, Engagement and Growth, including Ad Click Rate, Page Views, Unique Visitors, Time on Page, Bounce Rate, Returning Visitors, Cost per Acquisition, Email Open Rate and Subscriber Growth Rate.
- A month selector that recalculates every MTD and YTD figure: actual, target, actual vs target and previous year.
- Separate input sheets for Actual, Target and Previous Year, a KPI Trend sheet and a KPI Definition sheet.
- Green and red arrows that respect each KPI’s direction, so a falling bounce rate shows as good news.
Concrete uses: spot that page views beat target by 8% while the ad click rate fell, and open a conversation with sales before revenue slips; show the board that subscriber growth is ahead of last year YTD; and catch a rising cost per acquisition in month two rather than month six. Price: $14.99. Get the Publishing KPI Dashboard in Excel →
Best for: the publisher that wants one Excel view of audience, ads and subscribers.
2. Publishing Industry KPI Dashboard in Power BI (best value)
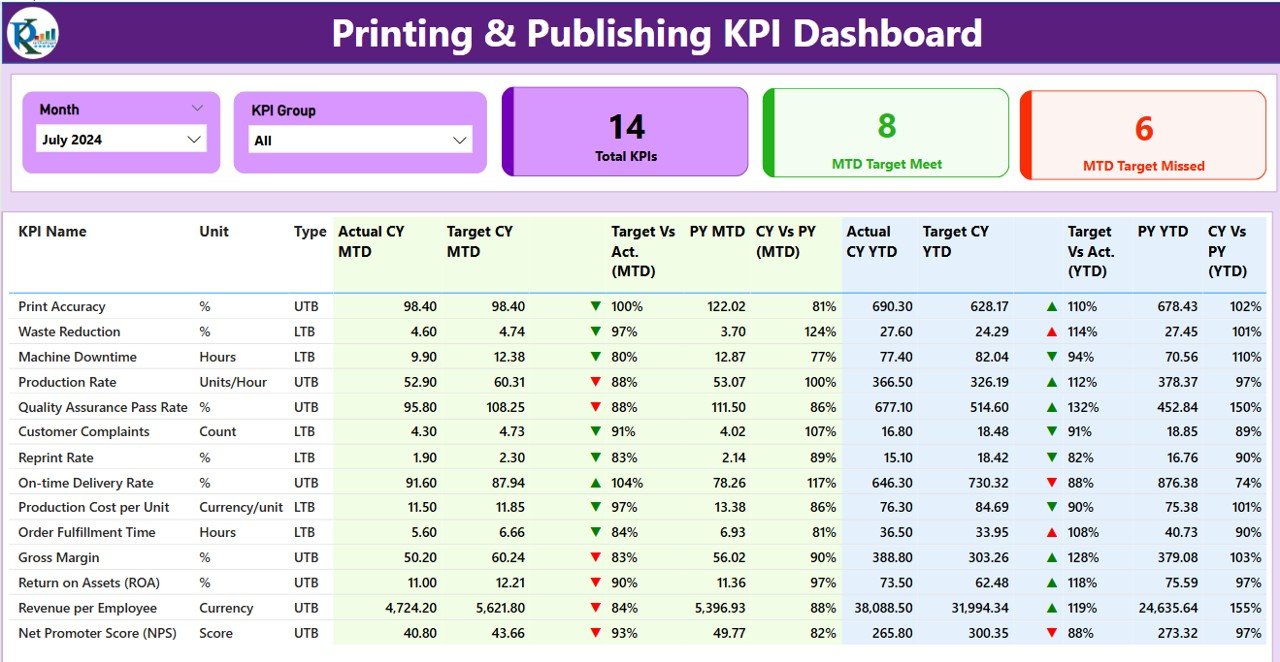
Not every publisher is purely digital. Book, magazine and catalogue publishers still run presses or buy print, and their margin depends on waste, downtime and on-time delivery. This Power BI report is built for that side of the business, and at $11.99 it is the lowest-priced pick here.
Who it is for: print publishers, printing houses and production managers who need operations and finance KPIs in one report.
- 14 KPIs, including Print Accuracy, Waste Reduction, Machine Downtime, Production Rate, Quality Assurance Pass Rate, Reprint Rate, On-time Delivery Rate, Production Cost per Unit, Order Fulfillment Time, Gross Margin and Revenue per Employee.
- Header cards showing Total KPIs, MTD Target Met and MTD Target Missed at a glance.
- Month and KPI Group slicers, with CY vs target and CY vs previous-year columns for MTD and YTD.
Concrete uses: see that 6 of 14 KPIs missed target this month and drill straight into the production group; track whether a new press cut the reprint rate; and compare cost per unit with gross margin before quoting a new title. Price: $11.99. Get the Publishing Industry KPI Dashboard in Power BI →
Best for: publishers whose biggest costs sit on the production floor.
3. Content Marketing KPI Dashboard in Excel
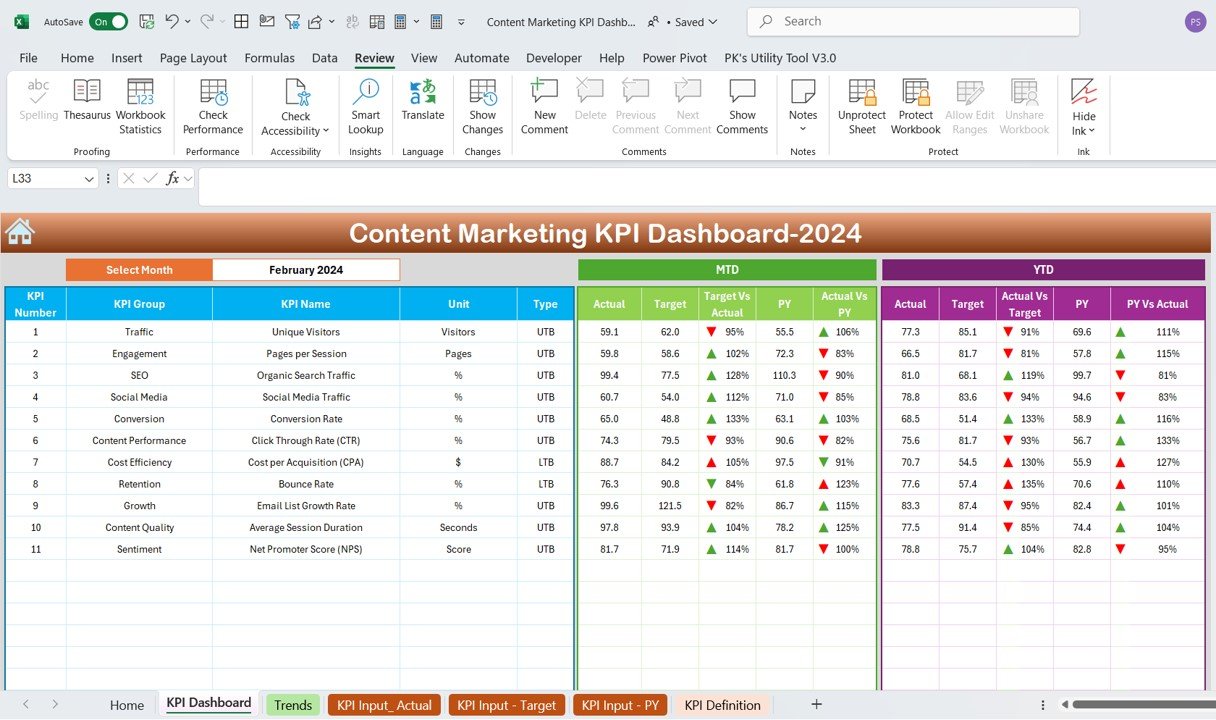
Brand publishers and content teams care less about ad inventory and more about whether content brings traffic, leads and sales. This dashboard measures exactly that with 11 focused KPIs.
Who it is for: content marketing managers, B2B publishers, agencies running blogs for clients, and in-house brand studios.
- KPIs for Unique Visitors, Pages per Session, Organic Search Traffic, Social Media Traffic, Conversion Rate, Click-Through Rate, Cost per Acquisition, Bounce Rate, Email List Growth Rate, Average Session Duration and Net Promoter Score.
- Sheets for Home, KPI Dashboard, Trends, KPI Input (Actual, Target and Previous Year) and KPI Definition.
- MTD and YTD actual vs target and vs previous year, driven by a single month selector.
Concrete uses: prove that organic search traffic grew 20% YTD after a content refresh; compare the cost per acquisition of content against paid ads; and flag a falling email list growth rate before the newsletter stalls. Price: $14.99. Get the Content Marketing KPI Dashboard in Excel →
Best for: teams that must show content’s return in traffic and conversions.
4. Mass Media KPI Dashboard in Power BI

Media houses that run TV, radio, print and online brands together need one report that covers advertising, audience and operations. This Power BI template does that with 15 KPIs across six groups and an $11.99 price.
Who it is for: broadcasters, regional media groups and multi-channel media companies with an analyst who works in Power BI.
- 15 KPIs in Advertising Efficiency, Audience Engagement, Audience Retention, Content Quality, Operational Efficiency and Social Media Performance groups.
- KPIs include Cost per Click, Click-Through Rate, Ad Revenue, Cost per Mille, Audience Reach, Engagement Rate, Repeat Visits, Content Quality Score, Cost per Content Piece, Production Time and Social Media Followers.
- Total KPIs, MTD Target Met and MTD Target Missed cards, plus a drill-through to each KPI’s definition.
Concrete uses: compare CPM against ad revenue to see whether inventory is under-priced; watch production time against cost per content piece; and report audience reach and repeat visits to advertisers each month. Price: $11.99. Get the Mass Media KPI Dashboard in Power BI →
Best for: multi-channel media houses that want one Power BI view.
5. Media Planning KPI Dashboard in Excel
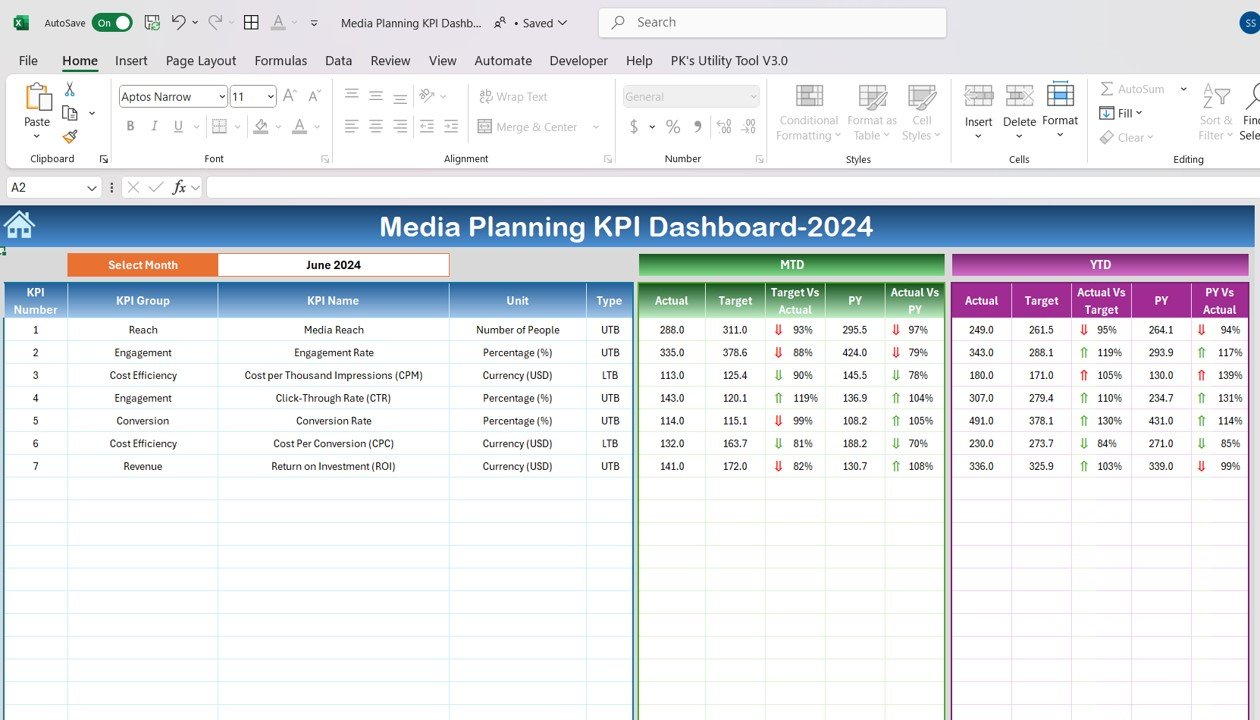
Media planners decide where the budget goes before the campaign runs, then have to prove it was the right call. This dashboard tracks the planning KPIs across digital, social and traditional channels in one place.
Who it is for: media planners, agency account teams and in-house advertising managers who plan cross-channel campaigns.
- Tracks reach, impressions, engagement, click-through rate, conversions and ROI against budget.
- Cross-platform view for digital ads, social media and traditional media such as TV and radio.
- Dashboard, KPI Trend, Actual, Target, Previous Year and Definition sheets, with MTD and YTD comparisons.
Concrete uses: show a client that CTR beat plan in March while cost per acquisition rose; shift next quarter’s budget toward the channel with the best ROI; and keep last year’s actuals beside this year’s plan for the annual review. Price: $14.99. Get the Media Planning KPI Dashboard in Excel →
Best for: planners who must justify channel mix with numbers.
6. Media Buying KPI Dashboard in Google Sheets
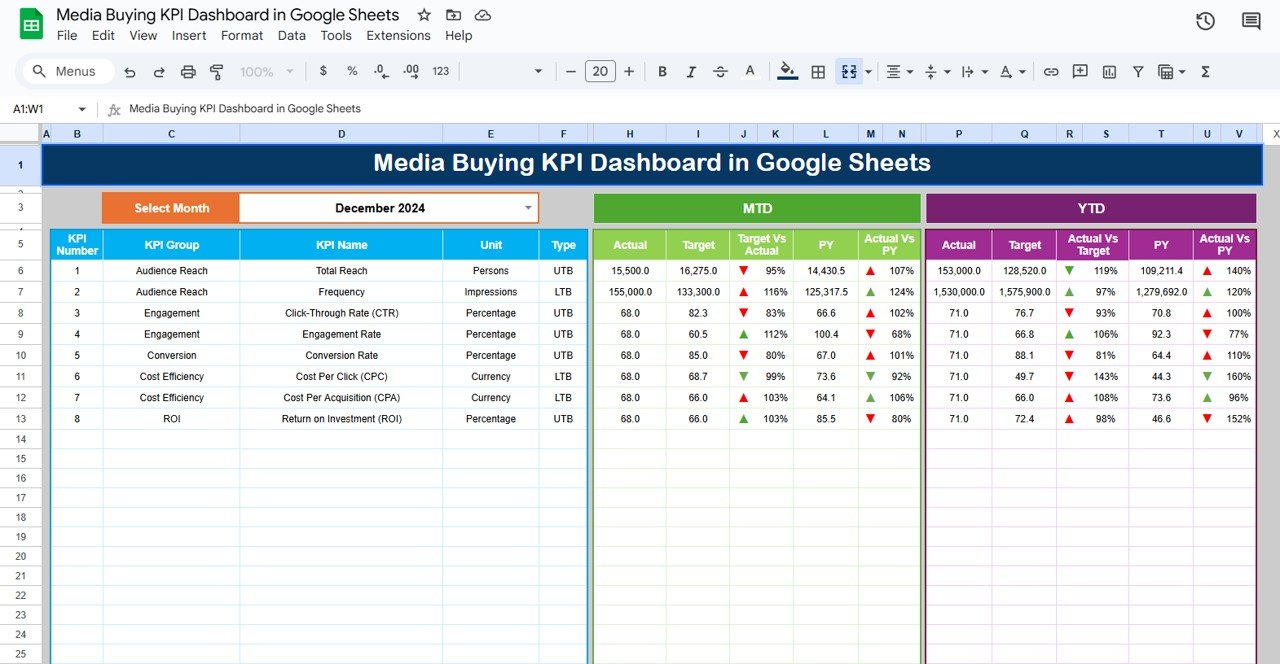
Media buying is a team sport: traders, analysts and account managers all touch the same numbers. Built in Google Sheets, this dashboard lets the whole team update and read one file from any browser.
Who it is for: media buyers, performance agencies and publishers that buy traffic for their own titles.
- Six sheets: Dashboard, KPI Trend, Actual Numbers, Targets, Previous Year Data and KPI Definitions.
- Month dropdown that refreshes MTD and YTD actual, target and previous-year comparisons.
- KPI Trend view for metrics such as CPC, CTR and impressions, with each KPI’s formula and type documented.
Concrete uses: catch a CPC that climbed 15% over target mid-quarter; share one live link with a client instead of emailing exports; and compare this year’s impressions with last year’s for the same month. Price: $12.99. Get the Media Buying KPI Dashboard in Google Sheets →
Best for: buying teams that need one shared, browser-based file.
7. SEO Content Performance KPI Dashboard in Excel
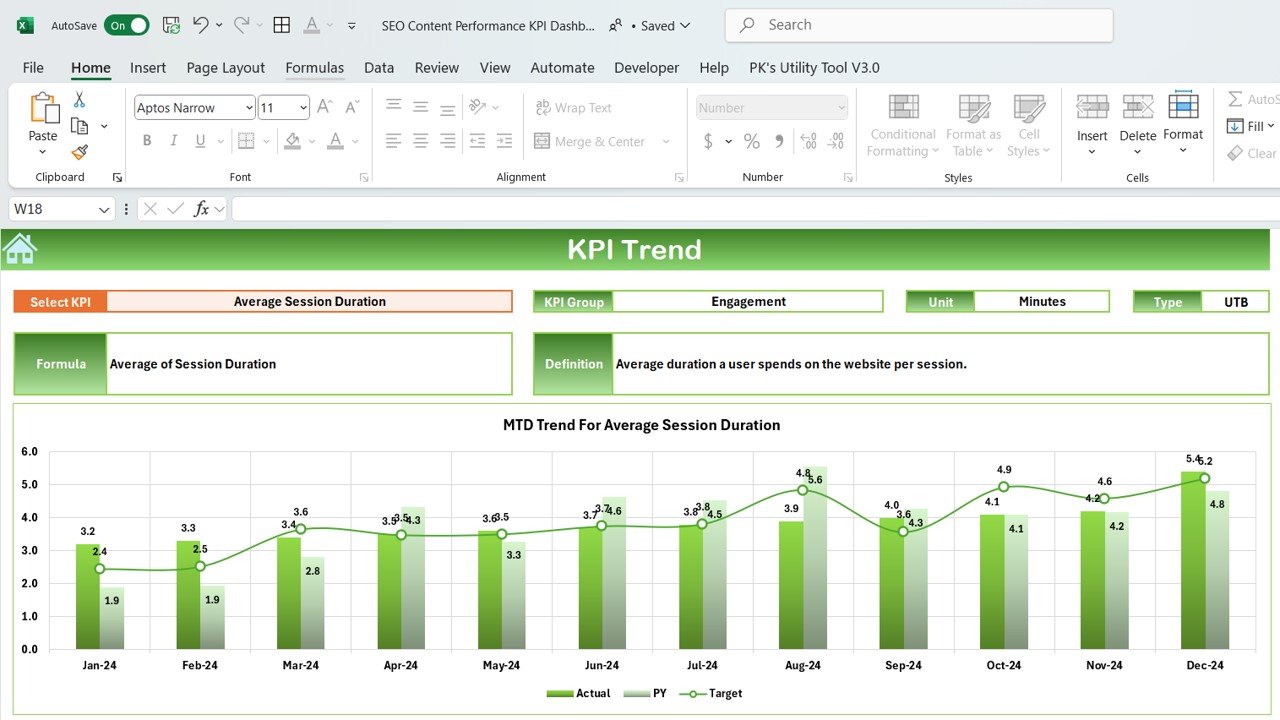
For many online publishers, organic search is the biggest traffic source and the one most exposed to algorithm updates. This dashboard isolates the SEO and engagement metrics that show whether content is holding its search visibility.
Who it is for: SEO editors, audience development leads and niche publishers whose revenue follows organic traffic.
- Tracks keyword rankings, organic traffic, bounce rate, average session duration and pages per session.
- Dashboard, KPI Trend, Actual, Target, Previous Year and Definition sheets.
- KPI Trend charts that plot a metric such as Average Session Duration month by month against target and previous year.
Concrete uses: see within one month whether a core update dented organic traffic; check that session duration held up after a site redesign; and set realistic organic-growth targets from last year’s actuals. Price: $14.99. Get the SEO Content Performance KPI Dashboard in Excel →
Best for: publishers that live and die by search traffic. See also our guide to the 12 SEO KPIs to track in 2026.
8. Social Media ROI KPI Dashboard in Google Sheets

Social channels drive reach for every media brand, but the question from management is always the same: what did it earn? This dashboard ties social activity to leads, revenue and ROI.
Who it is for: social media editors, audience teams and media agencies that run paid and organic social.
- Tracks engagement, reach, impressions, CPC, CTR, conversions, leads, customer acquisition cost and ROI.
- Month dropdown with MTD, YTD, target and previous-year comparisons and up/down arrows.
- Dynamic trend charts for every KPI, editable by the whole team in Google Sheets.
Concrete uses: show that paid social returned more per dollar than display; compare customer acquisition cost across months; and give the social desk a target to work toward. Price: $12.99. Get the Social Media ROI KPI Dashboard in Google Sheets →
Best for: social teams that must prove revenue, not just reach. Pair it with our list of 12 social media KPIs to track in 2026.
Short on time? Start with the best overall Publishing KPI Dashboard in Excel ($14.99). If you also run print, add the Publishing Industry KPI Dashboard in Power BI ($11.99). Both together cost $26.98, once.
The media and publishing KPIs every dashboard should show
Whichever template you choose, these are the formulas behind the numbers. Enter the monthly totals and each template does the arithmetic.
| KPI | Formula | Direction |
|---|---|---|
| Click-through rate (CTR) | Clicks ÷ impressions × 100 | Higher is better |
| Cost per mille (CPM) | Ad spend ÷ impressions × 1,000 | Lower is better for buyers; higher for sellers |
| Cost per click (CPC) | Ad spend ÷ clicks | Lower is better |
| Page RPM | Ad revenue ÷ page views × 1,000 | Higher is better |
| Bounce rate (GA4) | 100% − engagement rate | Lower is better |
| Subscriber growth rate | (Subscribers at end − subscribers at start) ÷ subscribers at start × 100 | Higher is better |
| Subscriber churn rate | Cancellations in period ÷ subscribers at start × 100 | Lower is better |
| Cost per acquisition (CPA) | Marketing spend ÷ new subscribers or customers | Lower is better |
| Content ROI | (Revenue attributed to content − content cost) ÷ content cost × 100 | Higher is better |
| Production cost per unit | Total production cost ÷ units produced | Lower is better |
Two rules make these numbers useful. First, set the target from your own previous-year column rather than from an industry average, because audience mix and ad formats vary too much between publishers. Second, mark each KPI’s direction correctly in the KPI Definition sheet (upper-the-better or lower-the-better), so the arrows turn green for a falling churn rate and red for a rising one. For a wider view of how KPI targets work, see the general overview of performance indicators.
How to choose the right publishing dashboard template
| If your main question is… | Choose |
|---|---|
| Are audience, ads and subscribers on target? | Publishing KPI Dashboard in Excel |
| Is our print production efficient and profitable? | Publishing Industry KPI Dashboard in Power BI |
| Is our content bringing traffic and leads? | Content Marketing KPI Dashboard in Excel |
| How are all our TV, radio, print and online brands doing? | Mass Media KPI Dashboard in Power BI |
| Did the media plan deliver the reach and ROI we promised? | Media Planning KPI Dashboard in Excel |
| Is our ad spend under control, week to week, as a team? | Media Buying KPI Dashboard in Google Sheets |
| Is organic search traffic holding up? | SEO Content Performance KPI Dashboard in Excel |
| What does social media actually earn us? | Social Media ROI KPI Dashboard in Google Sheets |
Then pick the format. Choose Excel if one person owns the report. Choose Google Sheets if several people update it. Choose Power BI if you present on screen and want slicers and drill-through. If you are comparing Power BI options across other industries too, our Power BI dashboard templates ranked by industry is a useful next read.
When a template is NOT the right answer
A monthly KPI template is the wrong tool in four situations, and it is better to know that before you buy.
- You need real-time editorial data. If your homepage editors move stories based on what is trending in the last five minutes, you need a live audience tool such as Chartbeat or Parse.ly. These templates are built for monthly management reporting.
- You need automatic data connections. The templates do not pull from Google Analytics, your ad server or your paywall automatically. Someone enters the month’s totals, which usually takes 15–30 minutes.
- You run programmatic ad operations at scale. Yield optimisation across many demand partners belongs in your ad server’s reporting, not in a spreadsheet.
- You need a subscriber CRM. These dashboards report subscriber totals and growth; they do not store individual subscriber records, billing or renewals.
For most small and mid-sized publishers, agencies and media teams, though, the monthly report is exactly the gap, and a template closes it at a fraction of the cost of software.
Frequently asked questions
What is a publishing dashboard template?
A publishing dashboard template is a ready-made Excel, Google Sheets or Power BI file that turns your monthly numbers into KPI views. You type actuals, targets and last year's figures into input sheets, and the dashboard shows month-to-date and year-to-date performance for page views, subscribers, ad revenue, conversions and costs, with no formulas to write.
How much does a media publishing dashboard template cost?
The eight templates in this roundup cost between $11.99 and $14.99 each, as one-time purchases. The two Power BI picks are $11.99, the two Google Sheets picks are $12.99 and the four Excel picks are $14.99. Buying the top two together costs $26.98, less than a single month of most audience-analytics subscriptions.
Which KPIs should a publishing dashboard track?
Track audience (page views, unique visitors, returning visitors, time on page, bounce rate), revenue (ad click rate, ad revenue, subscription revenue), growth (subscriber growth rate, email list growth), efficiency (cost per acquisition, content production rate) and conversion rate. The Publishing KPI Dashboard in Excel covers all of these groups on one sheet.
Is Excel, Google Sheets or Power BI better for a media company?
Excel suits one owner who updates the numbers monthly and emails a report. Google Sheets suits a newsroom or agency team that edits the same file from different places. Power BI suits a larger publisher that presents on screen and wants slicers and drill-through. All three formats run the same monthly MTD and YTD logic.
Can these templates connect to Google Analytics automatically?
No. These are monthly KPI templates: you copy the month's totals from Google Analytics, your ad server and your subscription platform into the Actual input sheet. That takes about 15–30 minutes a month. If you need live, minute-by-minute audience data, a real-time analytics tool is the better choice.
How is bounce rate calculated in GA4?
In GA4, bounce rate is the percentage of sessions that were not engaged, so it equals 100% minus the engagement rate. A session counts as engaged when it lasts longer than 10 seconds, records a key event or has two or more page views. Enter the monthly GA4 figure into your dashboard as a lower-the-better KPI.
What is the difference between a KPI dashboard and a KPI scorecard?
A KPI dashboard adds charts and trend views, such as the KPI Trend sheet in these templates, to explore one metric over twelve months. A scorecard is a single table of actual versus target. All eight picks here are dashboards: each has a summary table with MTD and YTD columns plus a separate trend view.
Can I change the KPIs or add my own?
Yes. Every template has a KPI Definition sheet listing each KPI's group, name, unit, formula and type (upper-the-better or lower-the-better). Rename a KPI or change its unit there, then enter its monthly actuals and targets. The dashboard, arrows and trend charts pick up the change without editing formulas.
Do I need Power BI Pro to use the Power BI templates?
No. You can open, edit and refresh the Power BI templates in the free Power BI Desktop app on Windows. You only need a Power BI Pro or Premium licence if you want to publish the report to the Power BI service and share it online with colleagues.
Are these media templates a one-time purchase?
Yes. Each template is a one-time purchase with an instant download, and there is no subscription or per-user fee. You keep the file, can reuse it every year by entering new actuals and targets, and can rebrand it with your publication's logo and colours.
Get more media and publishing templates
Ready to replace the monthly spreadsheet scramble? Start with our best overall publishing dashboard, the Publishing KPI Dashboard in Excel ($14.99), or the best-value Publishing Industry KPI Dashboard in Power BI ($11.99). Every option above is a one-time purchase between $11.99 and $14.99.
Running the commercial side as well? See our marketing KPI dashboard templates, the 15 sales KPIs to track in 2026 for advertising sales teams, the lead tracker to pipeline dashboard stack for sponsorship deals, HR KPIs for newsroom staffing, and the 25 best-selling business templates. Subscribe to the NextGenTemplates YouTube channel for setup tutorials.